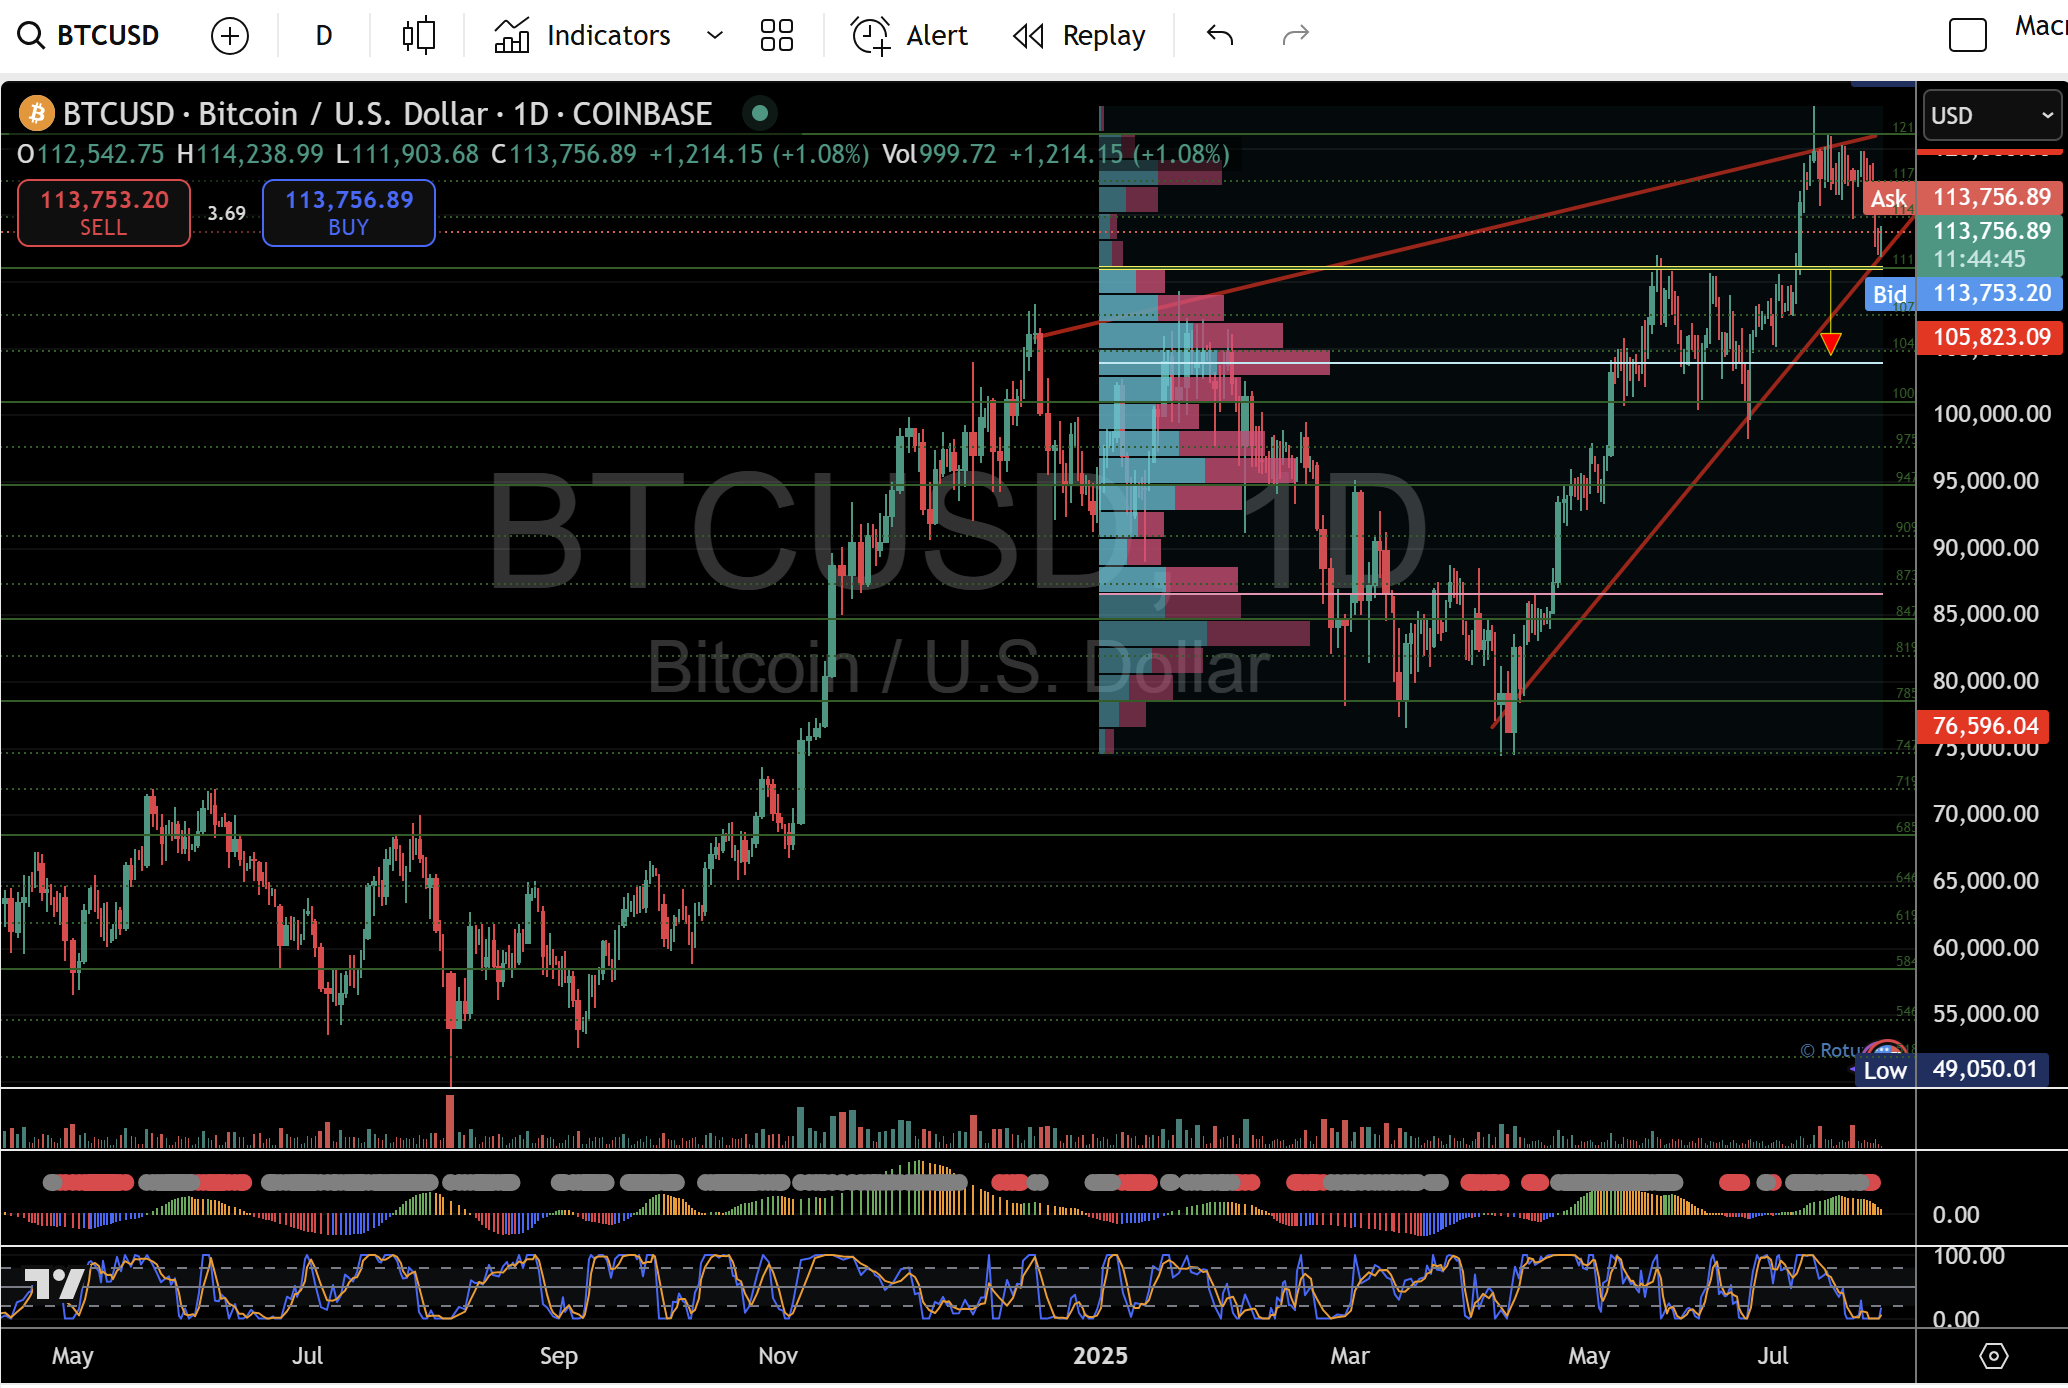
Bitcoin’s Make-or-Break Moment: Bullish $111K Breakout Looms as Rising Wedge Nears Climax
Bitcoin's chart is screaming for attention—a textbook rising wedge formation sets the stage for a volatility bomb. The $111,000 threshold isn't just a number; it's the line between crypto euphoria and a humbling reality check.
The Technical Tug-of-War
Every trader's screen flashes the same pattern: converging trendlines squeezing BTC like a spring. Break north, and institutional FOMO fuels the next leg up. Stumble here, and even the diamond hands start sweating.
Market Psychology at the Edge
Hedge funds whisper about 'asymmetric upside' while quietly tightening stop-losses. Retail? They're either leveraged long or waiting to buy 'the dip'—classic crypto bipolar disorder.
One hedge fund manager quipped, 'We'll either be toasting champagne or explaining drawdowns to limited partners.' Welcome to crypto—where technicals meet tribal warfare.

Crucial levels to watch
- Holds here → wedge remains intact, fresh leg toward $114 865, $117 596, and retest of $121 000 possible.
- Break below → confirms wedge breakdown, opening doors to deeper pullbacks.
- Confluence of the wedge midpoint and previous congestion zone; likely to attract dip buyers.
- The year-to-date volume node; a typical “normal” retracement would pause here.
- Breach of this level risks invading the 2025-range low, shifting medium-term bias bearish.
What lies ahead
- Bearish scenario: A daily close below $111,000 could trigger stop-runs into the $100,000 area, potentially cascading into the $95,000 band before finding strong buying interest.
- Bullish scenario: Sustained support at $111 000, accompanied by rising volume, would suggest one last compression toward the wedge apex—aiming for a break above $121 000 and a possible extension toward $130 000+.
Traders should monitor the wedge trend lines, volume profile clusters, and momentum oscillators for the clearest signal of which path BTC will take next.

