Stellar (XLM) Primed for Breakout: Bullish Signals Flash as Accumulation Zone Solidifies

Stellar's XLM is painting a classic accumulation pattern—and traders are taking notice. The blockchain's native token shows textbook bullish divergence as whales quietly position for the next leg up.
Why this rally could have staying power
Unlike meme coins that rely on hype cycles, XLM's fundamentals back the technical setup. The network's cross-border payment solutions are gaining traction just as institutional interest in crypto infrastructure heats up.
The cynical take? Wall Street will 'discover' Stellar right as retail investors get bored waiting—classic finance theater. But the charts don't lie: this accumulation phase suggests smart money is building positions before the next big move.
Stellar’s derivatives and on-chain data suggest a potential reversal
Stellar’s derivatives data hints at a potential reversal. According to Coinglass, the long-to-short ratio for XLM has reached 1.14 on Thursday, the highest level in over a month. The ratio above one suggests that more traders are betting on XLM’s price to rally.
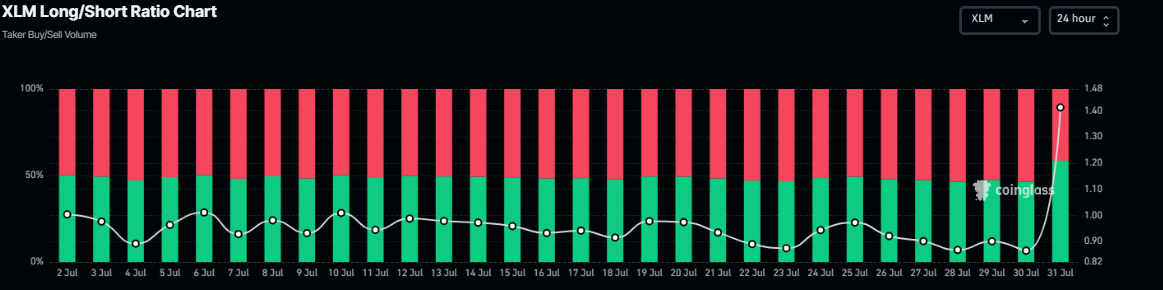
XLM long-to-short ratio chart. Source: Coinglass
XLM’s funding rate data is positive and reads 0.0085% on Thursday, indicating that longs are paying shorts. Generally, a positive rate (longs pay shorts) indicates bullish sentiment, while negative numbers (shorts pay longs) indicate bearishness.
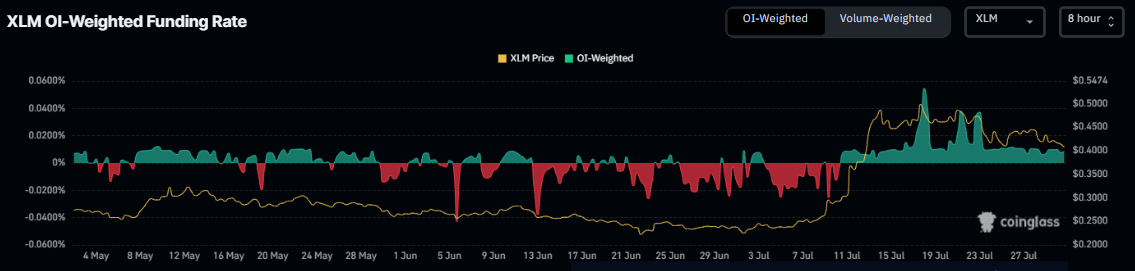
XLM funding rate chart. Source: Coinglass
CryptoQuant Spot Retail Activity Through Trading Frequency Surge data shows that XLM currently has less retail activity. Historically, when XLM had little retail speculation, it cleared the way for sustained, trend-based movements, boosting its prices.
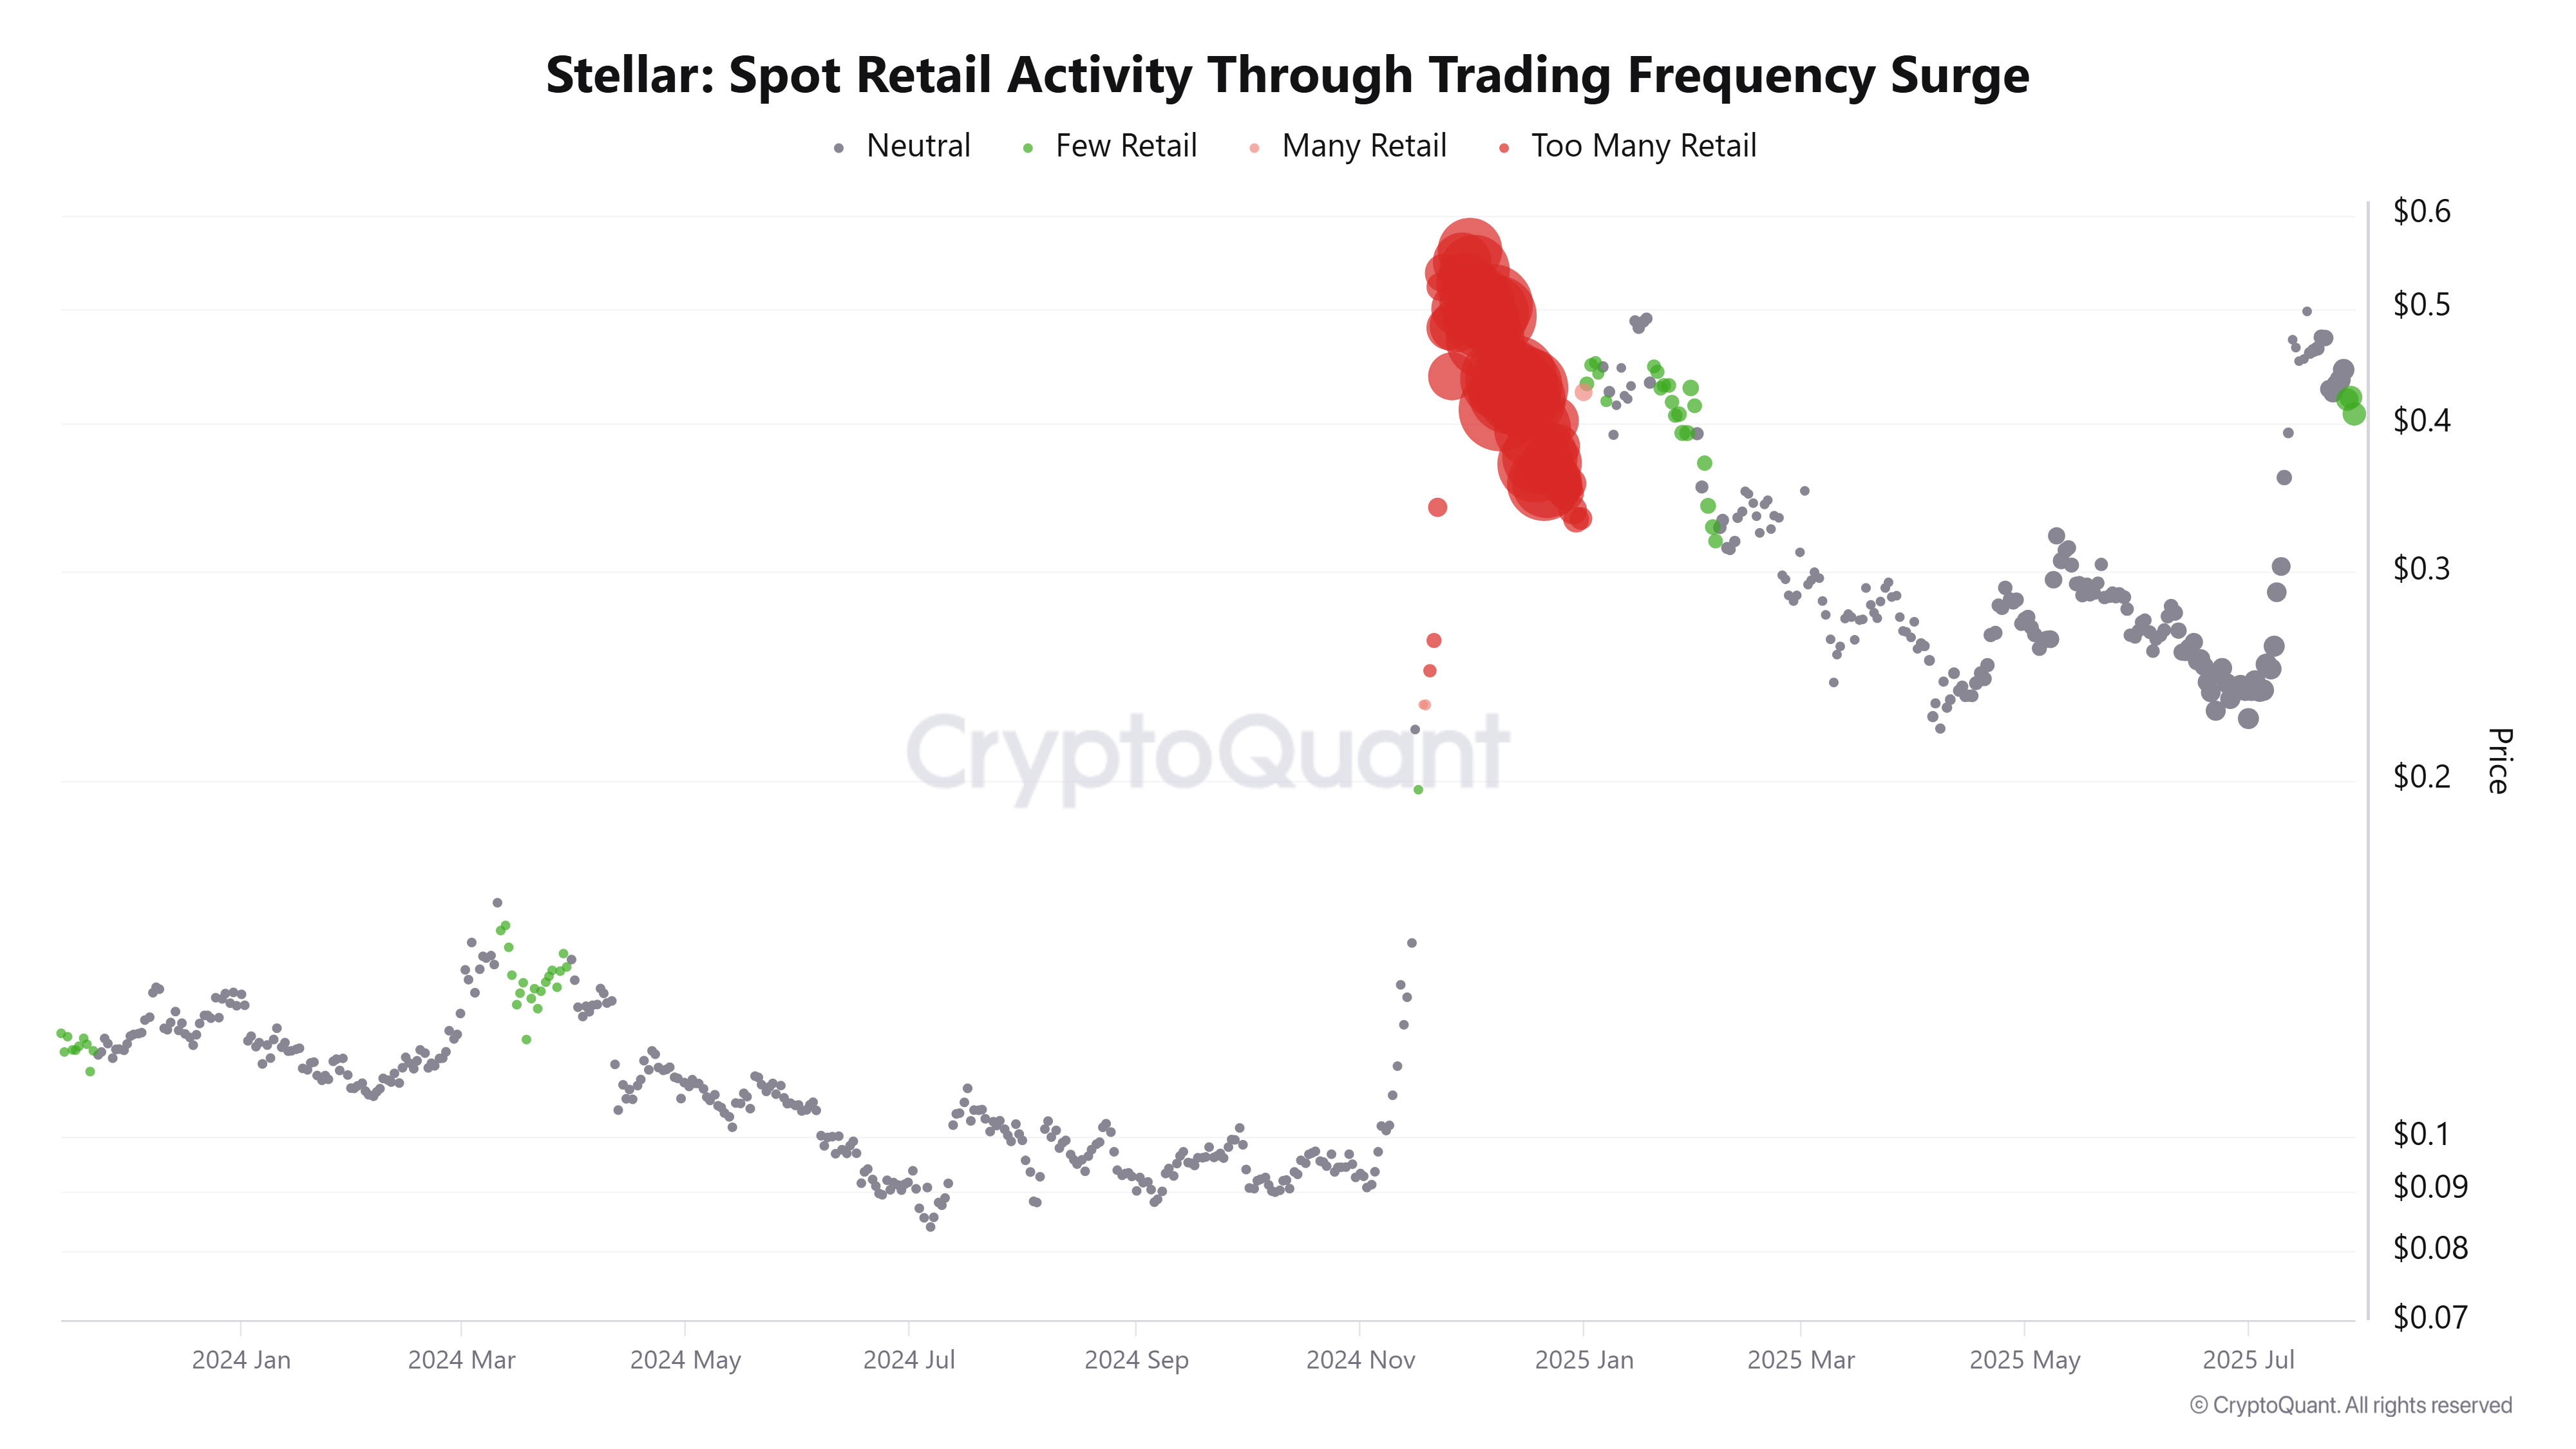
XLM Spot Retail Activity Through Trading Frequency Surge chart. Source: CryptoQuant
Stellar Price Forecast: XLM shows a bullish pennant pattern
Stellar price trades inside a bullish pennant pattern formed by connecting two trendlines, joining the highs and lows. This pattern favours the bull as it is formed after a massive upward price trend, and a breakout indicates continuation of the upward momentum. At the time of writing on Thursday, XLM trades around $0.42 within the pattern.
Sideline investors looking to accumulate XLM could do so between $0.40 and $0.36, support ranges, with a tighter stop loss below its 50-day Exponential Moving Average at $0.35.
If XLM breaks above this pennant pattern, it could extend the rally toward its July 18 high at $0.52. A successful close above this level could extend gains towards its November high of $0.63.
The Relative Strength Index (RSI) on the daily chart reads 54, after bouncing off its neutral level of 50 and pointing upwards, indicating bullish momentum is gaining traction.
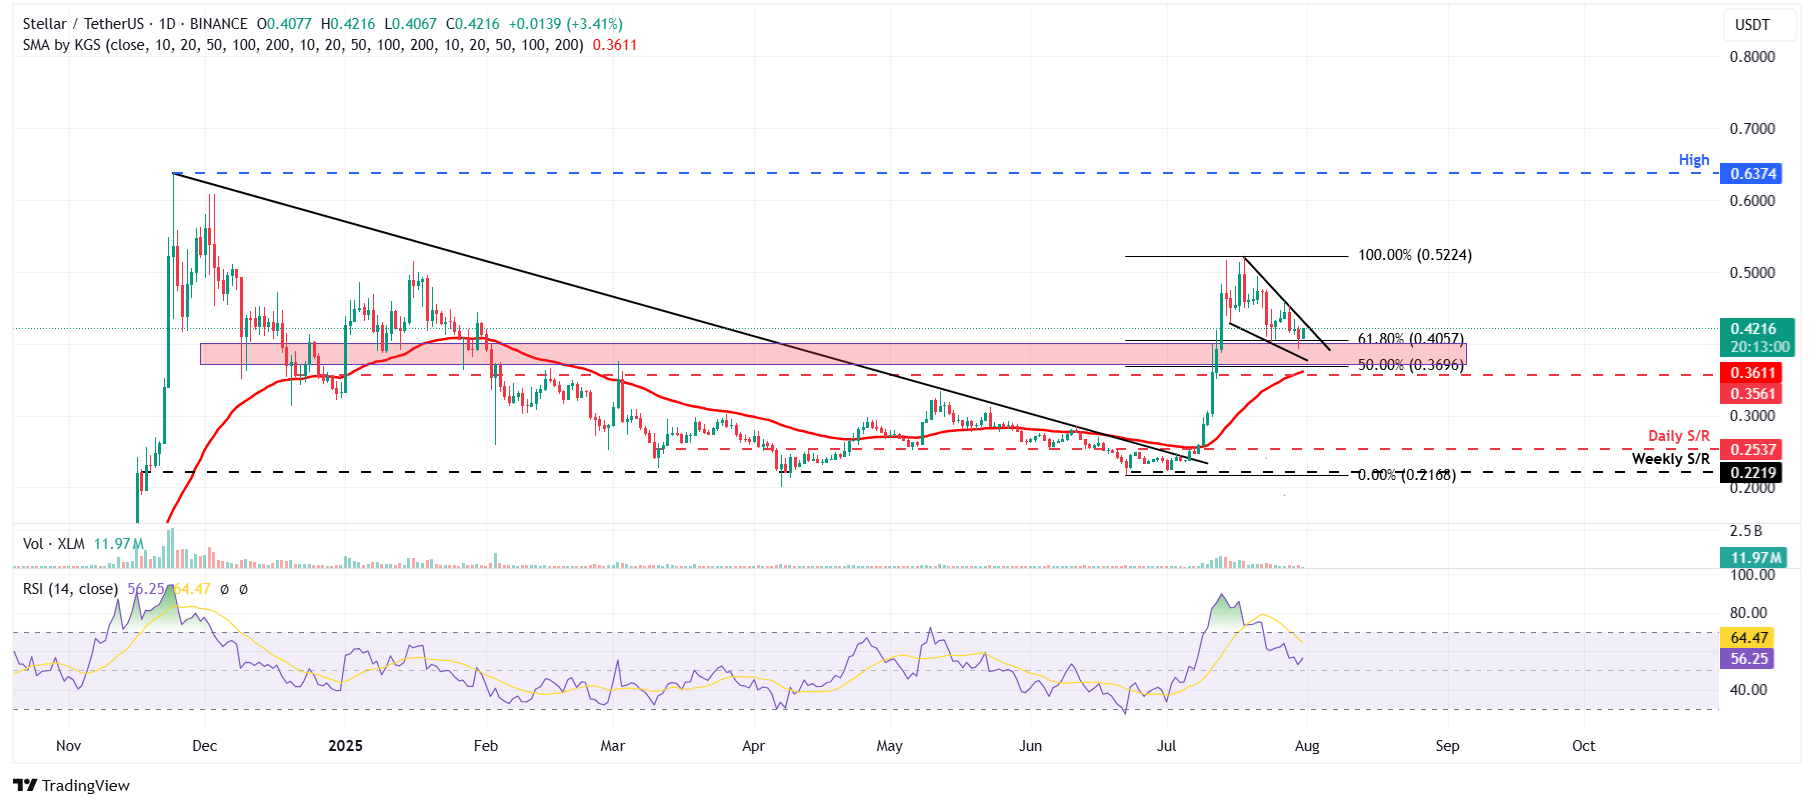
XLM/USDT daily chart
However, if XLM faces a correction, it could extend the decline toward its 50-day EMA at $0.35.
