Toncoin Price Explosion: TON Primed for 20% Rally as Whales Gobble Up Supply & Open Interest Soars

Whales are circling, futures traders are piling in—and Toncoin's gearing up for a potential breakout.
Open interest spikes while big players accumulate. Here's why TON could defy the crypto winter.
• Whale watch: On-chain data shows large holders aggressively buying the dip
• Derivatives heat up: Open interest climbs as traders bet on upside
• Technical setup: The 20% surge target comes from a bullish pennant formation
Of course, this could just be another 'institutional adoption' narrative before the usual rug pull. But for now, the numbers don't lie.
A boost in whale confidence
Santiment data shows the group of investors holding over 100,000 TON have acquired 120,000 TON so far in July, expanding the portfolio to 5.61 million TON. Sidelined investors could consider this a buying opportunity as the whales’ buying spree often foreshadows a bullish run.
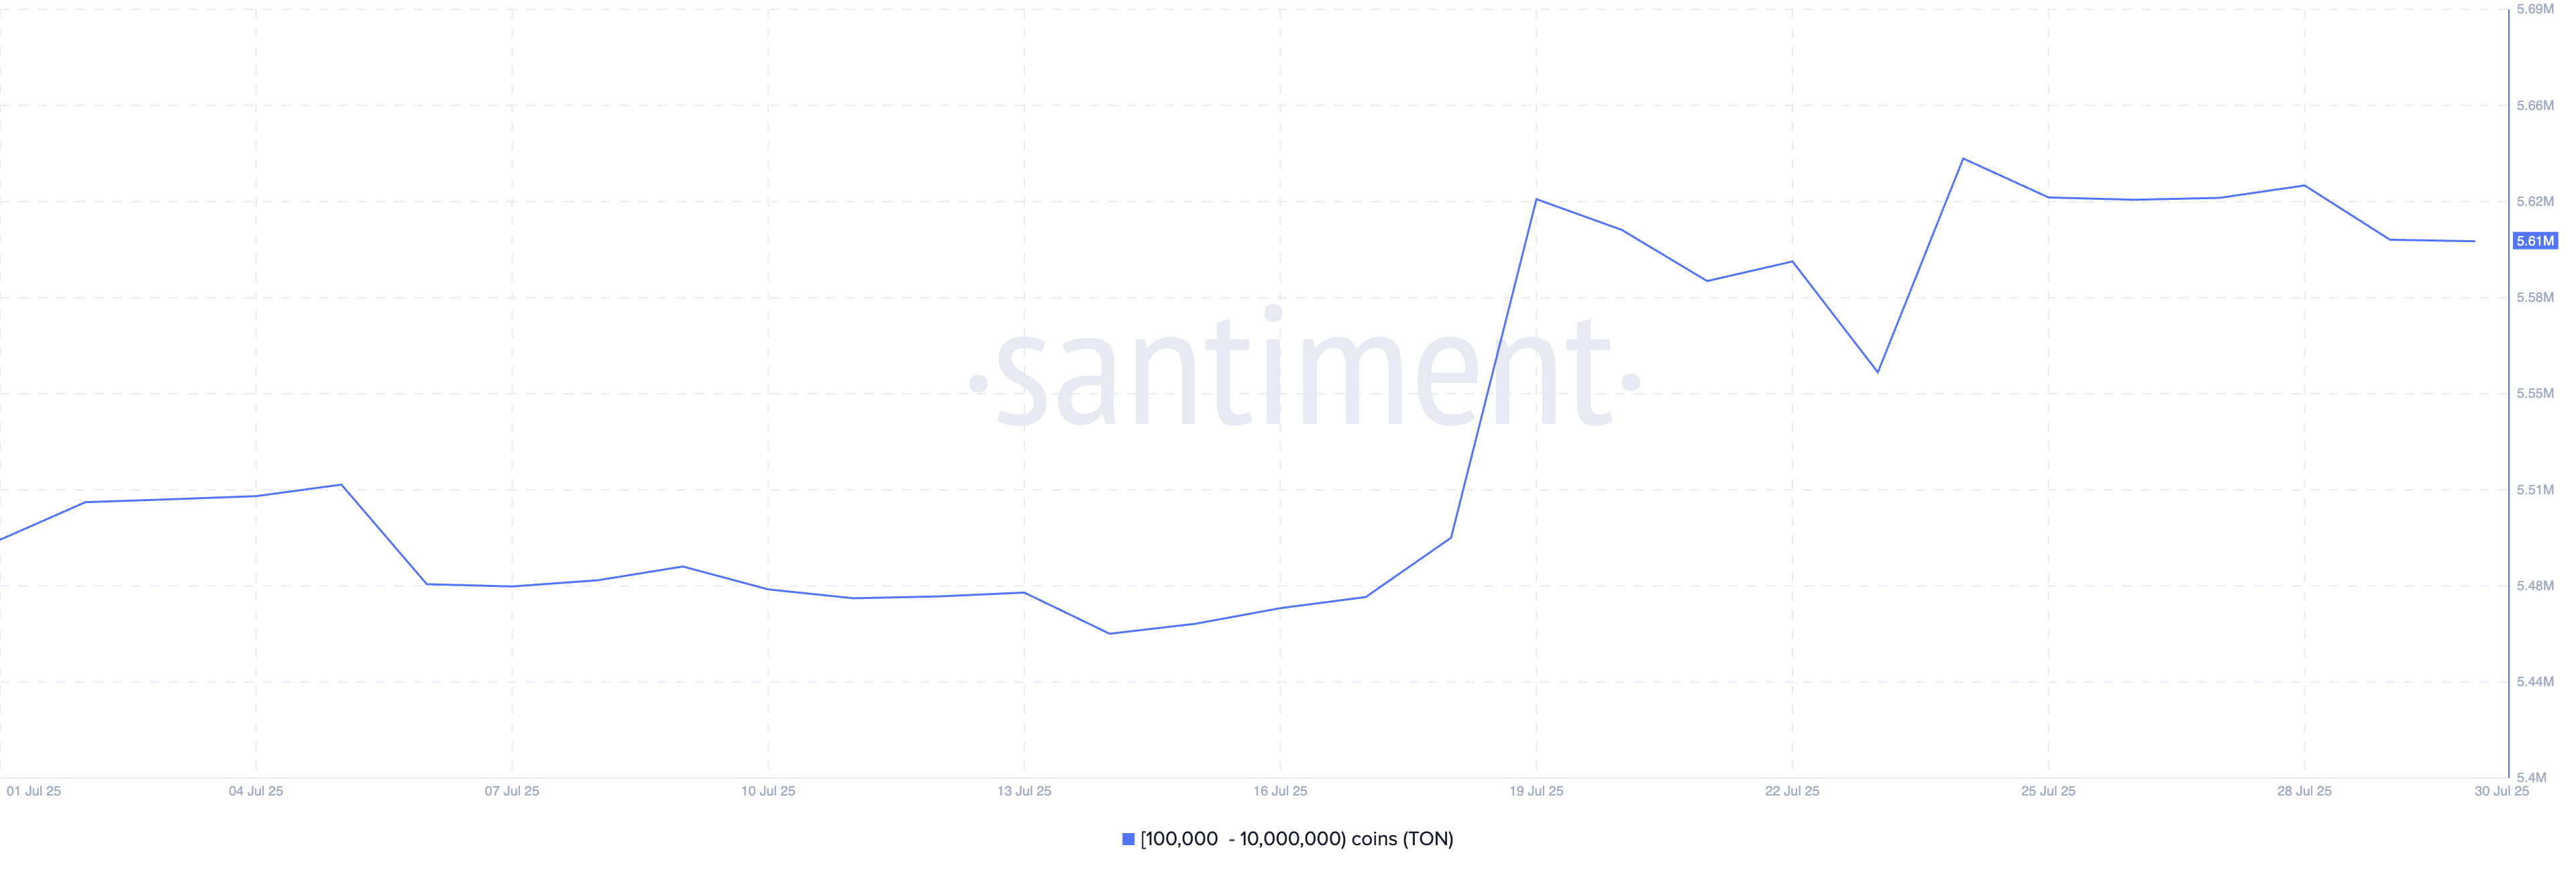
Toncoin supply distribution. Source: Santiment
Heightened optimism surrounds Toncoin derivatives
The interest surrounding Toncoin holds steady, as evidenced by the Open Interest (OI) chart shared below. CoinGlass’ data shows a 12.55% surge over the last 24 hoursin TON OI, reaching $344.57 million and inching closer to its all-time high of $362.85 million set on August 26, 2024. A rise in OI reflects increased capital inflows in the TON futures and option contracts.
OI-weighted funding rate at 0.0060% suggests a buy-side dominance as bulls are imposed to pay the funding rates when positive, offsetting the swap and spot price imbalance caused by sharp price movements.
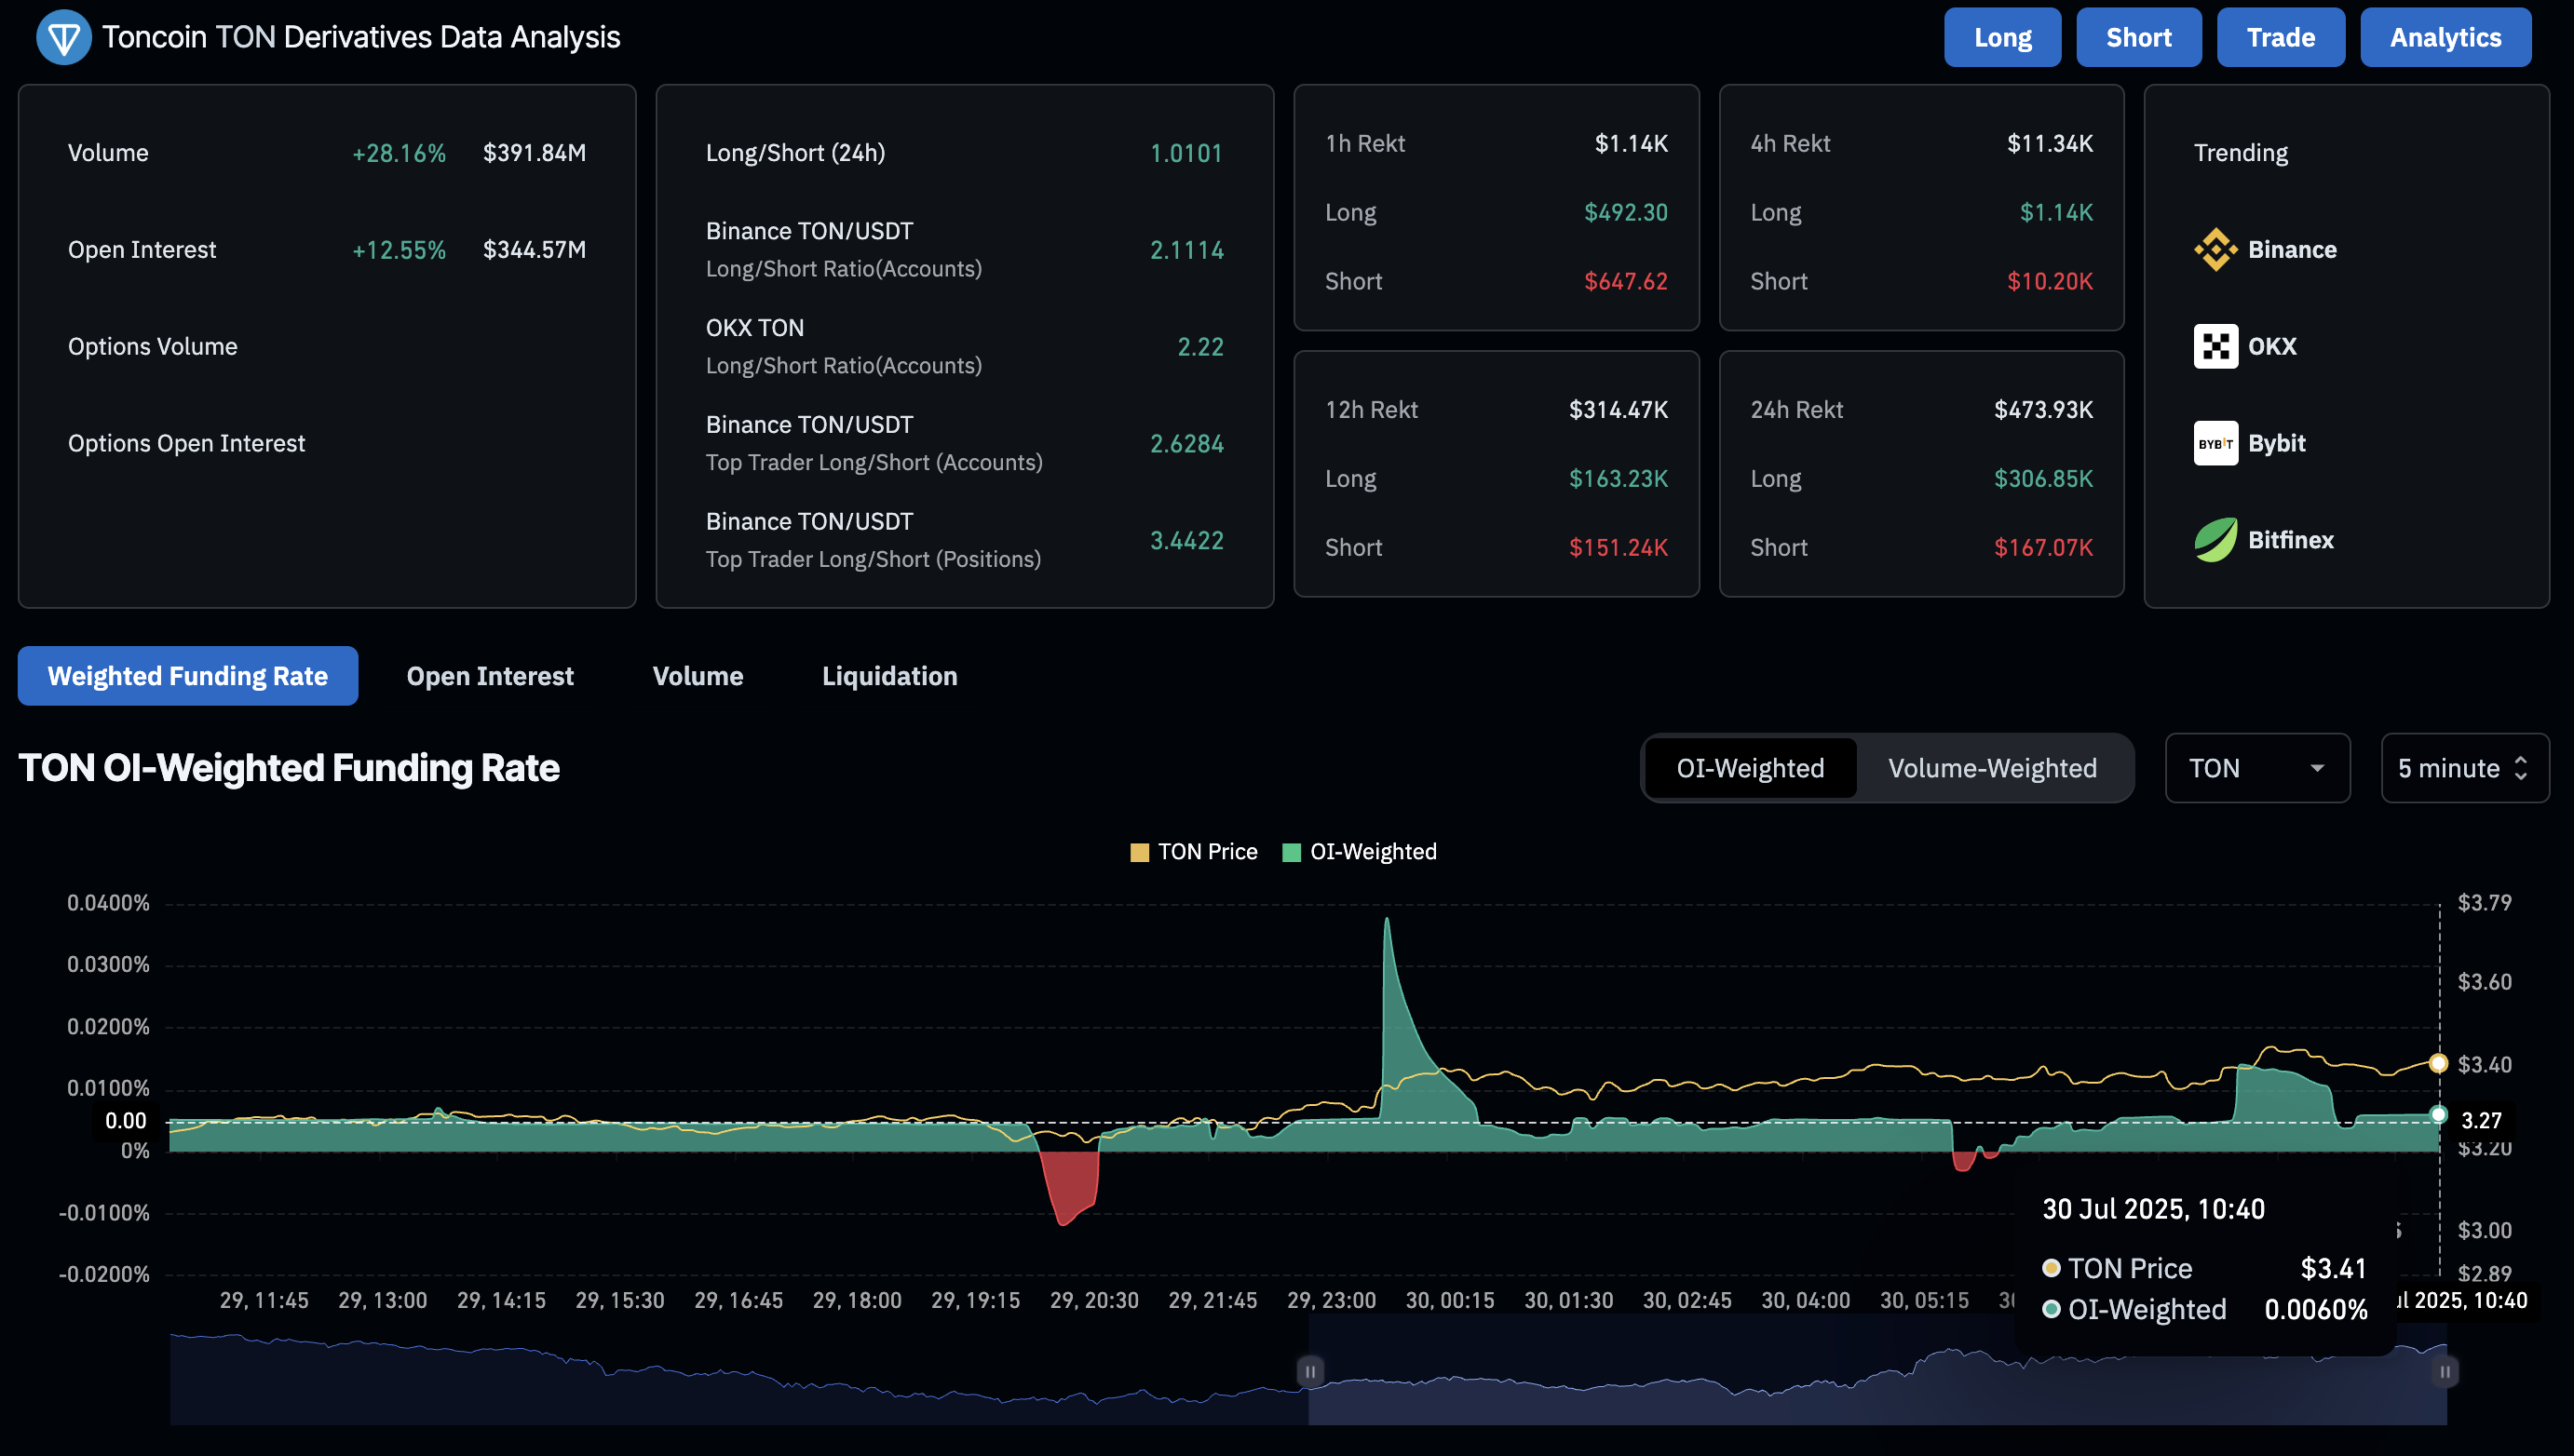
TON derivatives. Source: Coinglass
Toncoin aims to surpass the 200-day EMA
Toncoin’s trendline breakout rally bounces off the 100-day EMA, targeting the 200-day EMA at $3.551. The Relative Strength Index (RSI) reads 63 on the daily chart, pointing upwards, suggesting increased buying pressure with still room for growth before reaching overbought levels.
Still, the Moving Average Convergence Divergence (MACD) indicator suggests that investors limit their exposure as the average lines move closer to each other, hinting at a potential trend reversal. This aligns with the idea of capping buying activities NEAR a crucial resistance.
Investors may find an entry opportunity with a decisive push above the $3.515 resistance level, last tested on July 22, or the 200-day EMA at $3.551. In such a case, the breakout run could target the $4.211 peak marked on April 1, which WOULD represent a 20% rally from the current price levels.
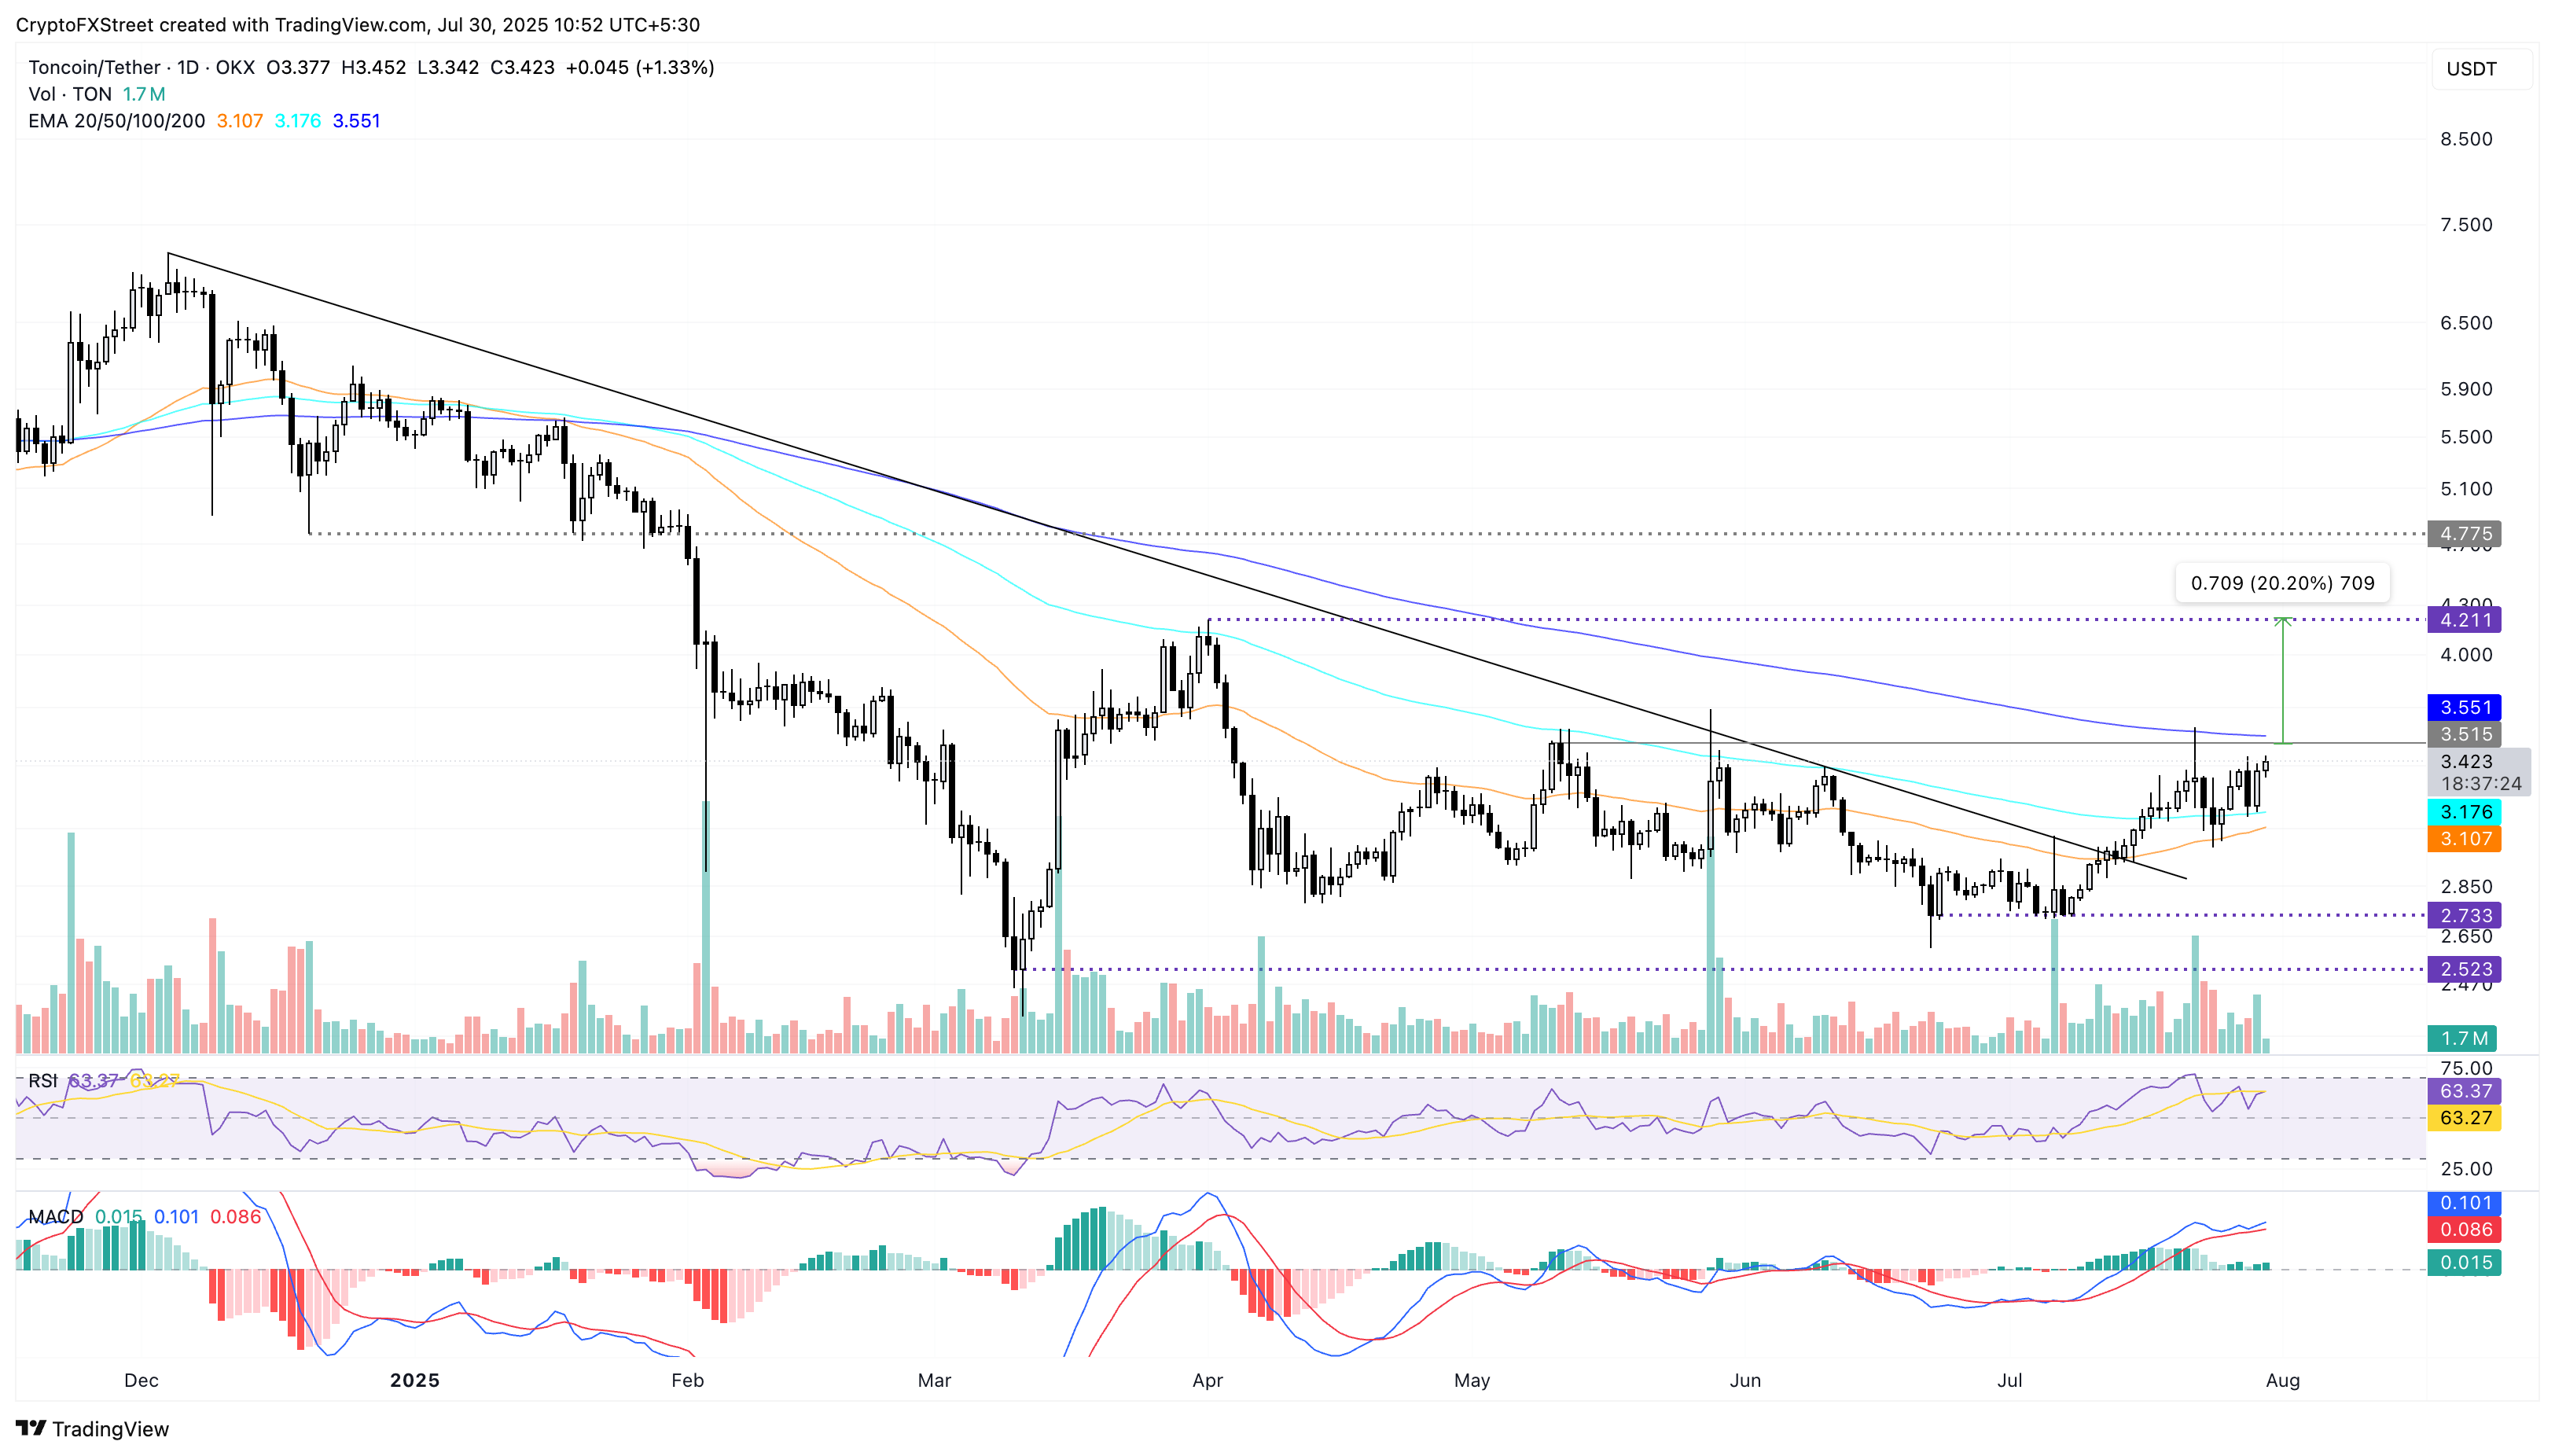
TON/USDT daily price chart.
On the downside, a reversal from the overhead resistance might trigger a pullback to the 100-day EMA at $3.176.
