🚀 PUMP, XDC, FORM Surge 10%+ as Ethereum Eyes $4K Breakout—Altcoins Ride the Wave

Ethereum’s bull run isn’t just padding crypto whales’ portfolios—it’s dragging altcoins like PUMP, XDC, and FORM into double-digit green. Here’s the breakdown.
The ETH Effect: With Ethereum charging toward $4,000, speculative capital’s flooding back into mid-cap tokens. Classic ‘rising tide lifts all boats’—or as cynics call it, ‘greater fools season.’
Altcoin Anomaly: While Bitcoin’s dominance wobbles, these three tokens posted 10%+ gains in 24 hours. No fundamental news—just traders chasing momentum before the next pullback.
Watch the Tape: If ETH clears $4K, expect more altcoin fireworks. If not? Well, at least the leverage longs got a nice screenshot for Twitter.
PUMP breakout rally aims to surpass $0.0030
PUMP records nearly 15% gains on Tuesday to break out of a descending broadening wedge on the 4-hour chart. At the time of writing, the meme coin launchpad token edges lower by nearly 2% as it faces overhead pressure NEAR the $0.0030 round figure.
The altcoin is forming a potential range between horizontal levels of $0.0023 and $0.0030. A potential breakout above the $0.0030 ceiling could extend the rally to $0.0037 level, marked by the June 19 low.
The Moving Average Convergence Divergence (MACD) and its signal line remain in a downtrend but flash a neutral signal as it remains below the zero line. Investors could consider the resurfacing of average lines above the zero line as a buy signal.
The Relative Strength Index (RSI) reads 51 on the 4-hour chart following a bounce back from the oversold level, indicating a resurgence in buying pressure. However, the RSI remains neutral as it holds at the midpoint.
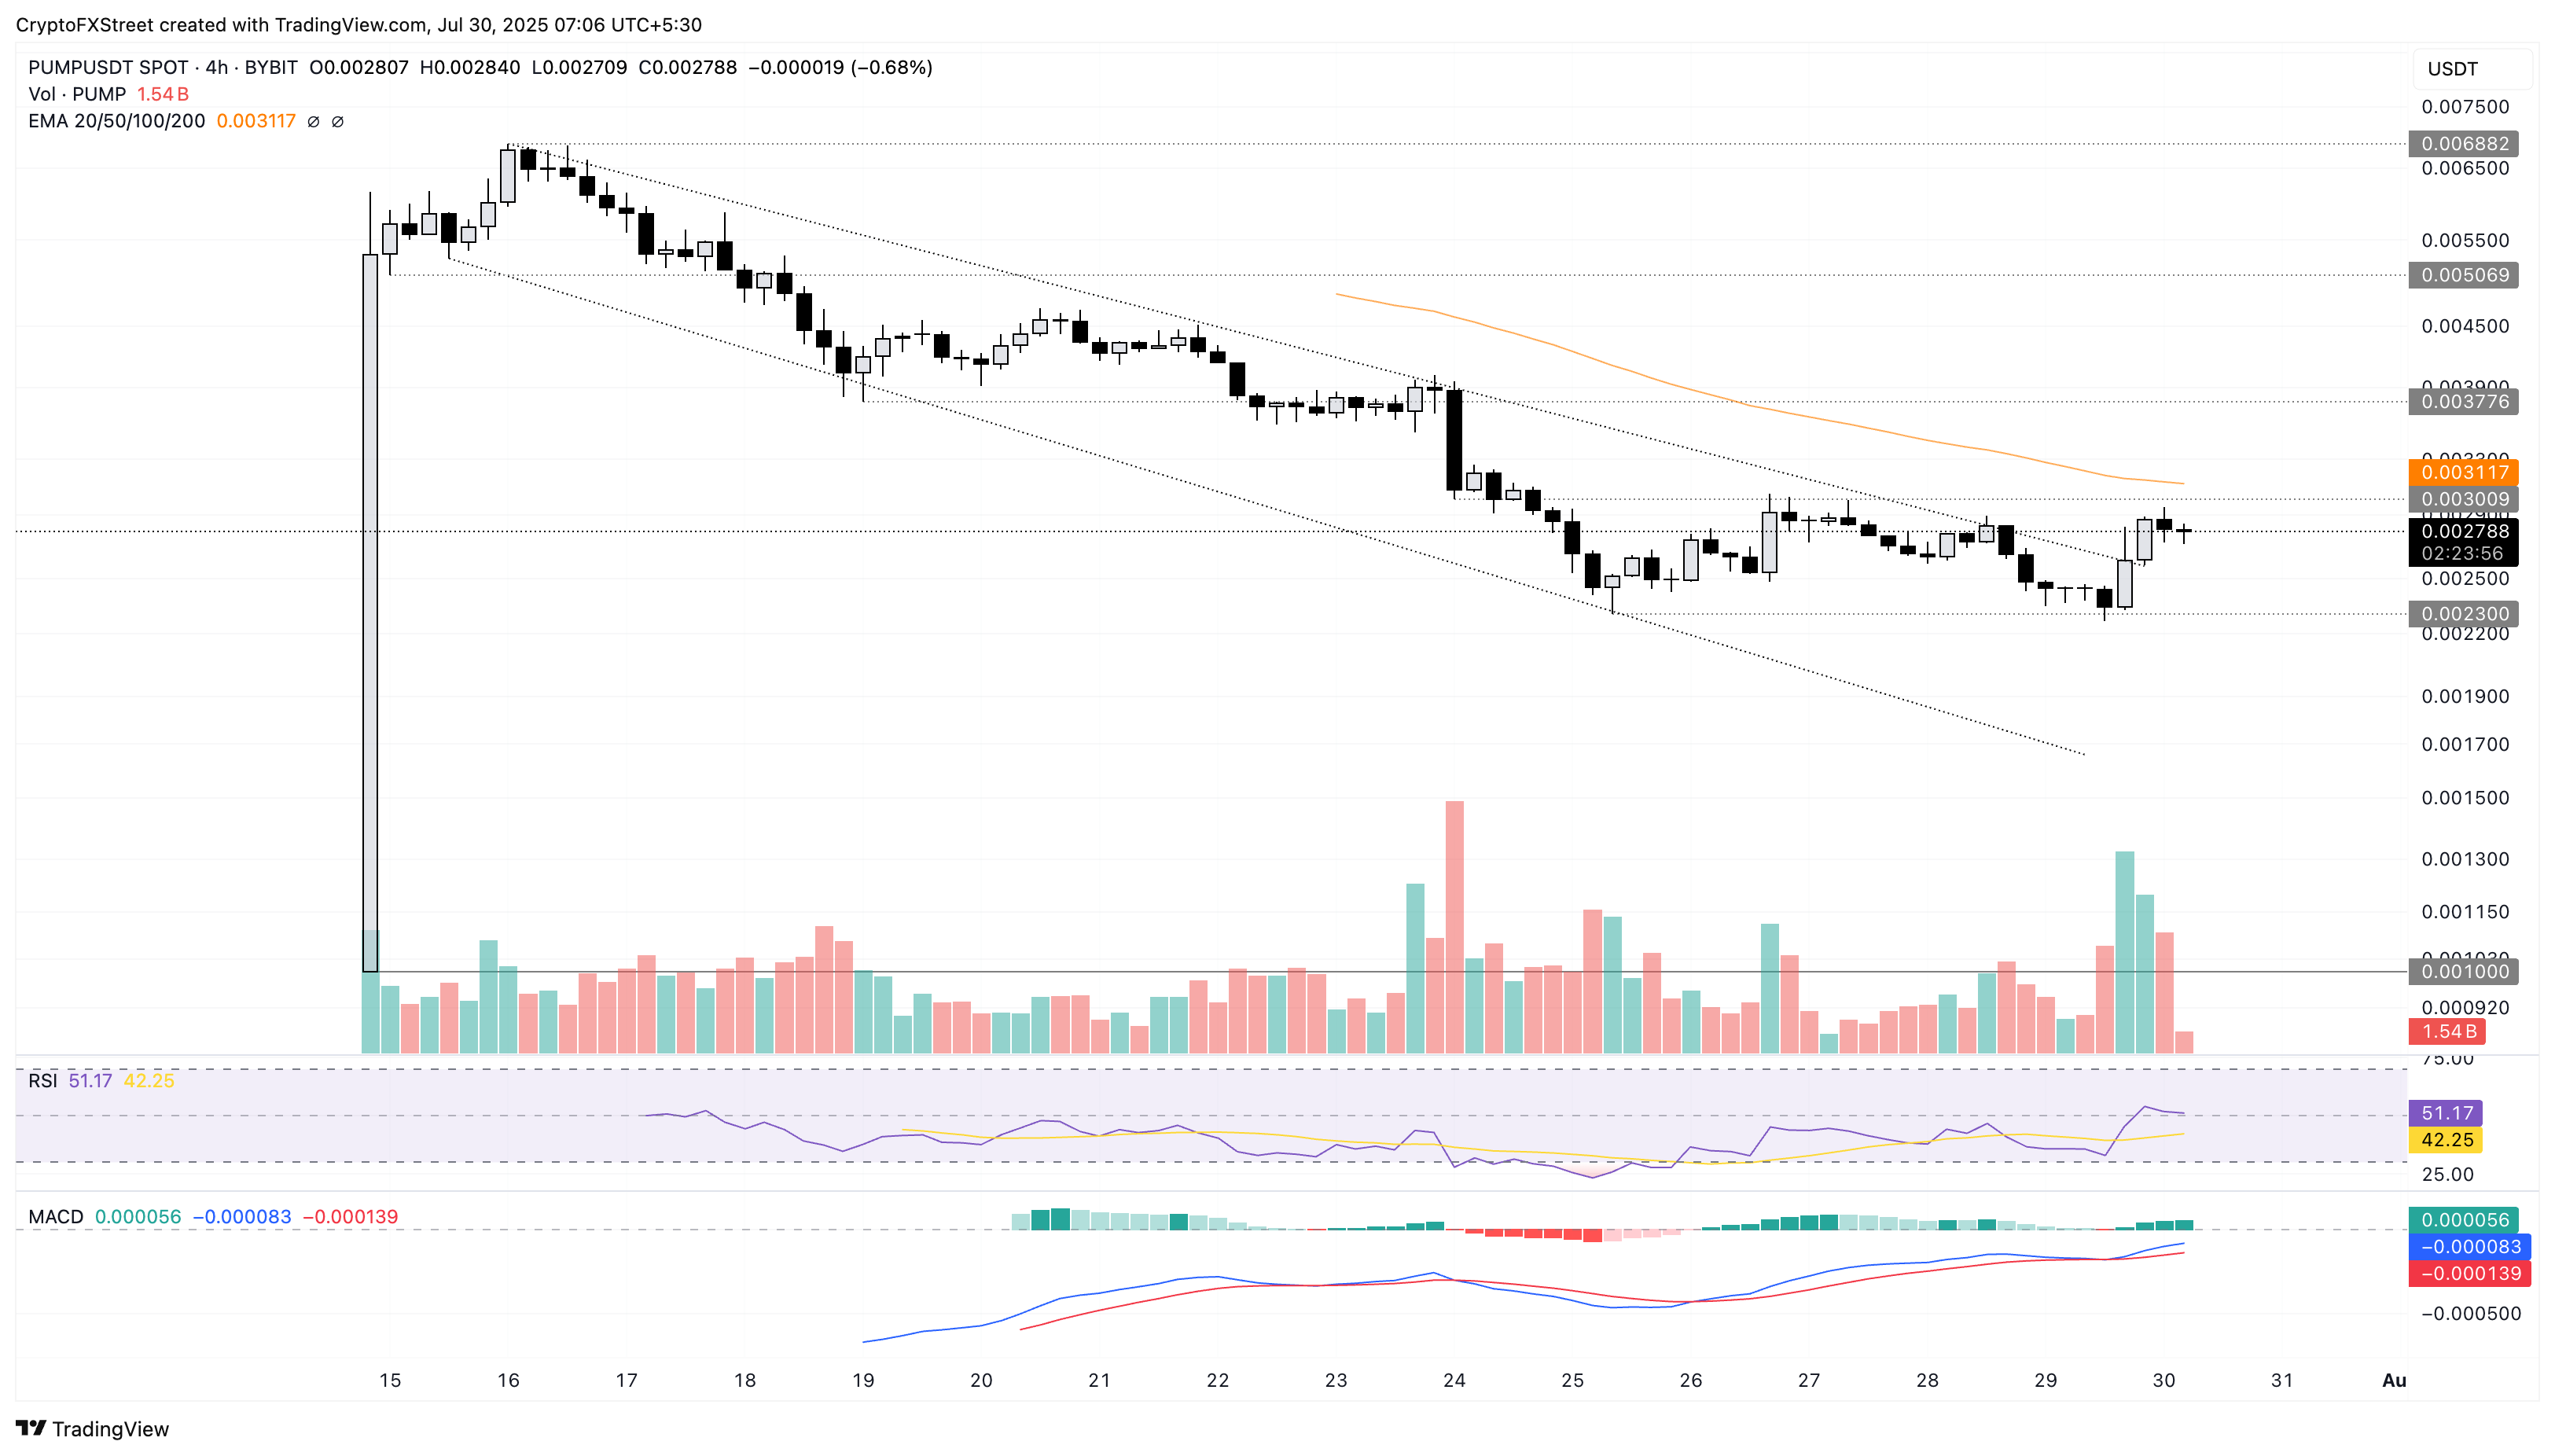 PUMP/USDT daily price chart.
On the flip side, a reversal in PUMP could retest the $0.0023 support level.
XDC hovers at $0.10, aiming for extended gains
XDC Network edges higher to hold at the $0.100 psychological level at press time on Wednesday, following the 12% gains from the previous day. Price action has displayed a quick V-shaped reversal in XDC over the last week, from the $0.083 support level.
A clean push above the $0.10 level could extend the recovery run to $0.116 level on January 28.
The MACD indicator flashes an indecisive signal as the MACD and signal line remain merged. Still, the RSI edges higher toward the overbought boundary, indicating an increase in buying pressure.
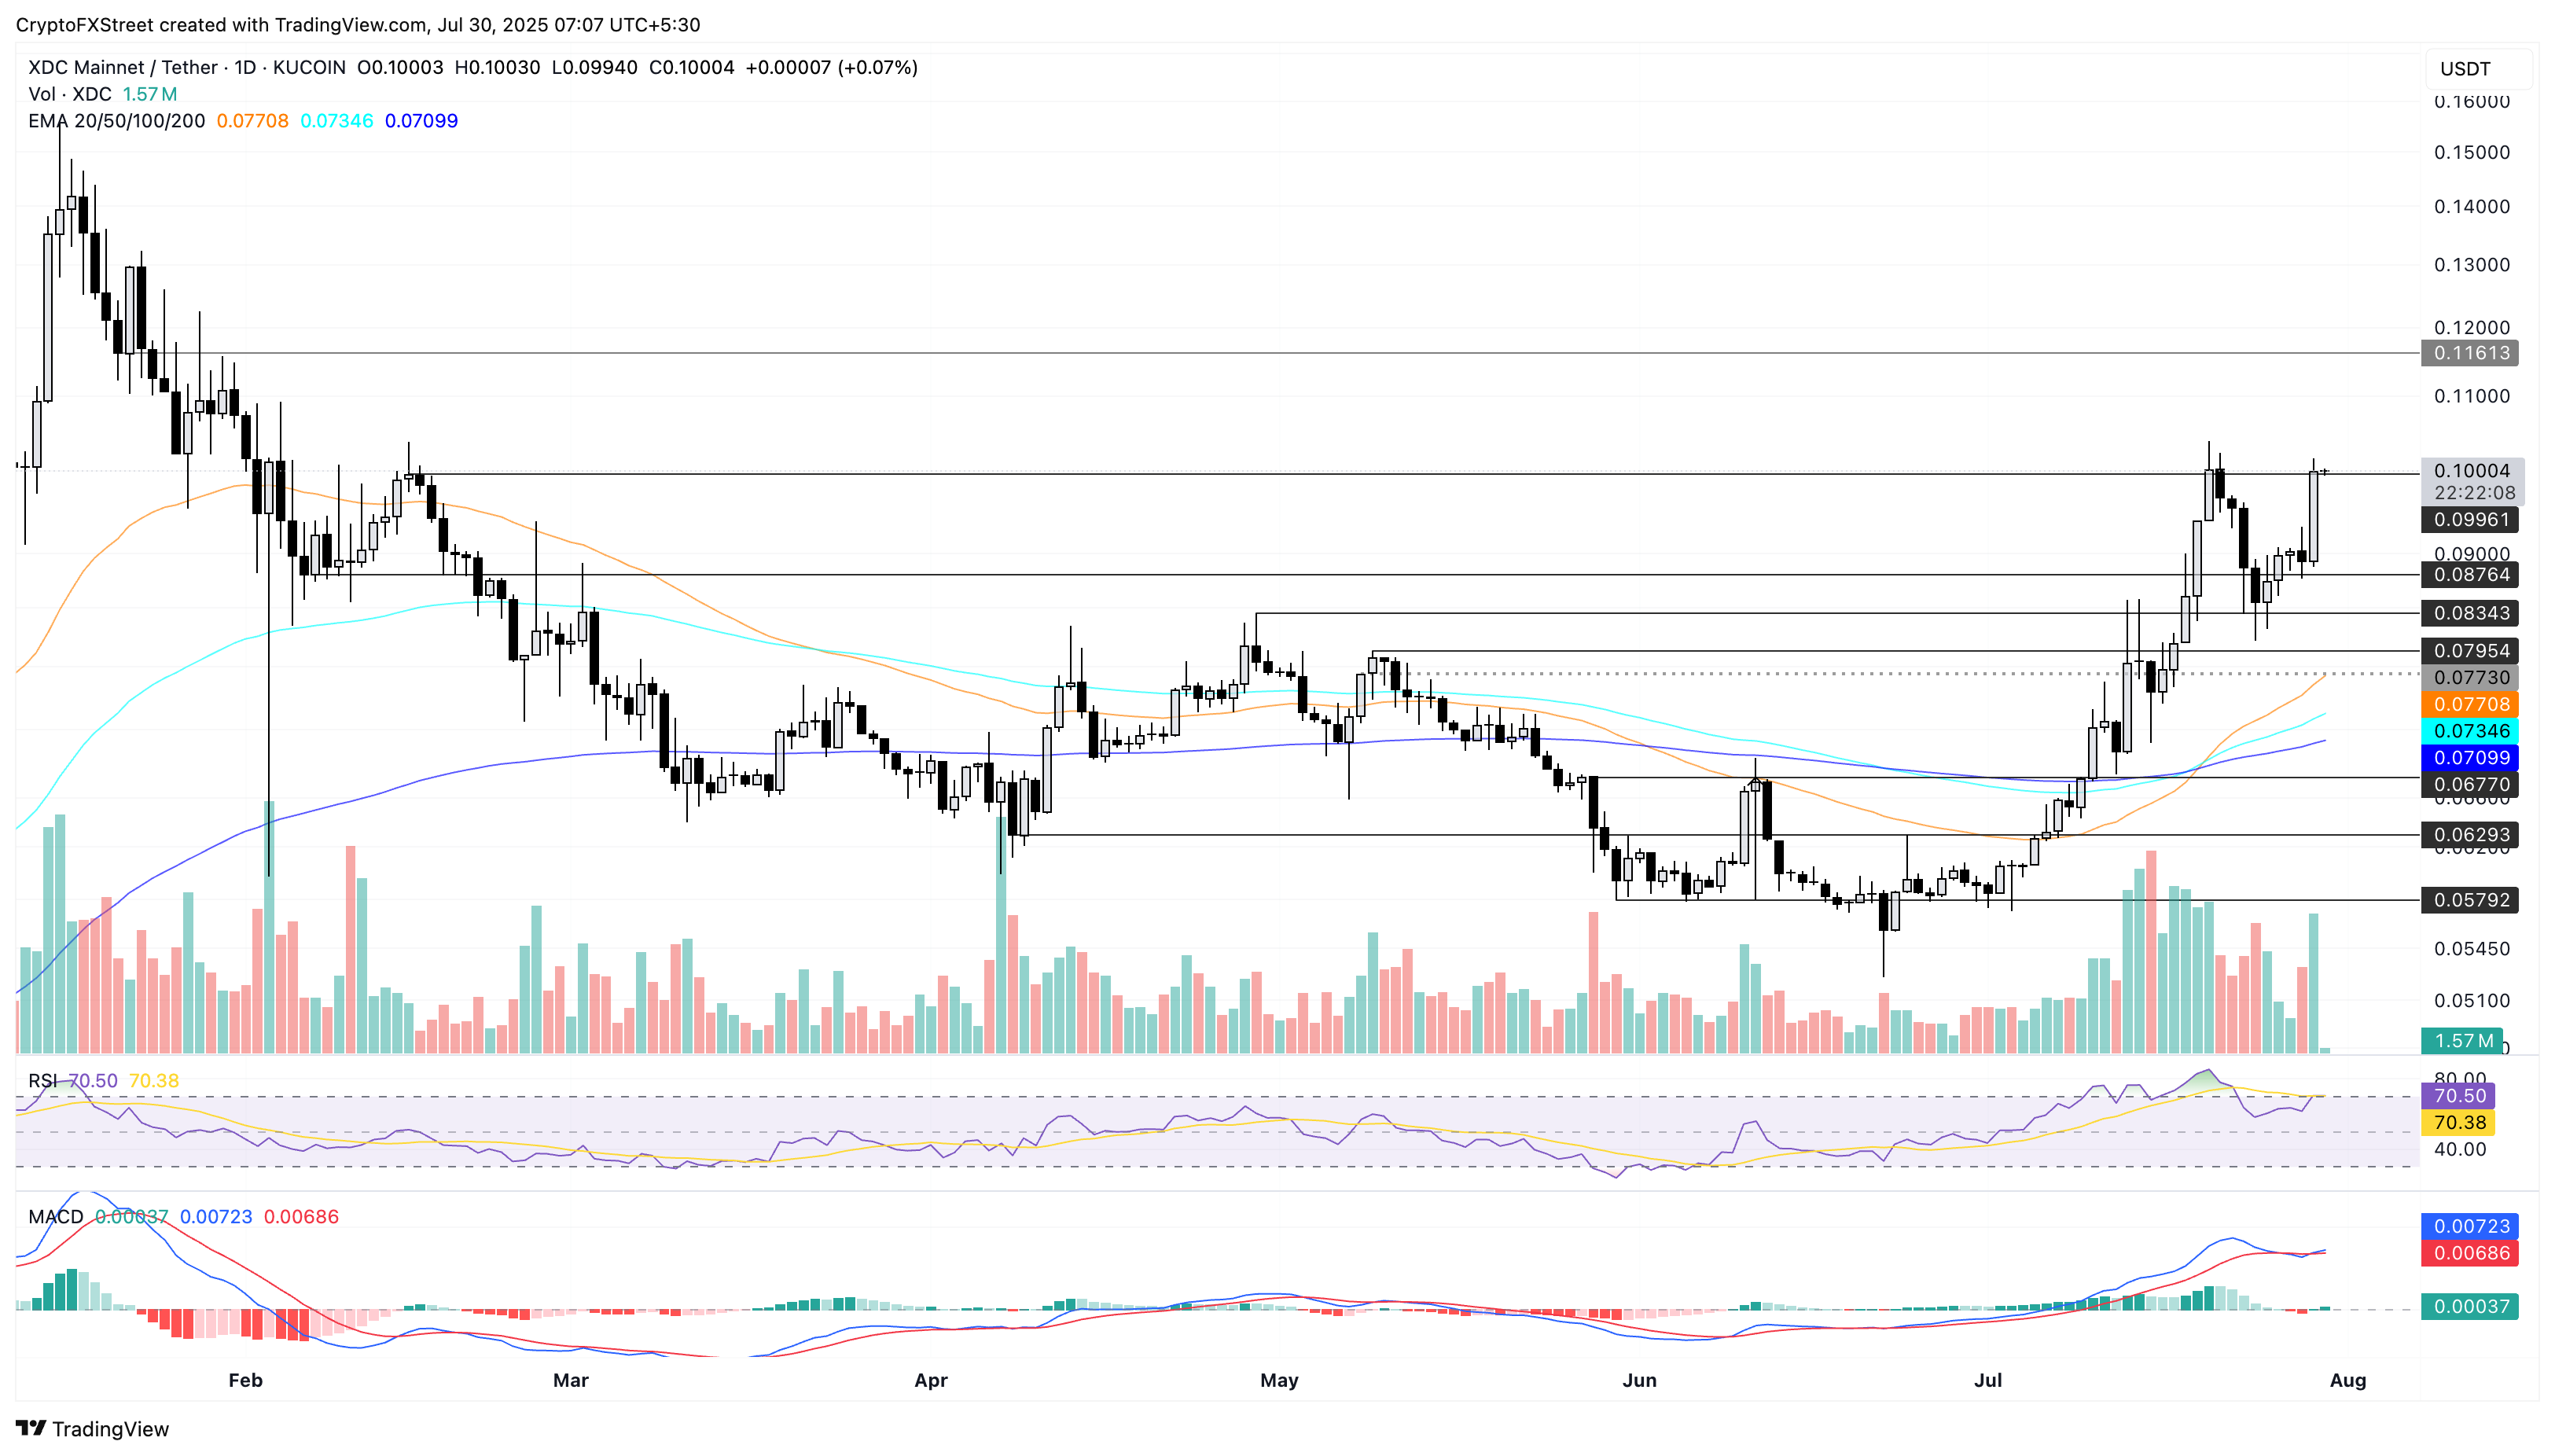
XDC/USDT daily price chart.
On the contrary, a failure to uphold a bullish closing above $0.100 level could result in a reversal to the $0.087 level, marked by the February 6 close.
FORM at record high targets wedge breakout rally
Four maintains the 11% gains from Tuesday at the time of writing, within a rising wedge pattern formed by the two converging trendlines. The resistance trendline is formed by connecting March 19 and July 11 peaks, while the ascending support trendline connects the June 22 and July 29 lows.
A decisive close above the overhead trendline near the $4.00 psychological level could extend the breakout rally to the $4.19 level, coinciding with the R3 pivot level.
The RSI at 69 hovers close to the overbought zone, indicating steady buying pressure. The MACD crosses above its signal line, flashing a buy signal for sidelined investors.
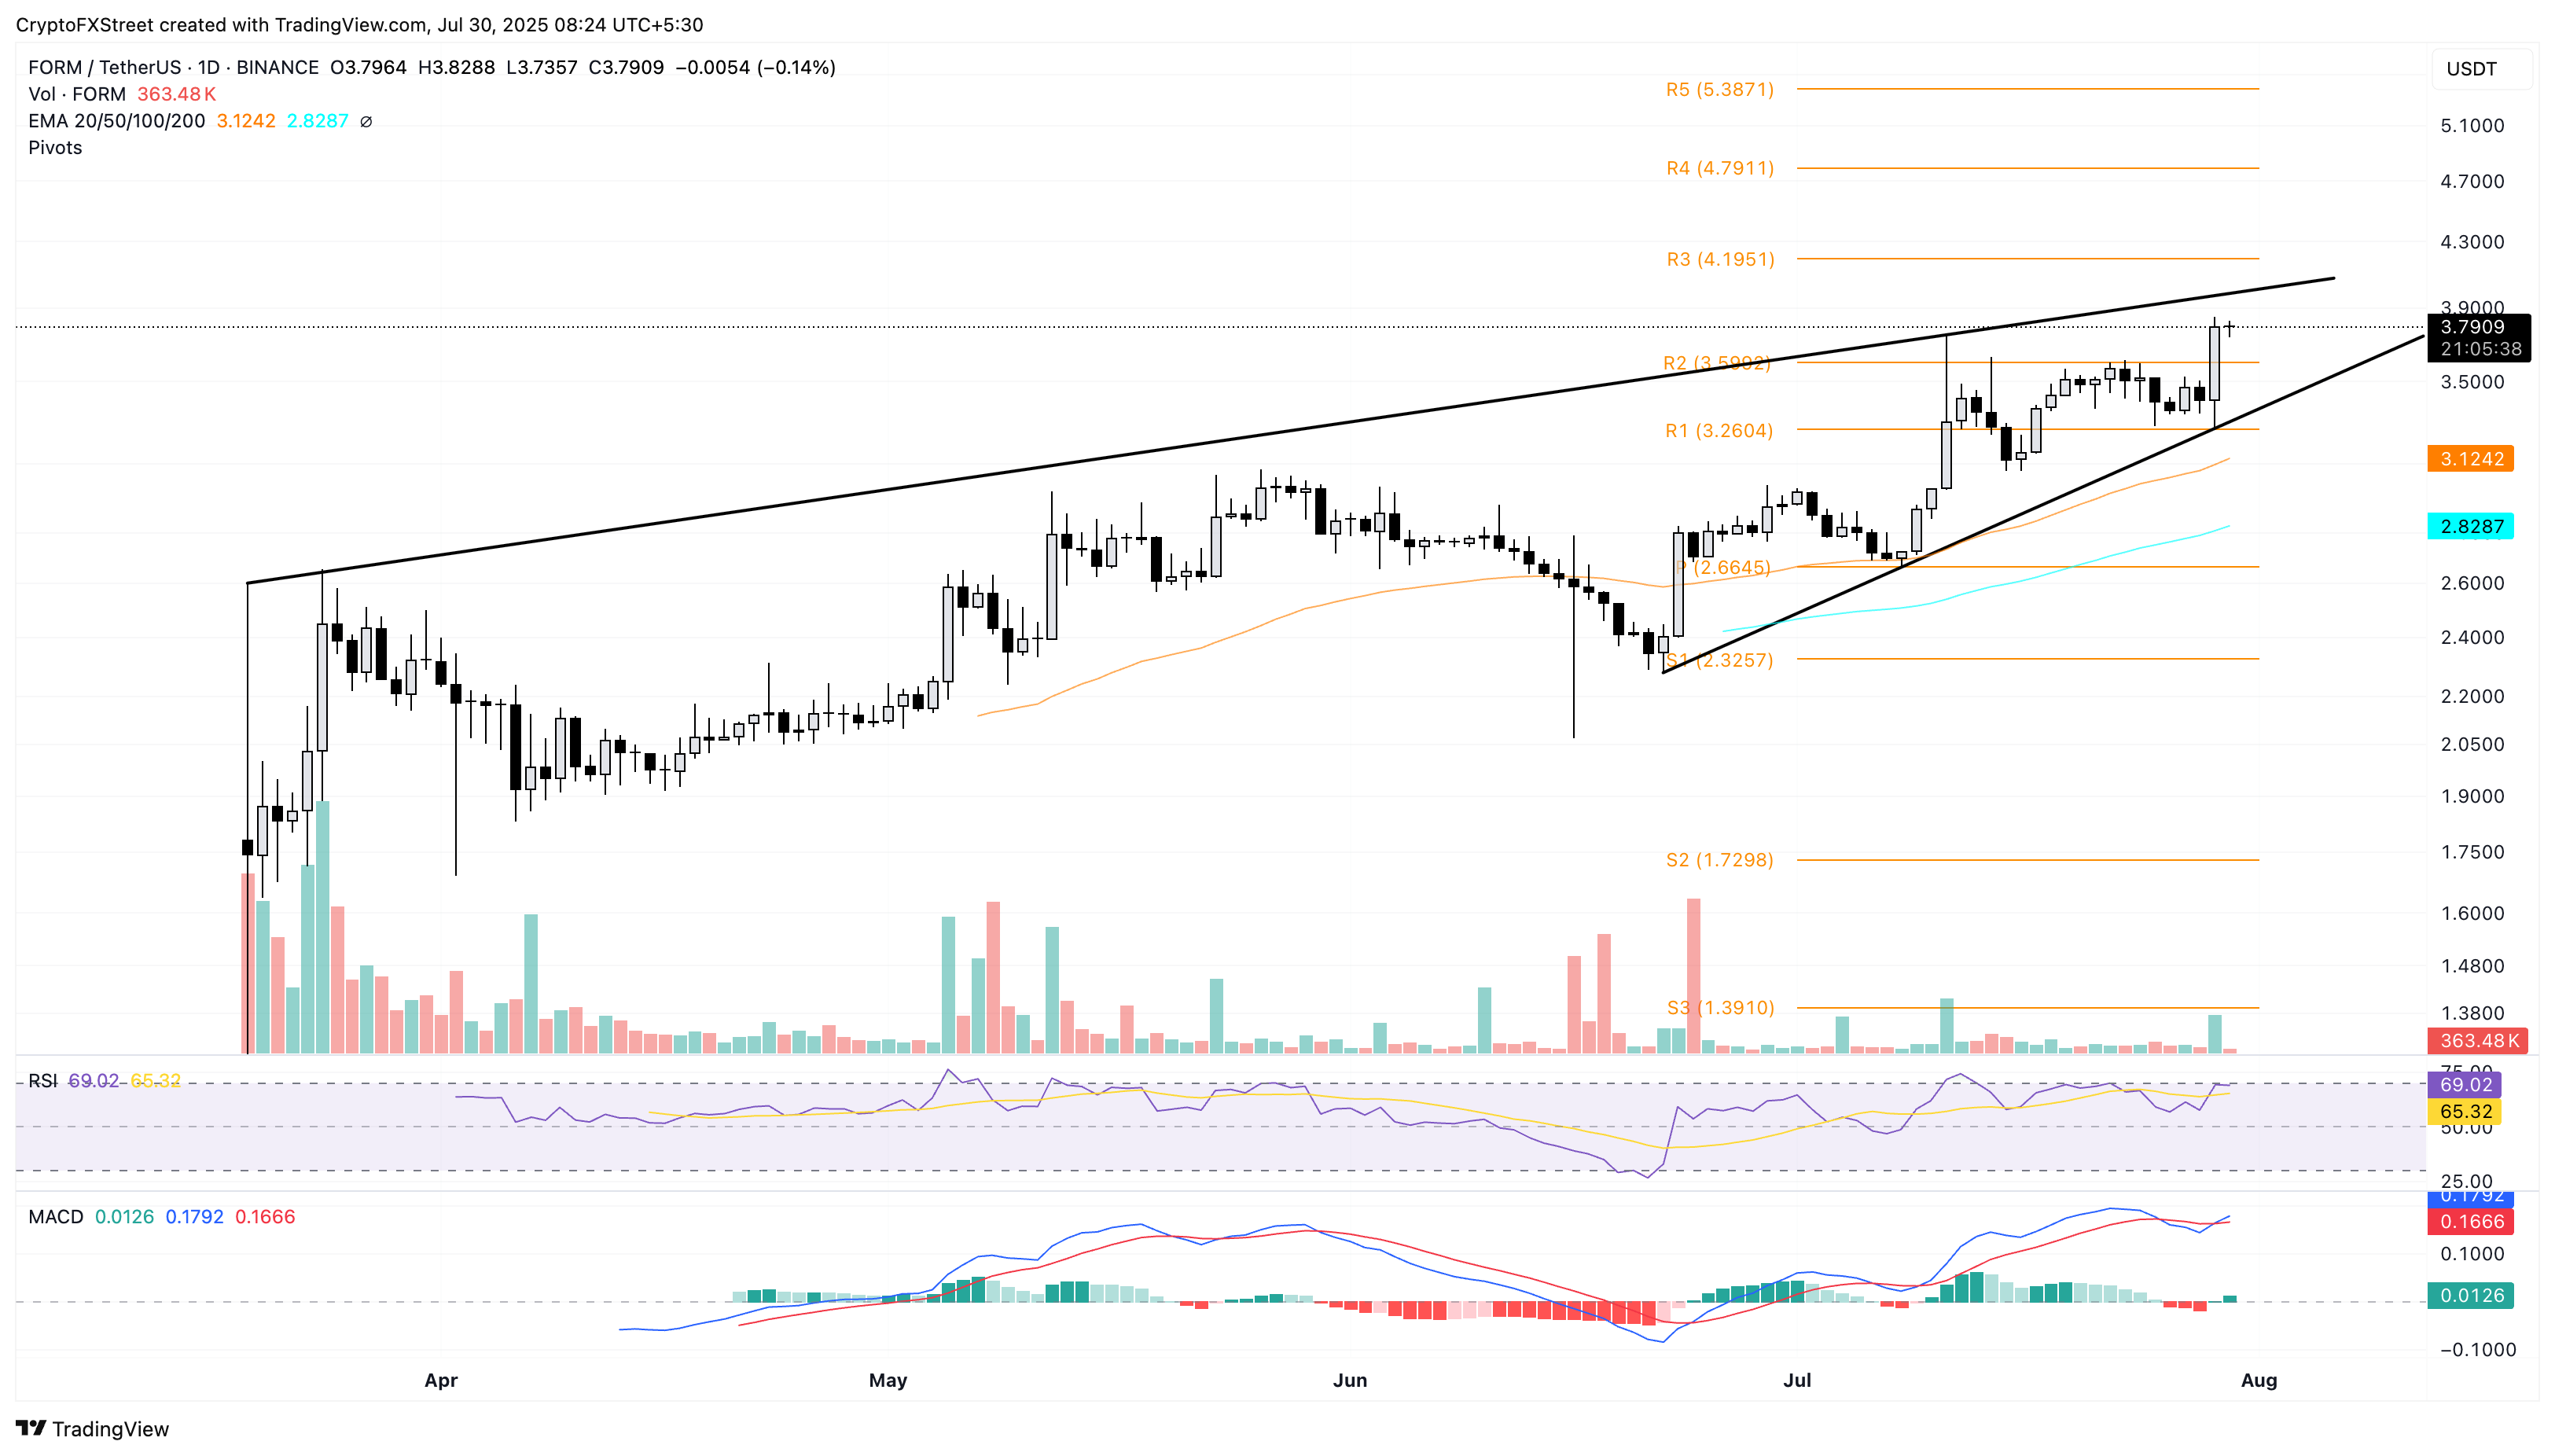
FORM/USDT daily price chart.
On the flip side, a reversal in FORM within the wedge pattern could retest the R2 pivot level at $3.59.

Log in to Reply
Log in to comment your thoughtsComments
Related Articles
|Square
Get the BTCC app to start your crypto journey
Get started today Scan to join our 100M+ users