Bitcoin Cash Soars to $600: BCH Smashes 2025 Highs in Defiant Rally

Bitcoin Cash just punched through a psychological barrier—flipping bears the bird as it clocks $600 for the first time this year. The 'forked one' isn’t asking permission.
Why this rally stings Wall Street:
While traditional finance still debates 'store of value' narratives, BCH bulldozes ahead with utility-first adoption. No bankers required—just nodes and nerve.
The cynical take:
Some hedge fund manager is definitely blaming this on 'speculative retail froth' while secretly FOMO-buying through a Cayman Islands shell company. Classic.
One thing’s clear: The market’s voting with its wallet. Again.
BCH derivatives and on-chain data show bullish bias
CoinGlass’ data shows that the futures’ Open Interest in Bitcoin Cash at exchanges rose from $432.04 million on Thursday to $655.31 million on Monday, levels not seen since April 10, 2024. Rising OI represents new or additional money entering the market and new buying, which could fuel the current BCH price rally.
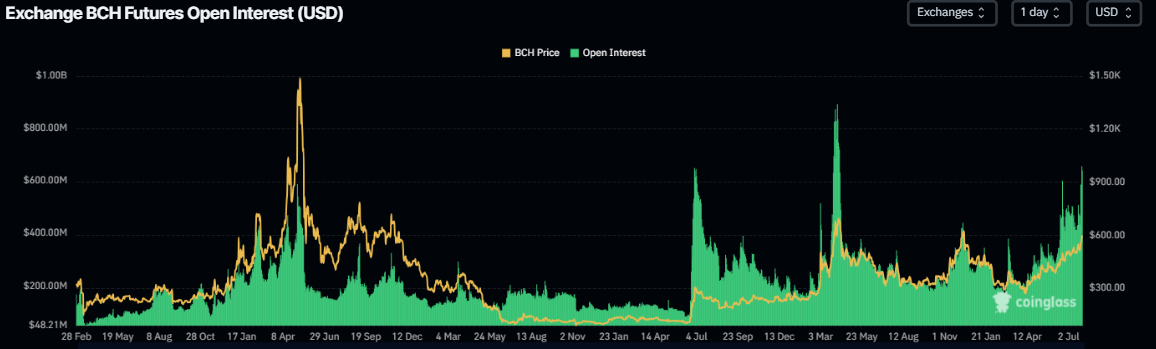
BCH open interest chart. Source: Coinglass
Additionally, CryptoQuant data, as illustrated in The Graph below, indicates an increase in buying pressure on BCH. The Taker CVD (Cumulative Volume Delta) for BCH has been positive and has increased since early May. This indicator measures the cumulative difference between market buy and sell volumes over a three-month period. When a 90-day CVD is positive and increasing, it suggests the Taker Buy Dominant Phase, while a negative and decreasing value indicates the Taker Sell Dominant Phase.
%20(1)-1753686977942.png)
BCH Spot Taker CVD chart. Source: CryptoQuant
BCH Price Prediction: BCH hits yearly high above $600
Bitcoin Cash price broke above the daily resistance level of $542.50 on Friday and rallied, closing above the upper resistance trendline of a rising channel on Sunday, hitting a new yearly high of $608.20. At the time of writing on Monday, BCH consolidates recent gains and trades at around $590.30.
If BCH continues its upward trend, it could extend the rally toward its December 6 high of $640. A successful close above this level could extend additional gains toward the April 5, 2024, high at $719.50.
The Relative Strength Index (RSI) indicator on the daily chart reads 71, indicating strong bullish momentum in overbought conditions. The Moving Average Convergence Divergence (MACD) on the daily chart showed a bullish crossover on Friday, signaling a buy opportunity and suggesting an upward trend ahead.
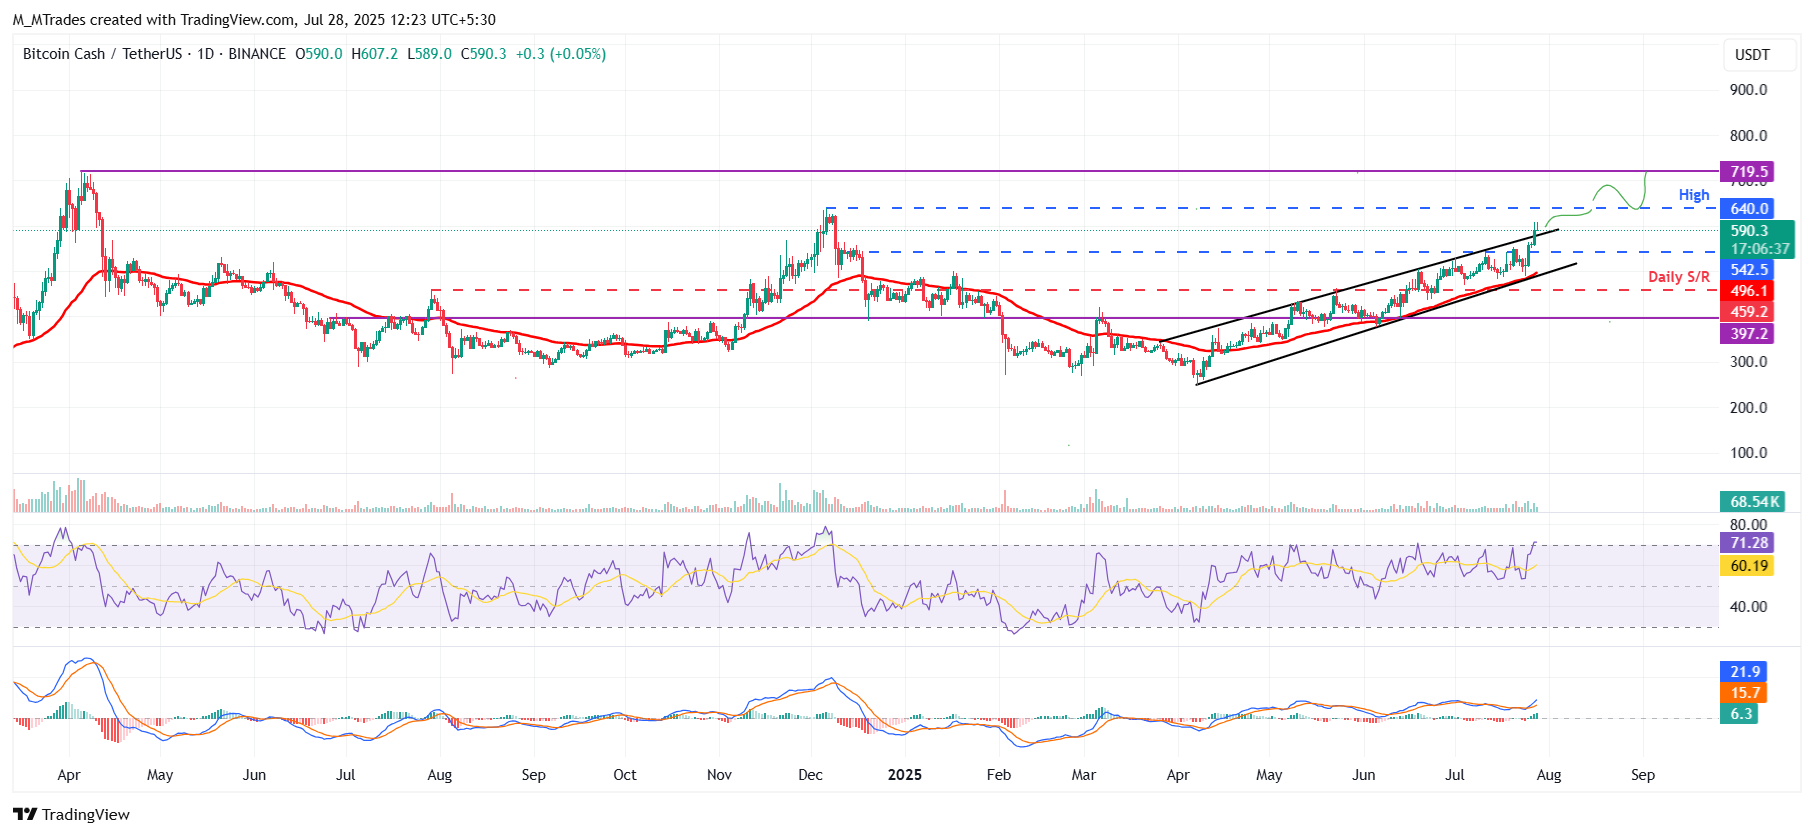
BCH/USDT daily chart
On the contrary, if BCH faces a correction, it could extend the decline to retest its daily support at $542.50.
