PEPE Primed for 20% Surge as Open Interest Shatters Records – Meme Coin Mania Returns?

Frogs are flying again. PEPE's derivatives market just hit an all-time high in Open Interest—and the charts are flashing a textbook breakout signal.
The liquidity dam is breaking
Traders are piling into PEPE futures like Wall Street into a tax loophole. With record capital parked in contracts, the meme coin's 20% upside target now looks conservative. No fundamentals? No problem—this is crypto, baby.
Leverage begets volatility
When Open Interest spikes this hard, it's either fuel for a moonshot or kindling for a liquidation cascade. PEPE's price action suggests the crowd's betting on the former. Just don't act surprised when some VC dumps their bags after the 18% pump.
Frogs or lambs? The market's about to decide.
Pepe’s Open Interest hits record highs
Futures’ OI in Pepe at exchanges rose from $748.38 million on June 17 to $1.02 billion on Wednesday, a new all-time high, according to data from CoinGlass. Rising OI represents new or additional money entering the market and new buying, which could fuel the current Pepe Price rally.
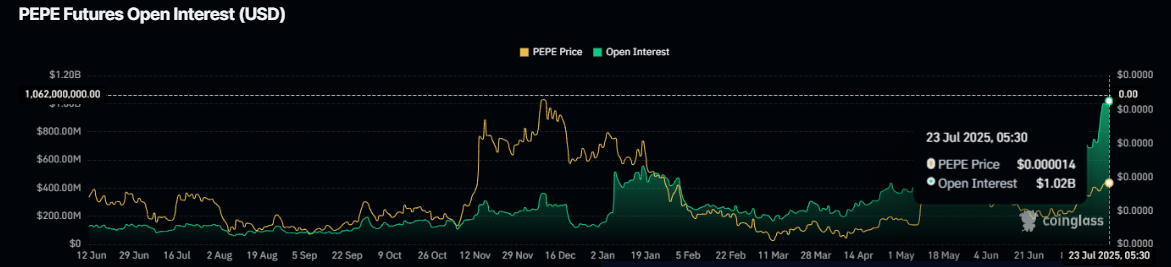
Pepe Futures Open Interest chart. Source: CoinGlass
Santiment’s Supply Distribution data supports a bullish outlook for Pepe, as the number of large-wallet holders (whales) is increasing.
The metric indicates that whales holding between 100,000 and 1 million (red line), 1 million and 10 million (yellow line), and 10 million and 100 million (blue line) PEPE tokens have been consistently accumulating since early July, with a net buying activity of 42.16 billion tokens, bolstering Pepe’s bullish outlook.
%20%5B11-1753256303379.00.37,%2023%20Jul,%202025%5D.png)
Pepe Supply distribution chart. Source: Sentiment
PEPE Price Forecast: Bulls aiming for gains over 20%
Pepe on the weekly chart has retested its weekly support level at $0.000011 and rallied nearly 14% last week. As of this week, it hovers at around $0.000013 at the time of writing on Wednesday.
If PEPE continues its upward trend, it could extend the rally toward its 50% Fibonacci level at $0.000016, drawn from the all-time high reached n December at $0.000028 to the March low of $0.000005.
The Relative Strength Index (RSI) on the weekly chart reads 57, surpassing its neutral level of 50, which indicates bullish momentum is gaining traction. The Moving Average Convergence Divergence (MACD) indicator on the weekly chart showed a bullish crossover in early May, which remains in effect. The rising green histogram bars above its neutral zero line suggest that bullish momentum is gaining traction.
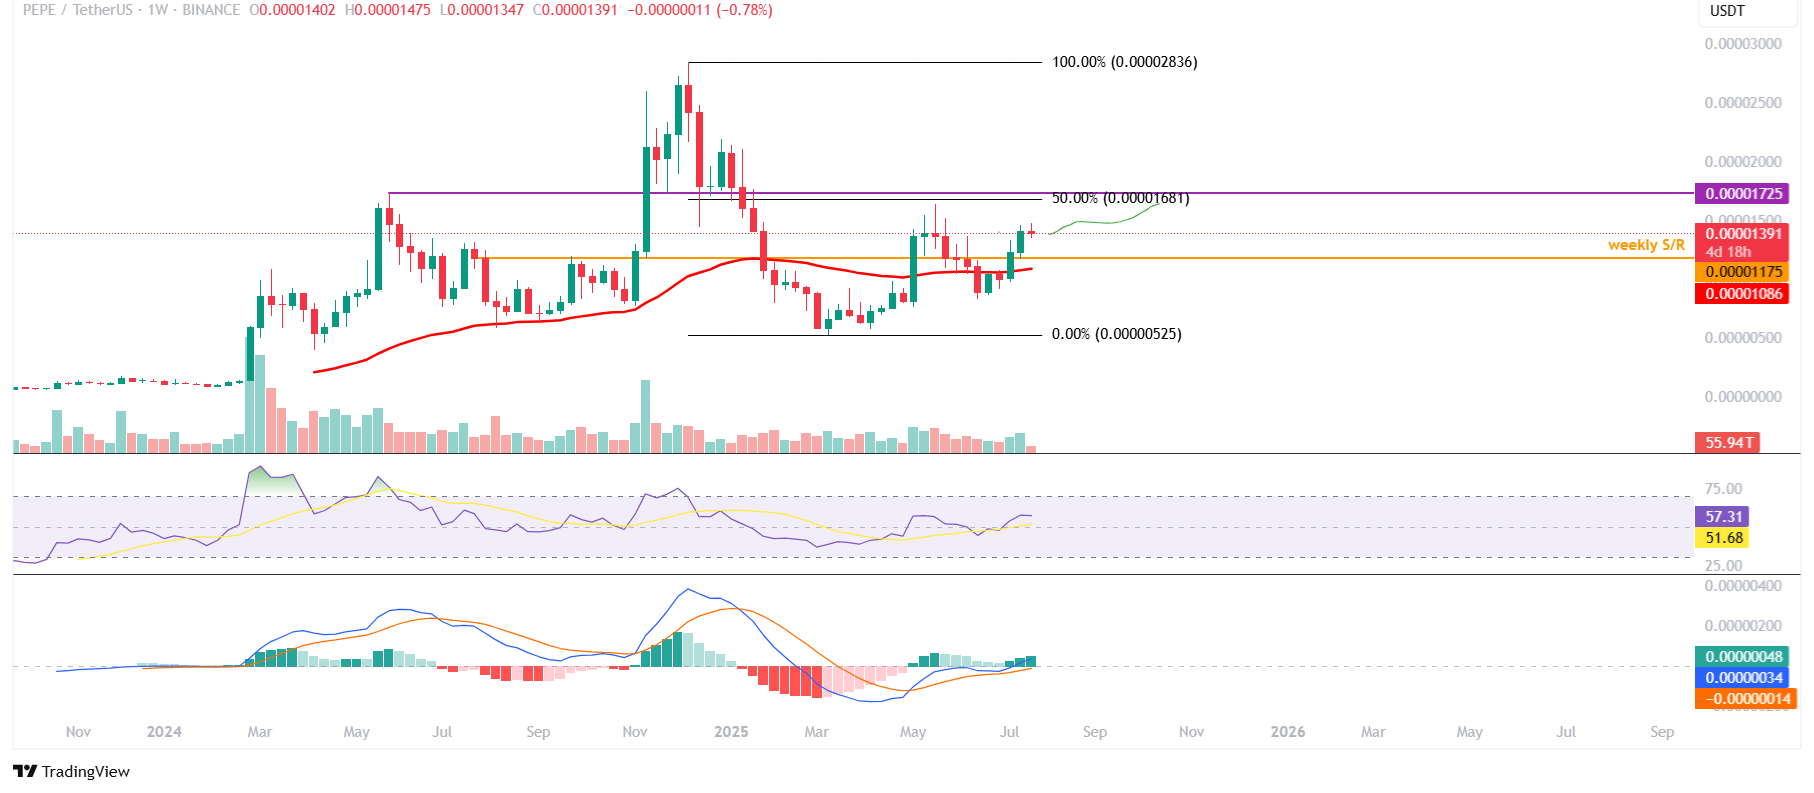
PEPE/USDT weekly chart
On the daily chart, PEPE price rebounded after retesting its previously broken descending trendline on Saturday, closing above the daily resistance at $0.000013 the next day. PEPE has been stabilizing around this level since then, and at the time of writing on Wednesday, hovers around the same daily level of $0.000013.
If the daily support at $0.000013 holds, it could extend the rally by 22% from this level toward its next daily resistance at $0.000016, which coincides with the weekly target mentioned above.
The RSI on the daily chart reads 68, which is slightly below its overbought level of 70, suggesting that the bulls still maintain control of the momentum. The MACD indicator on the same chart displayed a bullish crossover at the end of June, which still holds. However, the intensity of green histogram bars above its neutral zero line is decreasing, suggesting fading bullish momentum.
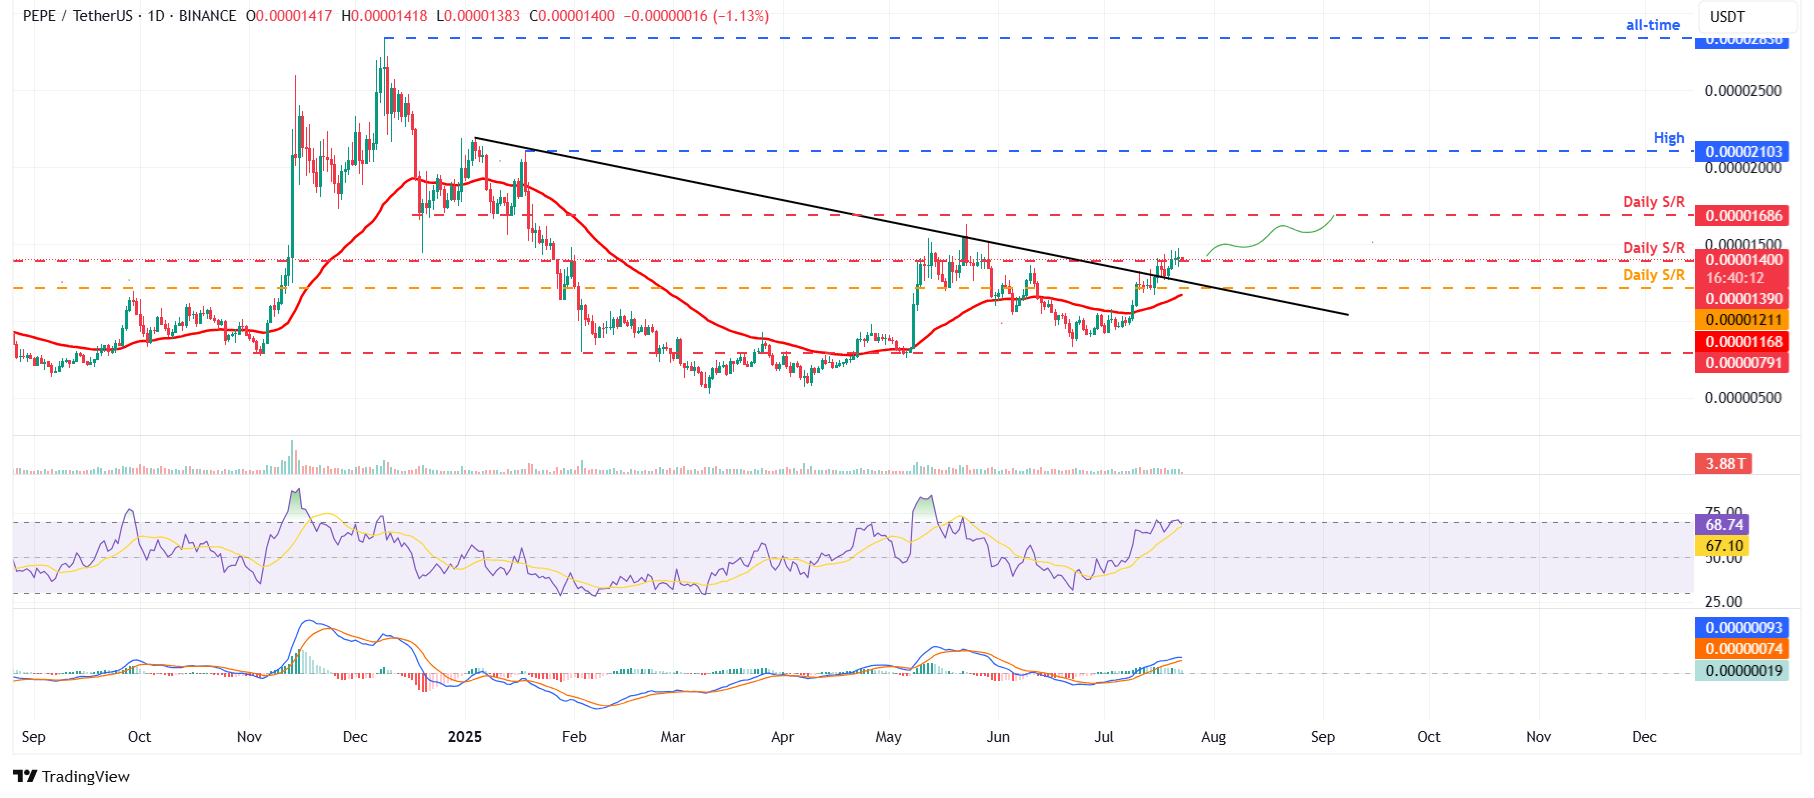
PEPE/USDT daily chart
If PEPE faces a pullback and closes below the daily support at $0.000013, it could extend the decline toward its next support at $0.000012.
