Solana Price Prediction: SOL Bulls Charge as Open Interest Hits Record High

Solana's bulls are flexing—Open Interest just smashed its all-time high. Is this the rocket fuel for SOL's next leg up?
Market mechanics tilt bullish
Derivatives traders are piling into SOL contracts like Wall Street bankers at a taxpayer-funded buffet. The surge in Open Interest signals conviction—but also raises the stakes for a potential liquidation cascade.
Technical setup mirrors 2021 breakout
Chart patterns echo Solana's historic run, though this time with fewer network outages. Progress? Maybe. Or just better PR spin.
Watch these key levels
A clean hold above $150 could trigger FOMO buying. Below $130? Cue the 'macro headwinds' excuses from overleveraged degens.
Remember: In crypto, ATHs are either launchpads or trapdoors. Today's genius is tomorrow's bagholder.
Solana’s open interest hits a new all-time high of $9.71 billion
Coinglass’ data shows that the futures’ OI in SOL at exchanges rises to a new all-time high of $9.71 billion on Friday from $7.78 billion at the start of this week on Monday. An increasing OI represents new or additional money entering the market and new buying, which could fuel the current Solana price rally.
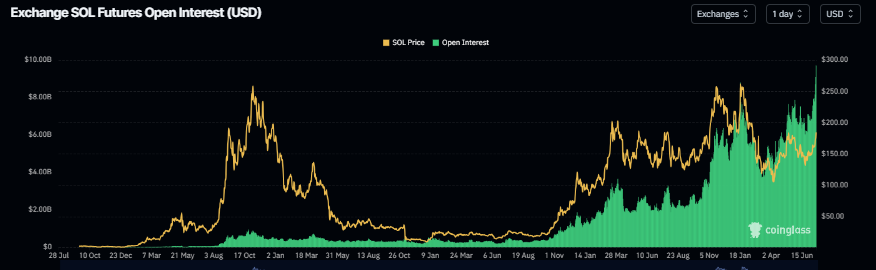
Solana Open Interest chart. Source: Coinglass
Additionally, data from crypto intelligence tracker DefiLlama shows that Solana’s Total Value Locked (TVL) has been constantly rising since the end of June and has reached $9.87 billion on Friday, levels not seen since early February. This increase in TVL indicates growing activity and interest within SOL’s ecosystem, suggesting that more users are depositing or utilizing assets within SOL-based protocols.
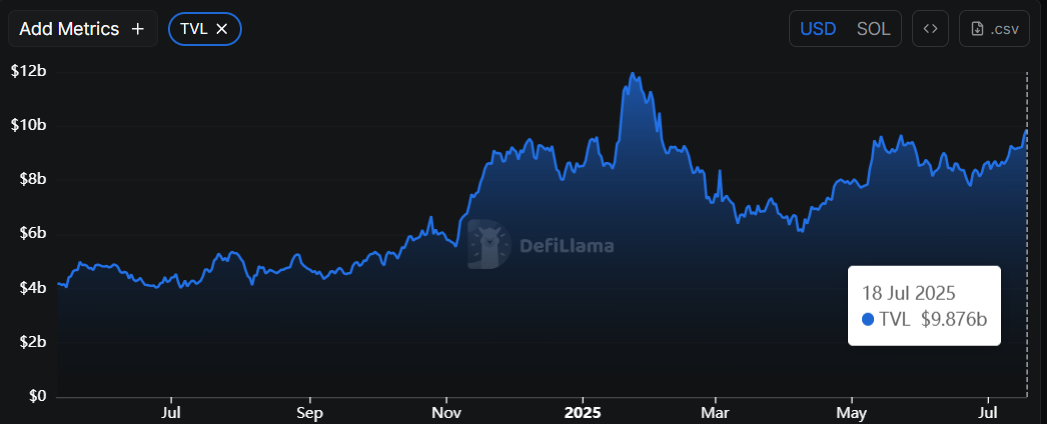
SOL TVL chart. Source: DefiLlama
Solana Price Forecast: SOL bulls eyeing levels above $200
Solana price broke above the daily resistance level of $160 on Sunday, rallying 9% until Thursday. At the time of writing on Friday, it continues to trade higher, approaching its next daily resistance at $184.13.
If SOL breaks and closes above this level, it could extend the rally toward the February 14 high of $205.34.
The Relative Strength Index (RSI) indicator reads 73 on the daily chart, flashing overbought conditions and indicating strong bullish momentum. Additionally, the Moving Average Convergence Divergence (MACD) bullish crossover remains in effect after issuing a buy signal at the end of June. It also shows rising green histogram bars above its neutral zero line, suggesting that bullish momentum is gaining traction.
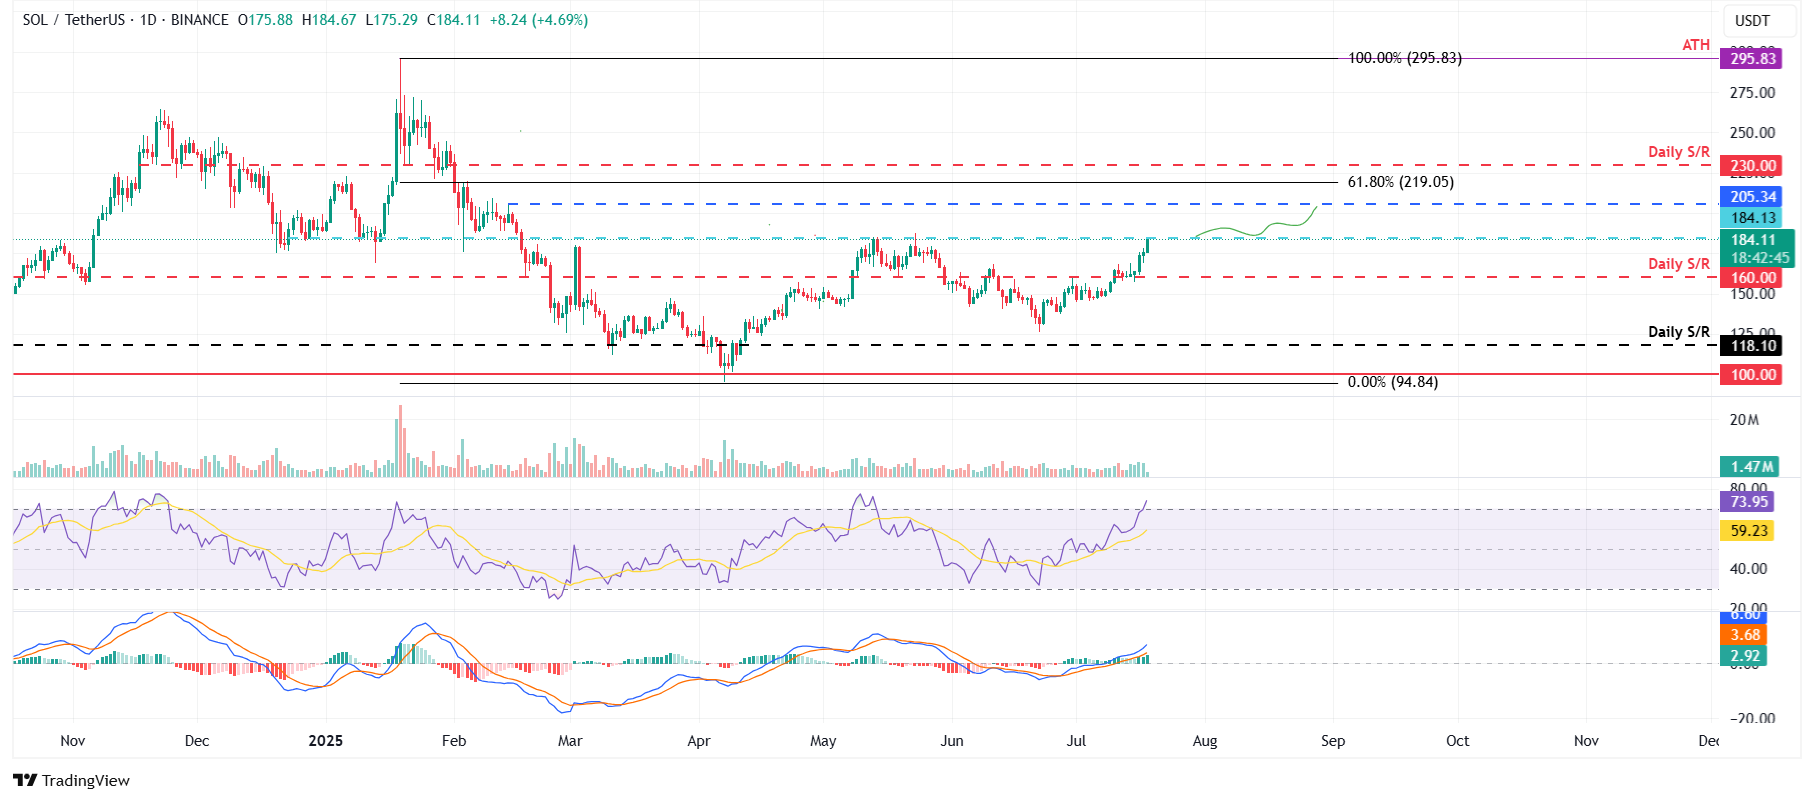
SOL/USDT daily chart
However, if SOL faces a correction, it could extend the decline to find support around its daily level at $160.
