Crypto Market Cap Nears Record High as Bitcoin’s Grip Slips—Altcoins Go Berserk

Digital assets surge toward uncharted territory while BTC dominance crumbles—proof that even crypto's old guard isn't immune to a little disruption.
The 'flippening' whispers start again
As Bitcoin's market share dips, ETH, SOL, and a parade of altcoins rush to fill the vacuum. Traders pivot faster than a DeFi exploit drains wallets.
Altseason isn't coming—it's here
Memecoins, layer-2 tokens, and that obscure project your Uber driver shilled last week are all mooning in unison. Meanwhile, Wall Street still can't decide if crypto is 'digital gold' or a 'speculative bubble'—classic hedge fund indecision.
The numbers don't lie: ATHs loom while BTC takes a backseat. Whether this is sustainable or just pre-halving euphoria remains to be seen—but for now, the bulls are running wild.
Bitcoin dominance takes a hit as Ethereum and other altcoins rise
Bitcoin dominance (BTC.D) refers to the percentage value of Bitcoin market capitalization compared to the total cryptocurrency market. During the 2018 and 2022 altcoin seasons, the capital rotation from Bitcoin to altcoins triggered a massive decline in BTC.D.
At the time of writing, BTC.D holds the lion's share, at 62.89%, down from 66% on June 27. A weekly close below the 63.15% support level marked by the May 11 close, BTC.D could extend the declining trend to the 50-week Exponential Moving Average (EMA) at 60.90%.
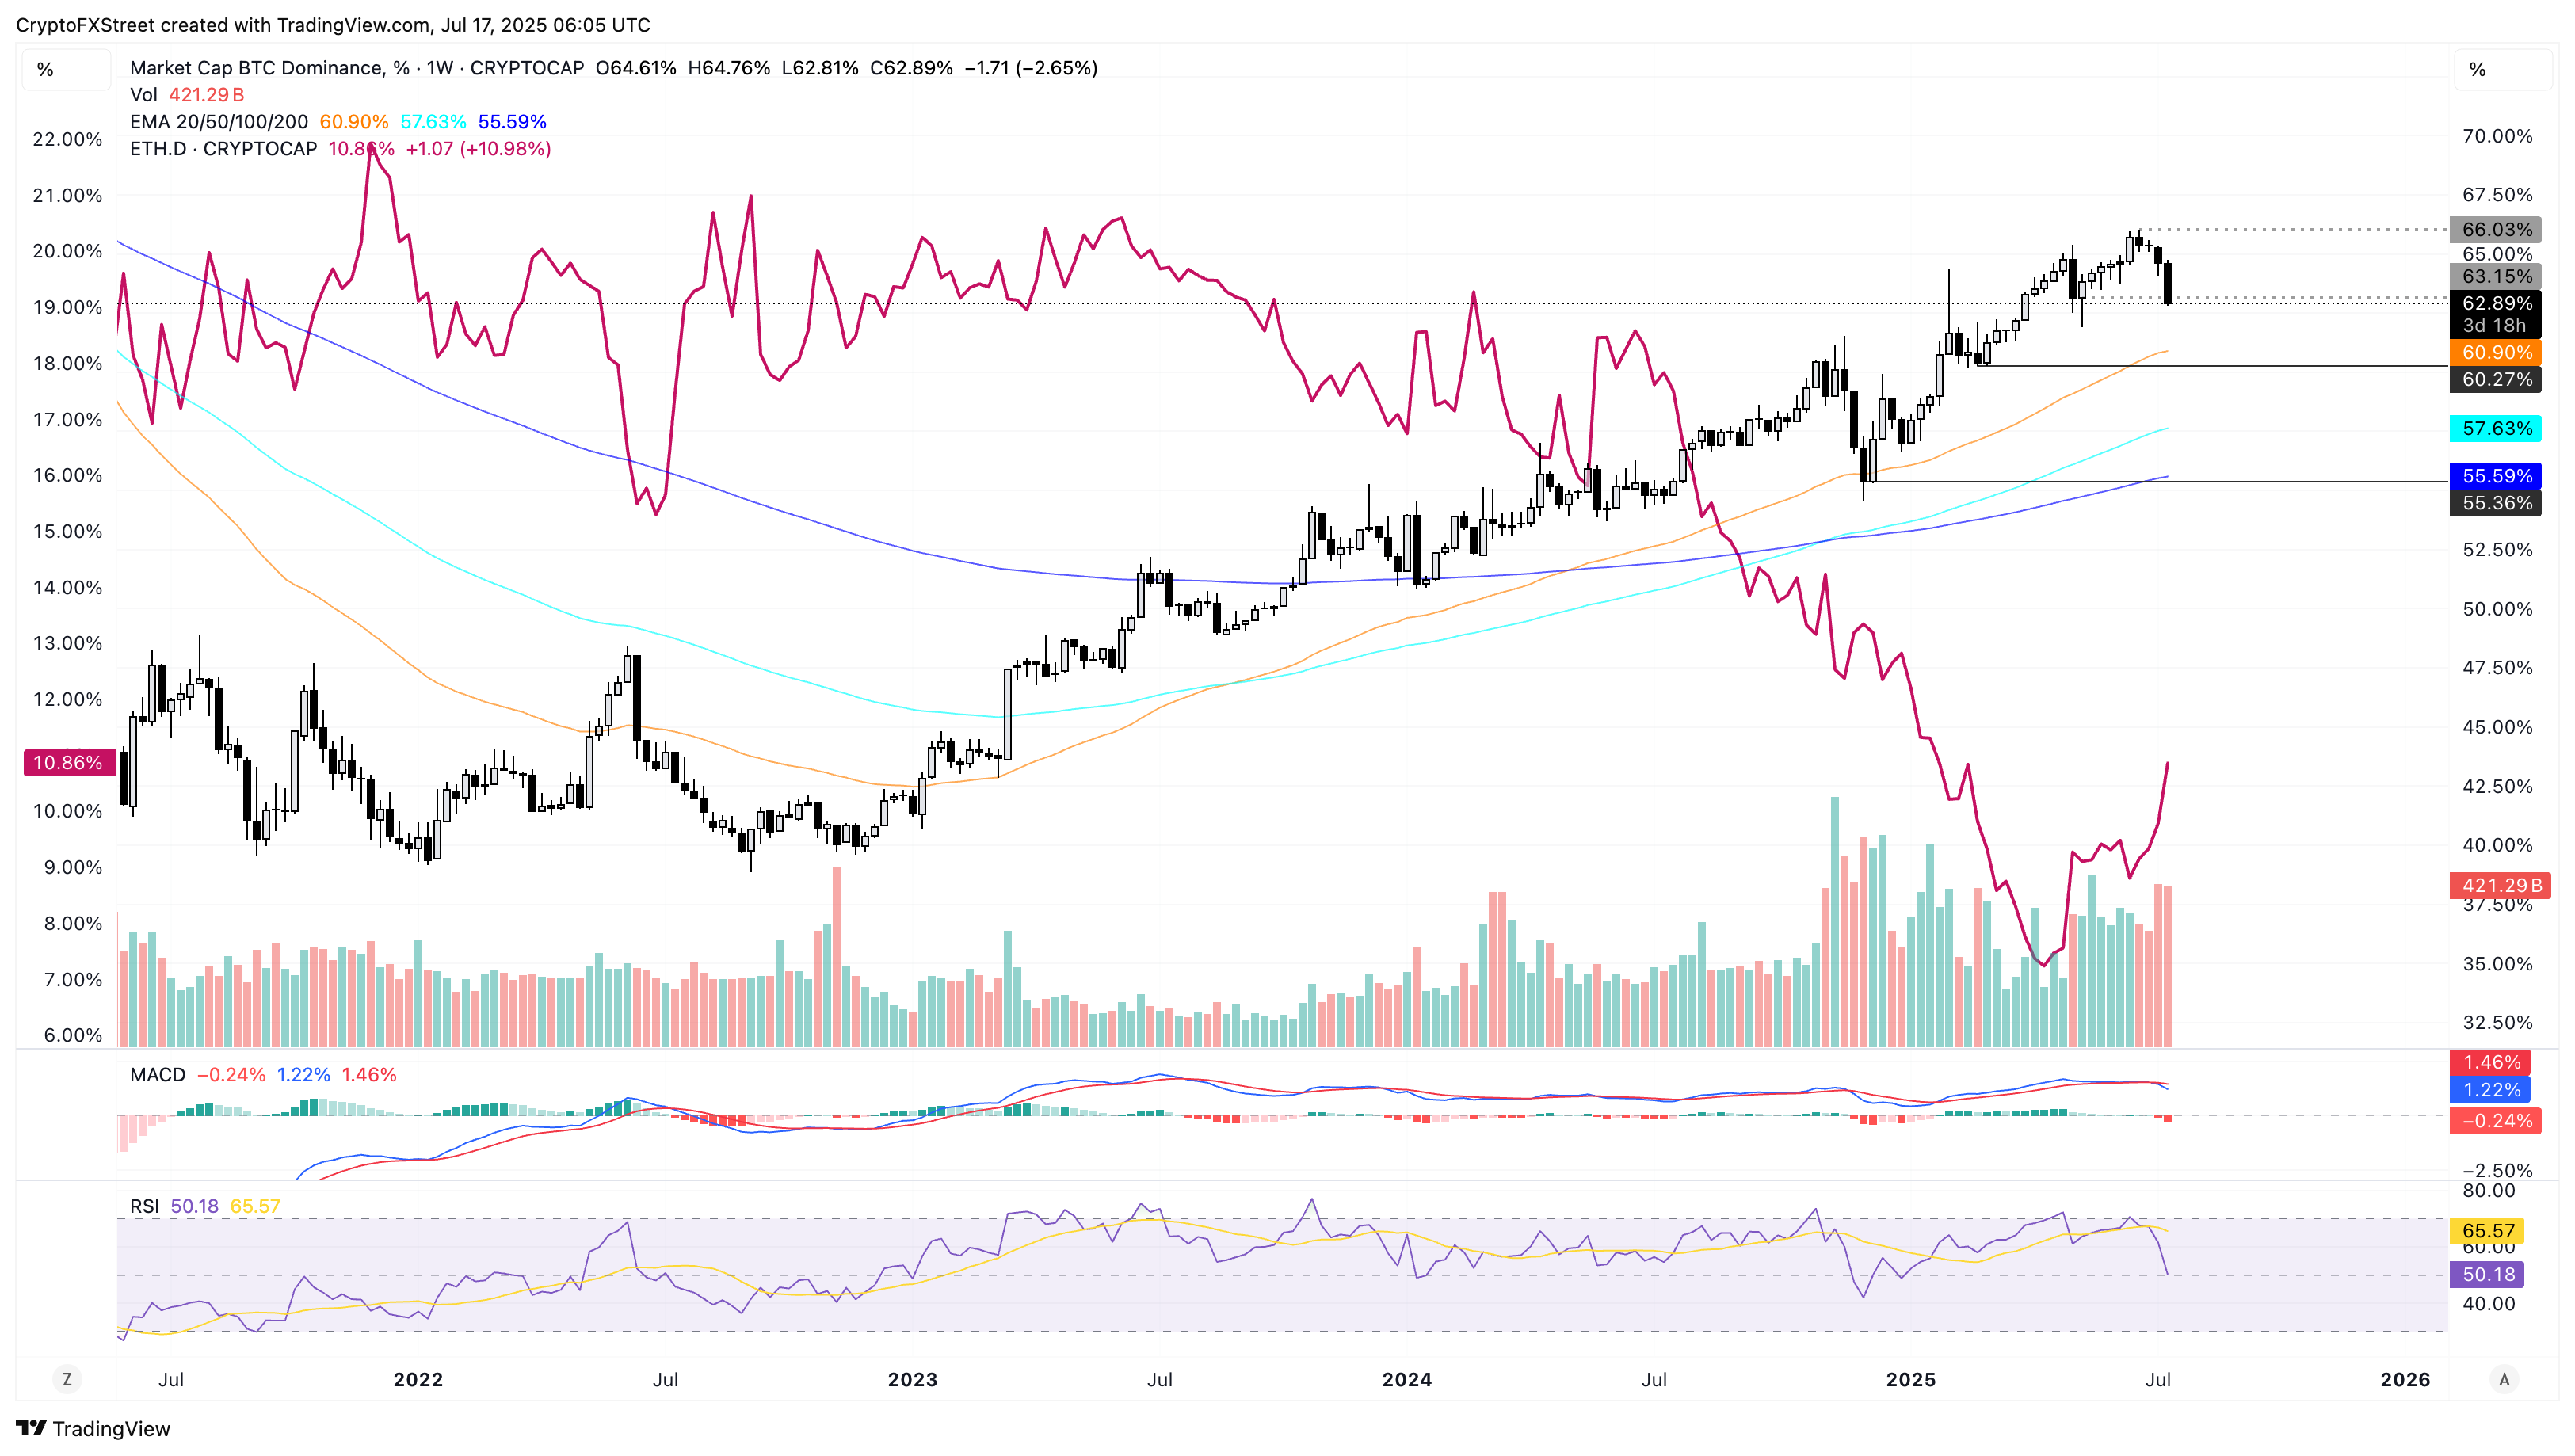
BTC Dominance weekly chart.
On the other hand, ethereum dominance (ETH.D) has surged to 11.02%, up from 9.04% on June 27, indicating an increase in ETH's strength relative to BTC. Adding credence to this, the ETH/BTC chart displays Ether appreciating 16% so far this week against Bitcoin.
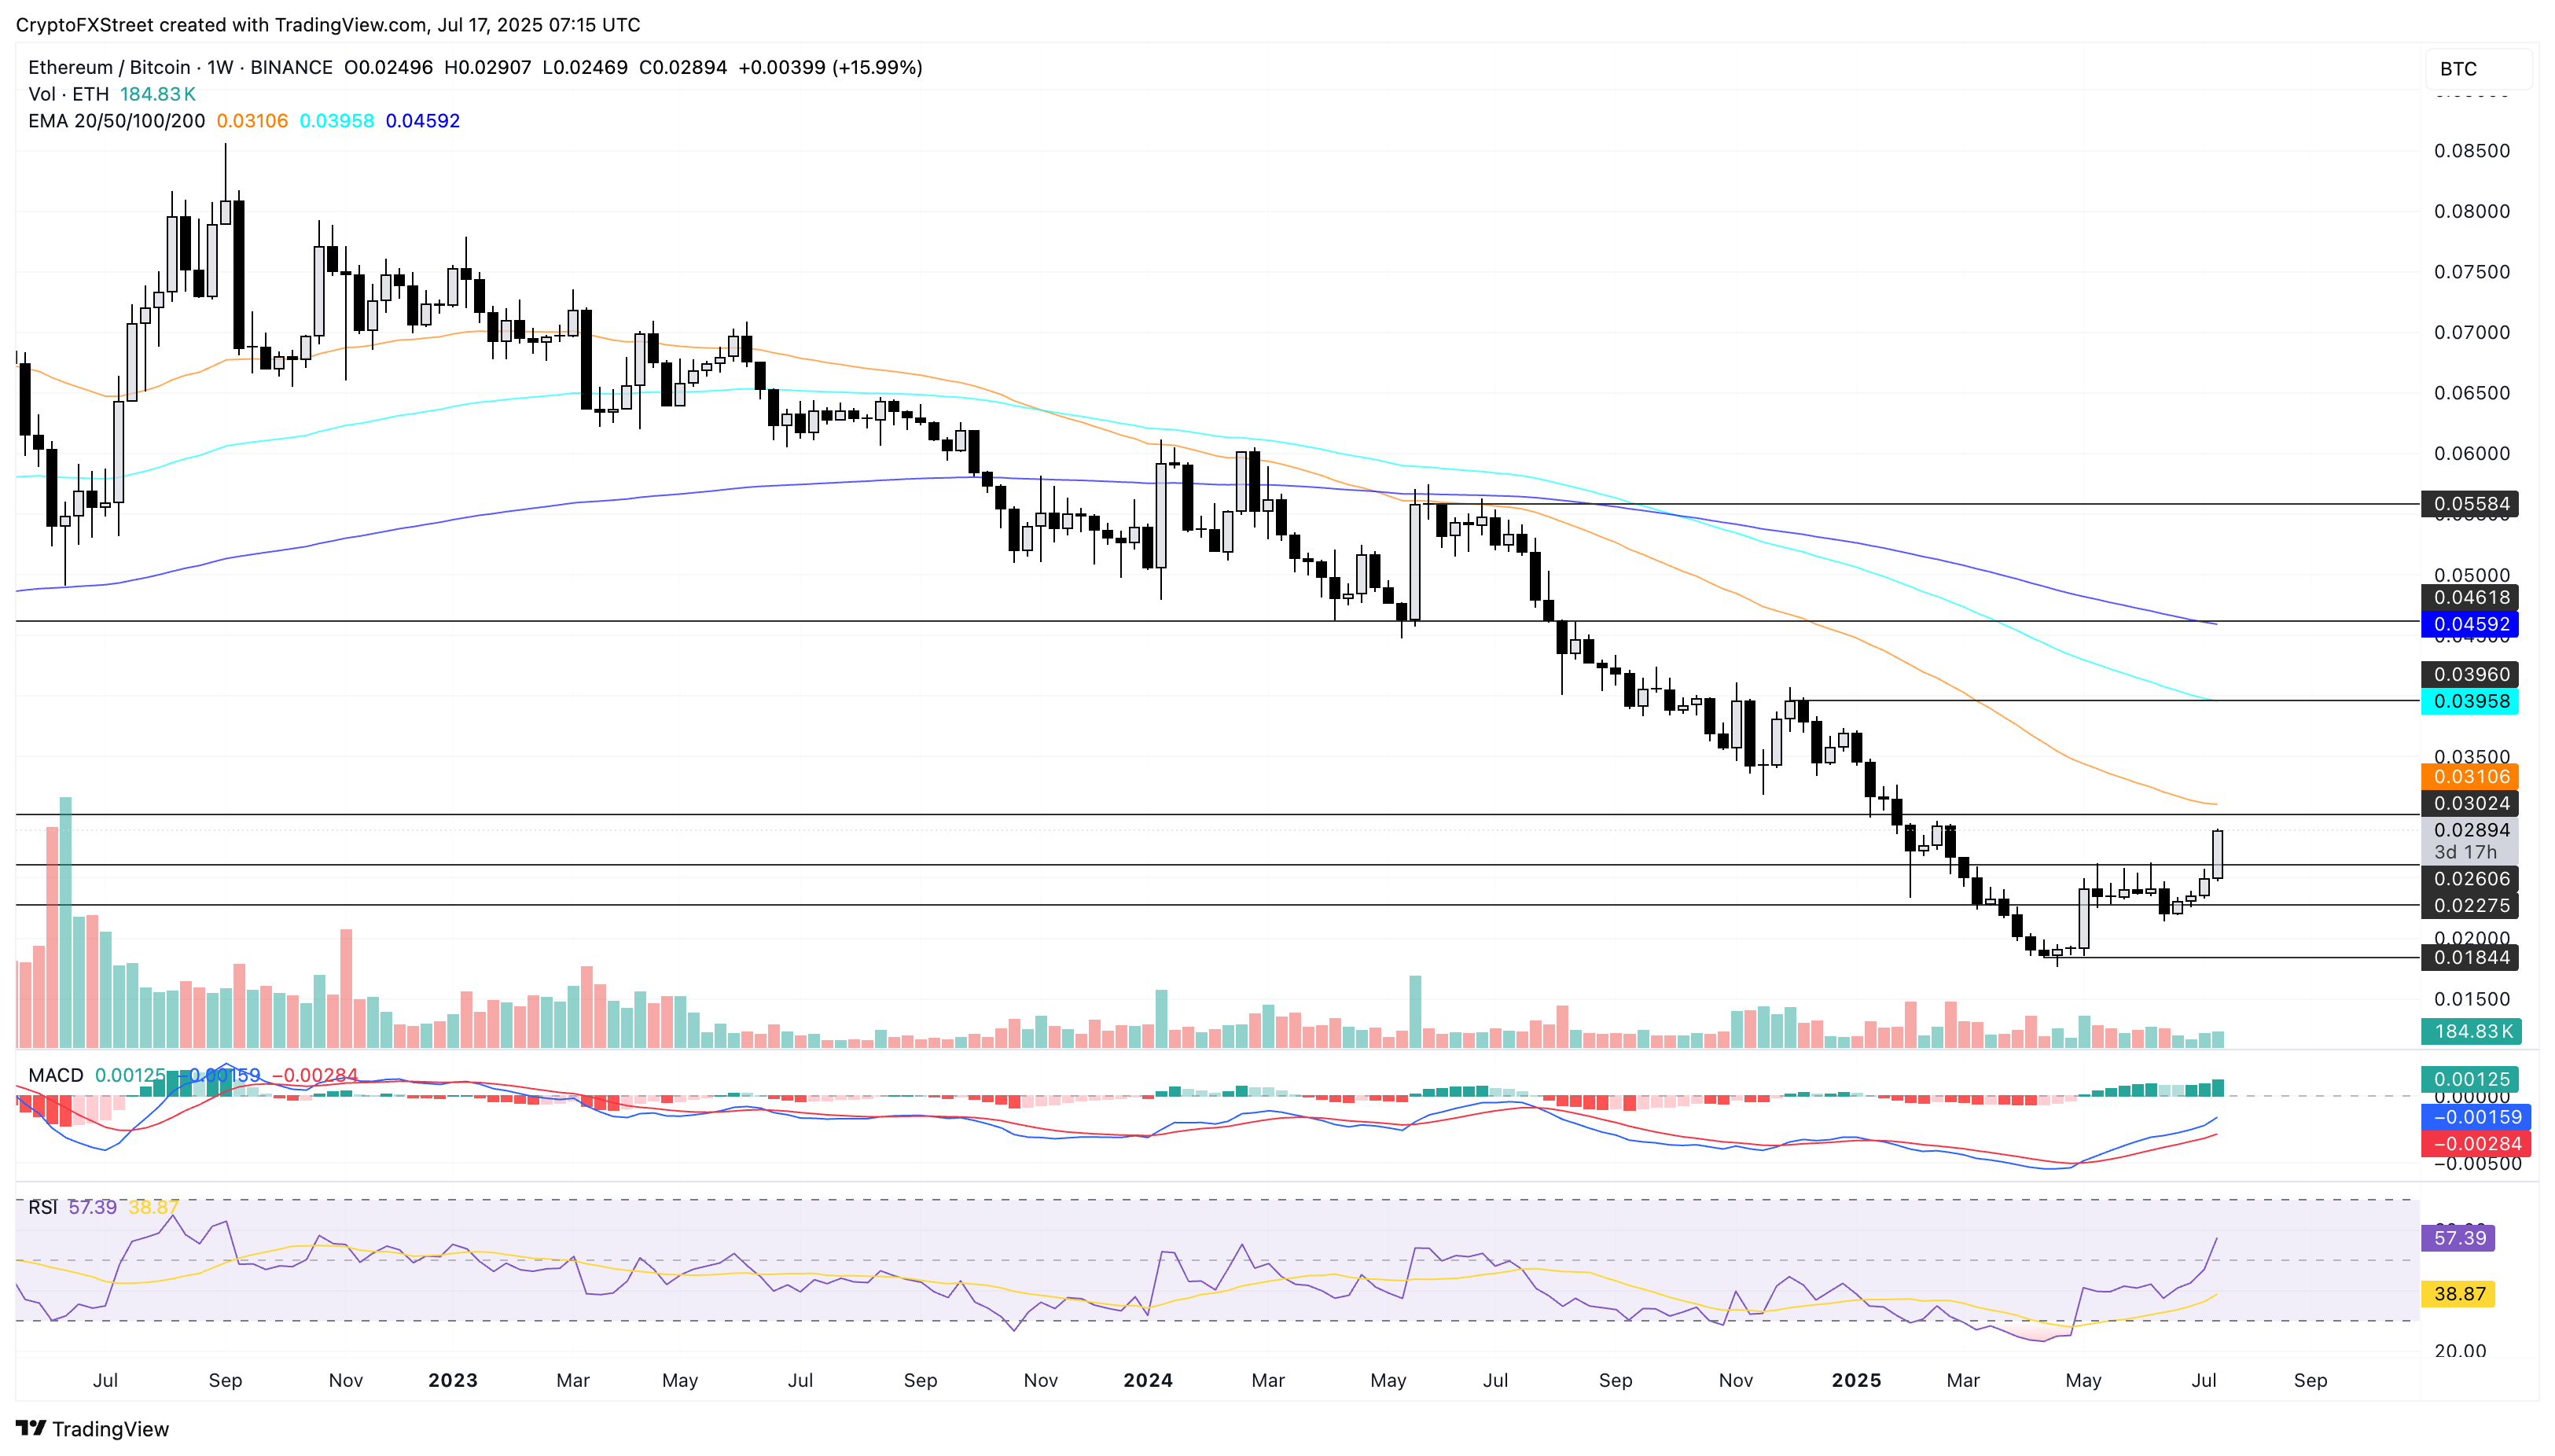
ETH/BTC weekly chart.
The loading altcoin season forms a bullish setup
The total market capitalization reached a new all-time high of $3.80 trillion on Monday, as market sentiment improved. The CMC Fear and Greed Index, a sentiment gauge, reads 70, indicating a risk-on sentiment in the market.
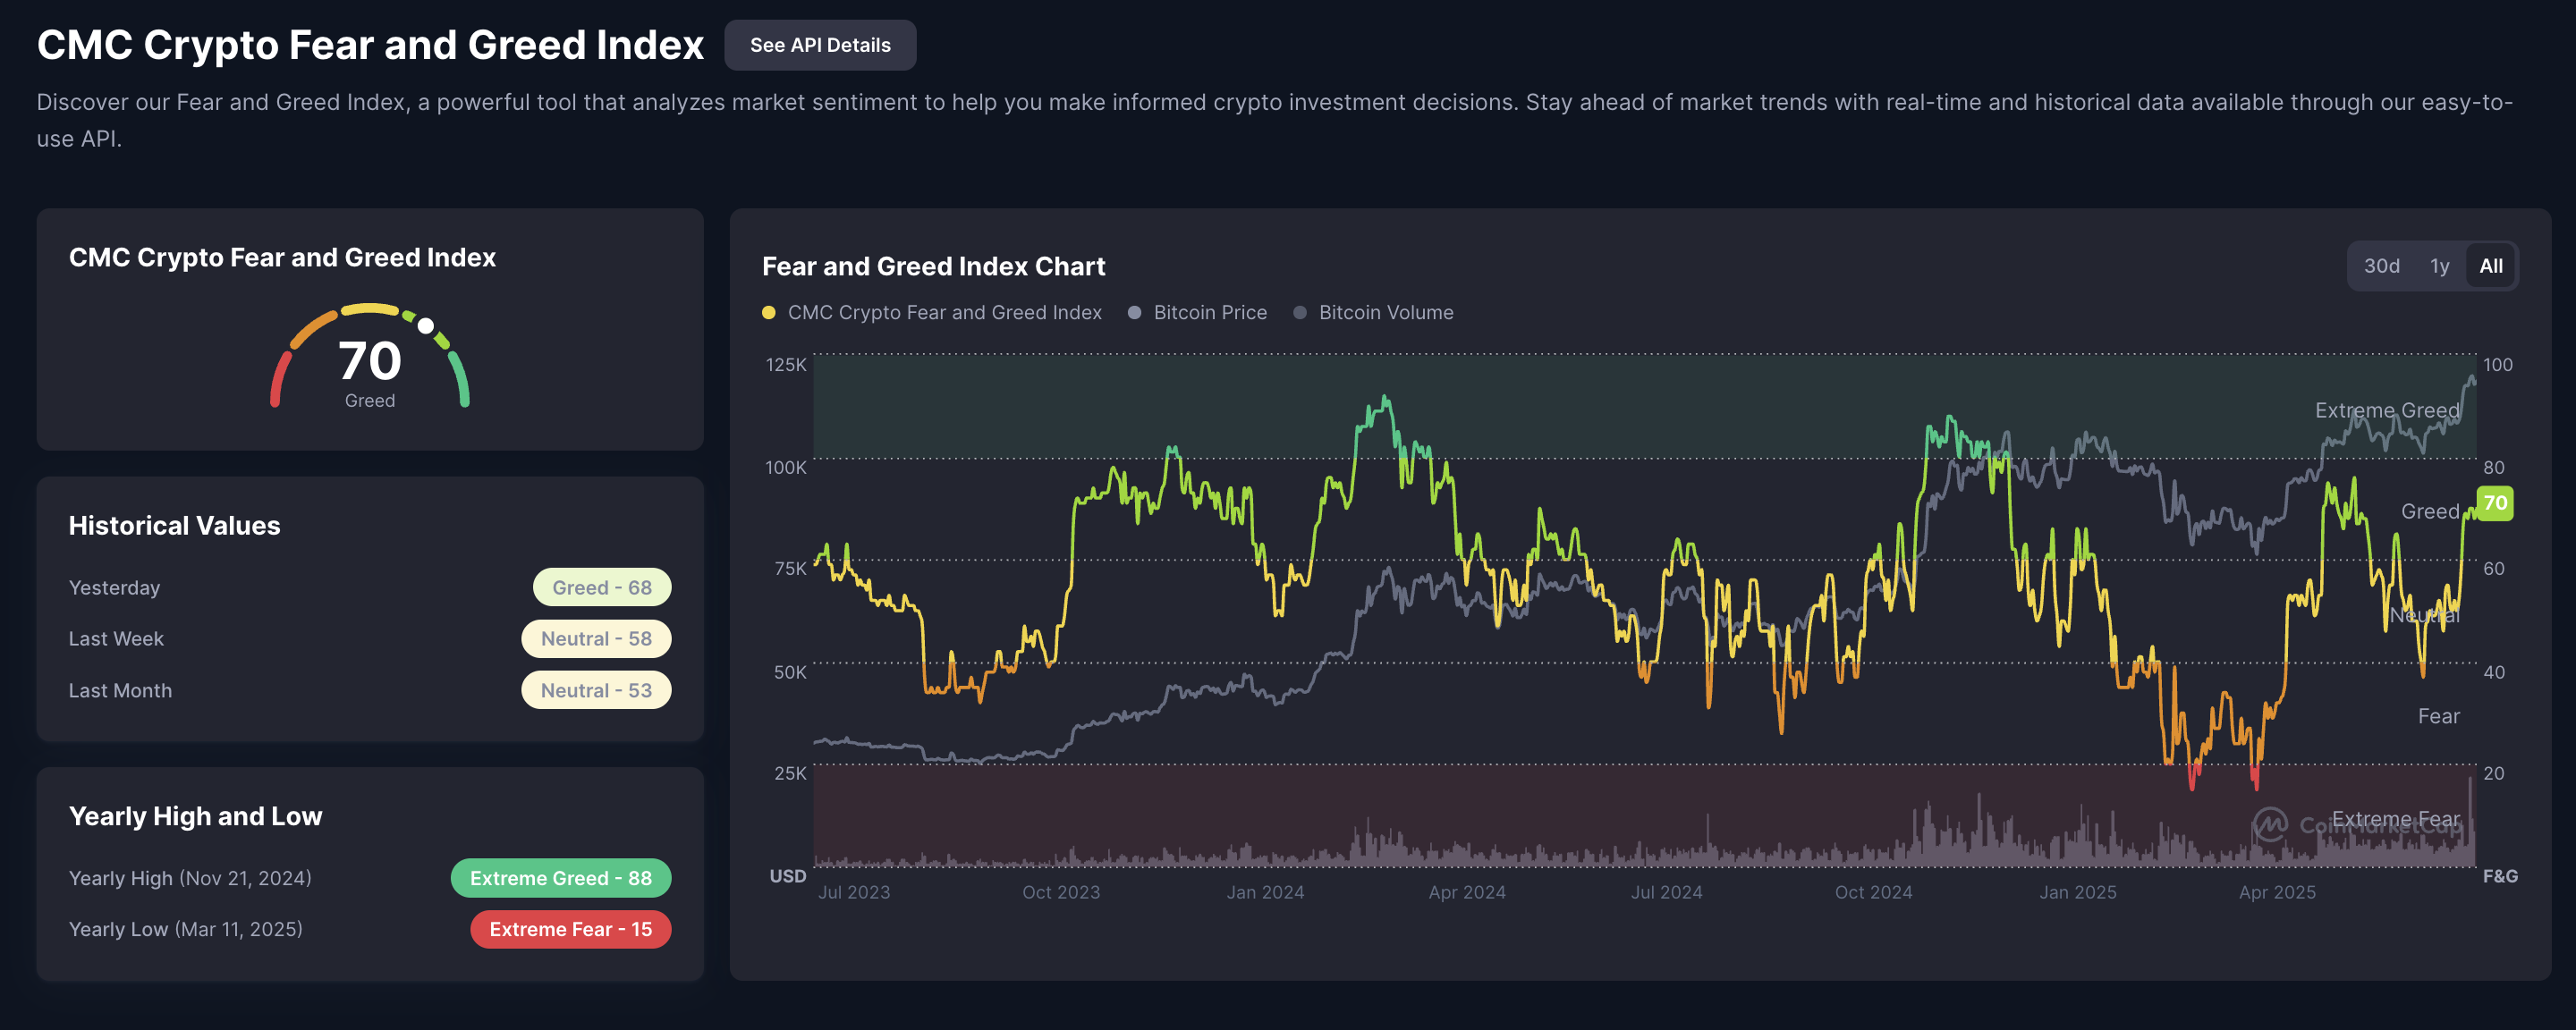
CoinMarketCap Fear and Greed Index.
Alongside this, the CMC Altcoin Season Index stands at 38, compared to 23 on July 1, indicating a shift in capital from Bitcoin to altcoins. Typically, a value above 75 highlights an altcoin season.
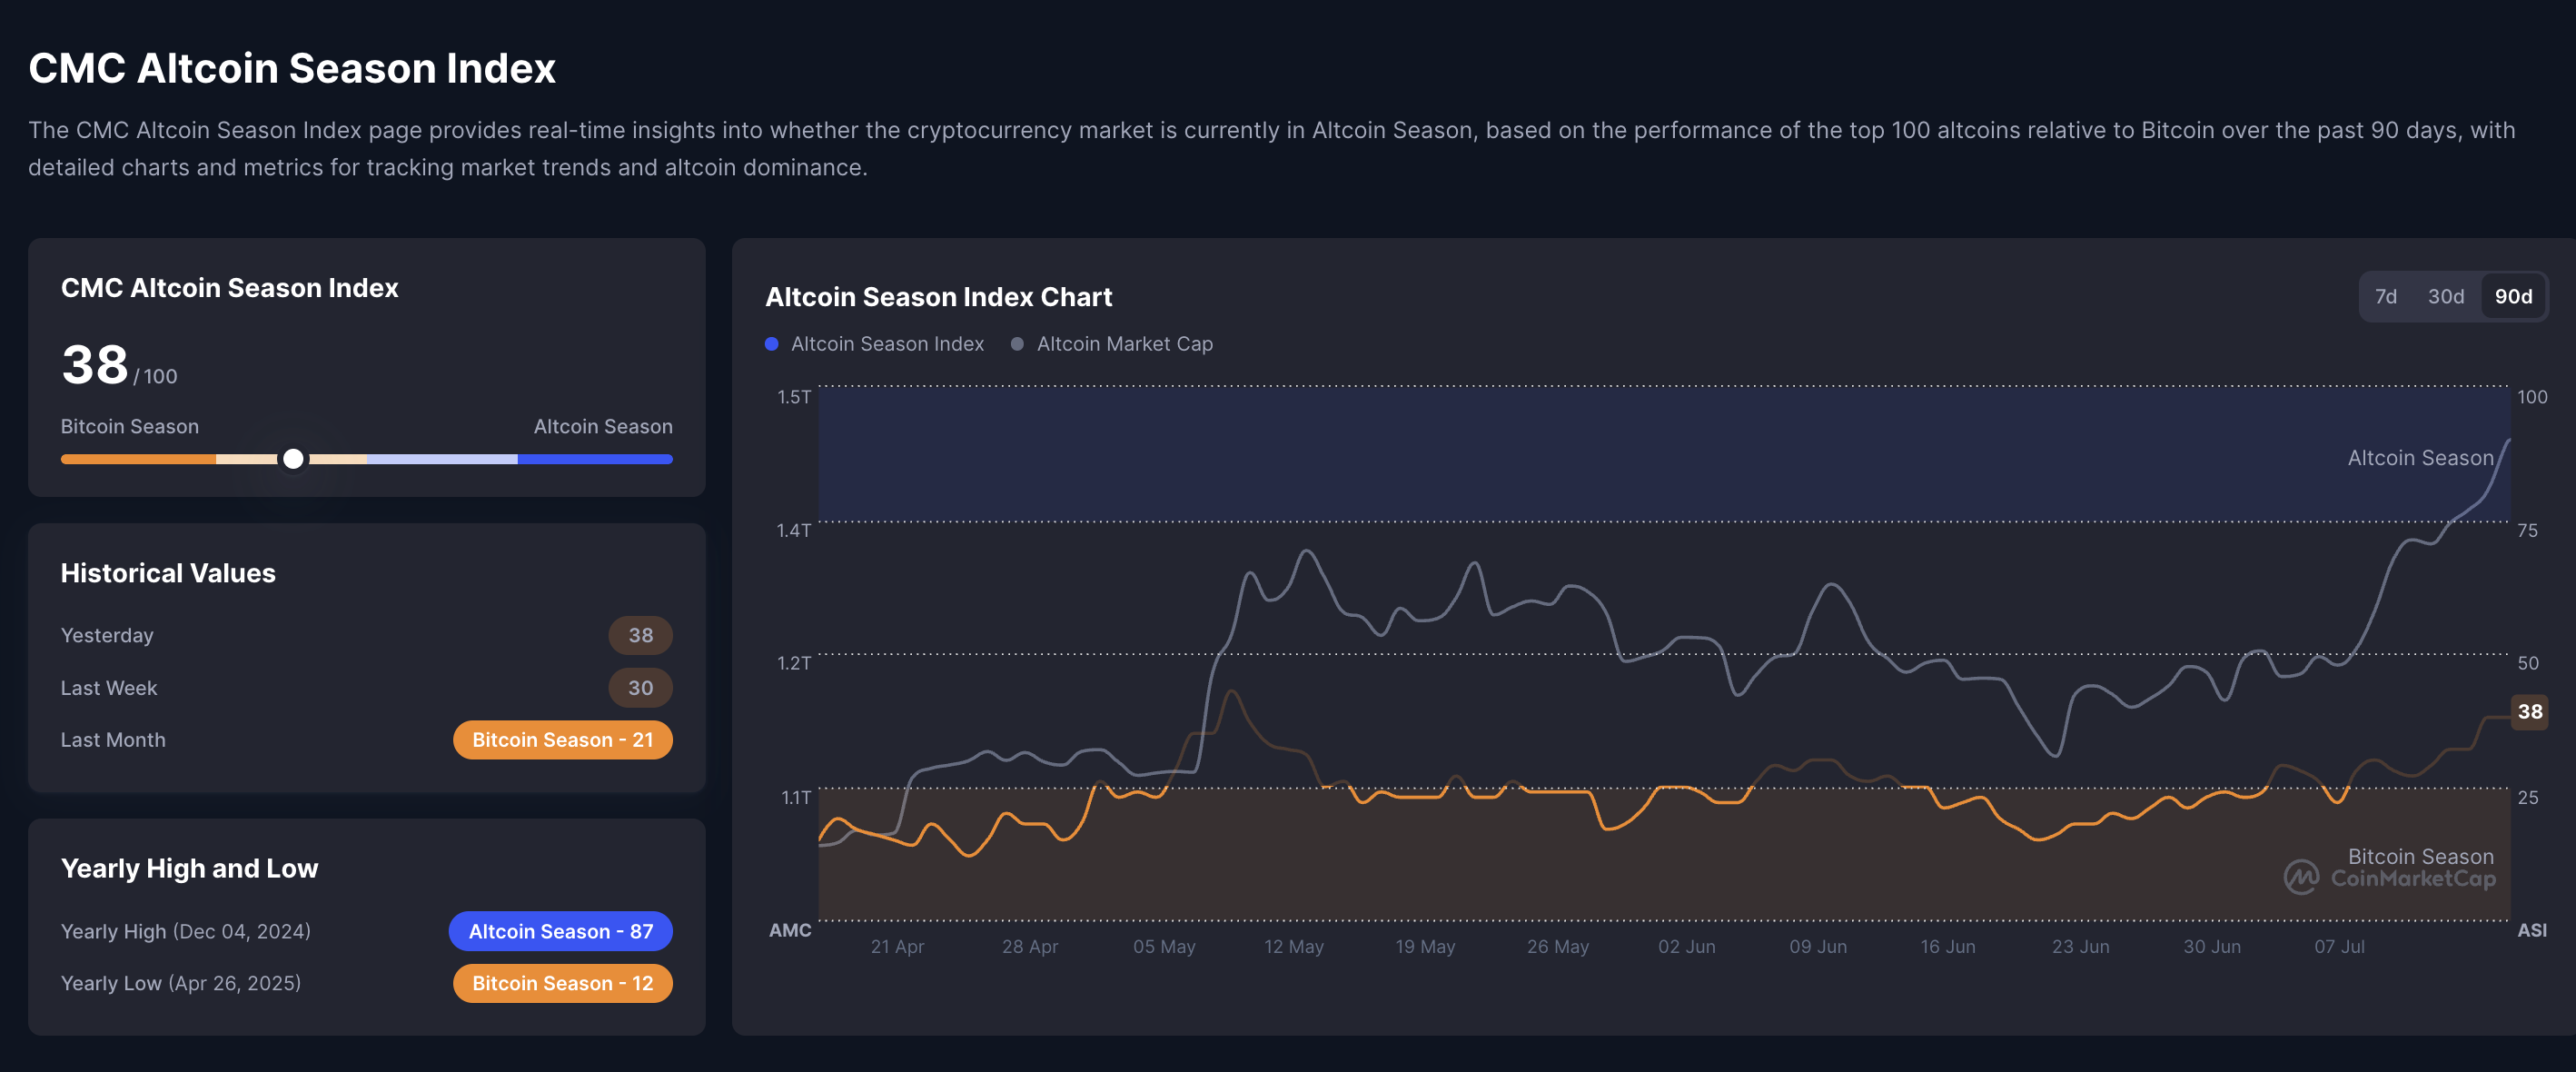
CoinMarketCap Altcoin Season Index.
The capital rotation pumps have driven the total crypto market capitalization, excluding bitcoin (TOTAL 2), by over 8% so far this week, to reach $1.41 trillion. Peter Brandt points to a cup-and-handle pattern rising in the TOTAL 2 weekly chart.
The analyst highlights the neckline at $1.70 trillion, which is close to the all-time high of $1.71 trillion reached during the 2021 altcoin season. A weekly close above this level could mark the beginning of a new altseason cycle.
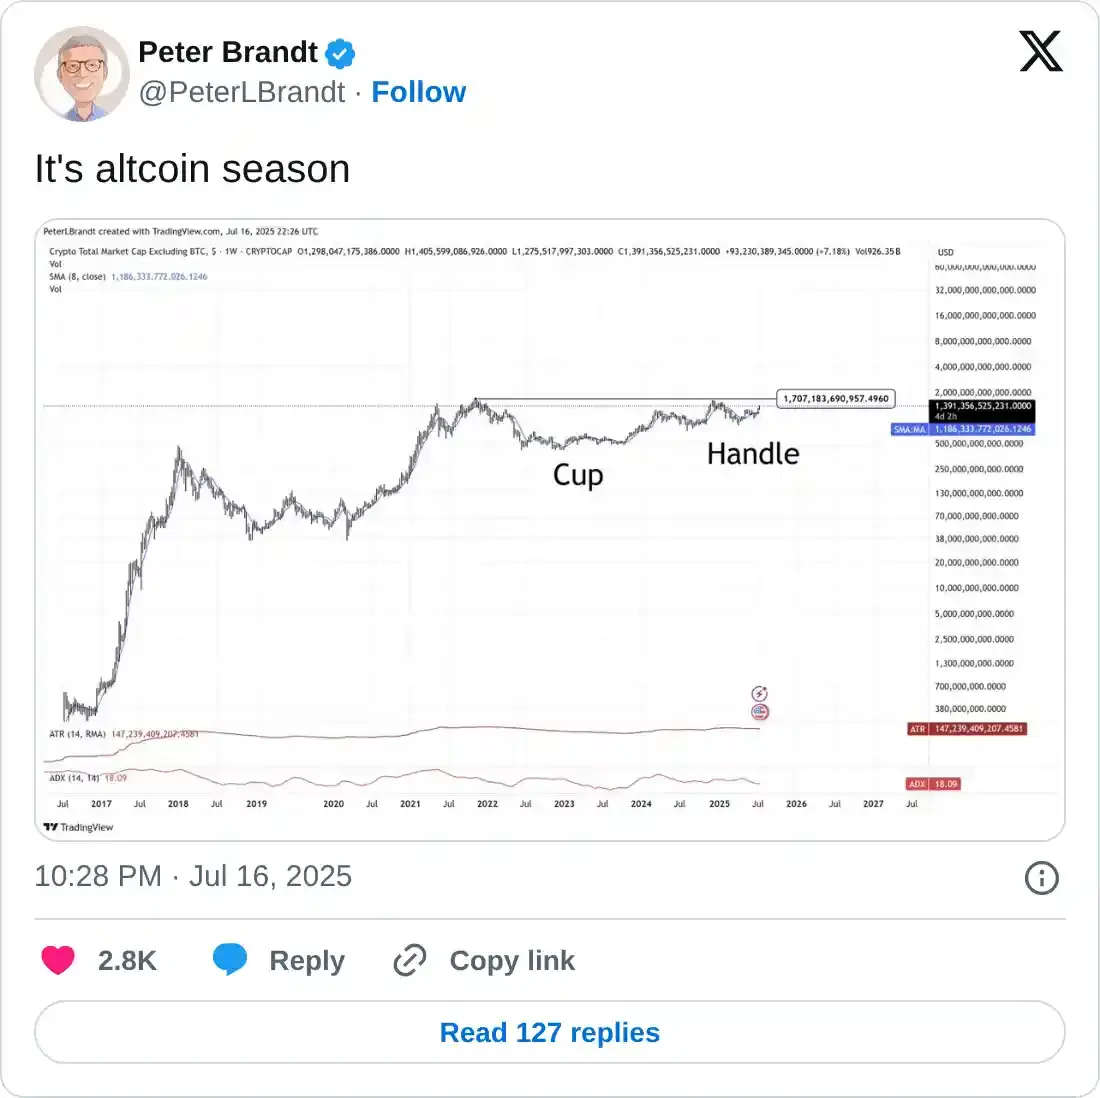
In such a case, the market capitalization of altcoins could cross the $2 trillion milestone, driving the total market valuation beyond $4 trillion.
