🚀 Solana Meme Coins FLOKI & BONK Explode 50%+ as CRV Eyes $1 Breakout – Meme Season Is Back!

Solana's meme coin ecosystem is stealing the show again—FLOKI and BONK just ripped double-digit gains while traders pile into CRV's bullish setup. Here's why degenerate capital is rotating back into risk assets.
The Meme Machine Awakens
Forget fundamentals—animal-themed tokens are printing again. Solana's low-fee playground lets speculators flip shitcoins with the urgency of a Wall Street trader hopped up on stimulants.
CRV's Make-or-Break Moment
All eyes on the $1 resistance level. A clean breakout could trigger algorithmic buying from quant funds still pretending they 'understand the tech.'
Bonus jab: Meanwhile, traditional finance bros are still arguing about bond yields while their interns secretly ape into dog coins.
FLOKI’s channel breakout target gains momentum
FLOKI edges lower by nearly 2% at press time on Thursday after bouncing off 30% higher from the 200-day Exponential Moving Average (EMA) on Wednesday. Floki's channel breakout rally gains traction as it reclaims the $0.000100 round figure.
The Solana-based meme coin faces opposition at the 61.8% Fibonacci retracement level $0.000142, extrapolated over the pullback from $0.000290 on November 21 to $0.000045 on April 7.
A daily close above this level could extend the bullish run to the 78.6% Fibonacci level at $0.000195.
The 50-day EMA surpasses the 100-day EMA, a sign of increased bullish momentum in the short-term trend.
The momentum indicators on the daily chart, Moving Average Convergence/Divergence (MACD), with a positive trend in the MACD and signal line, alongside the Relative Strength Index, indicate overbought conditions at 74, suggesting increased bullish momentum.
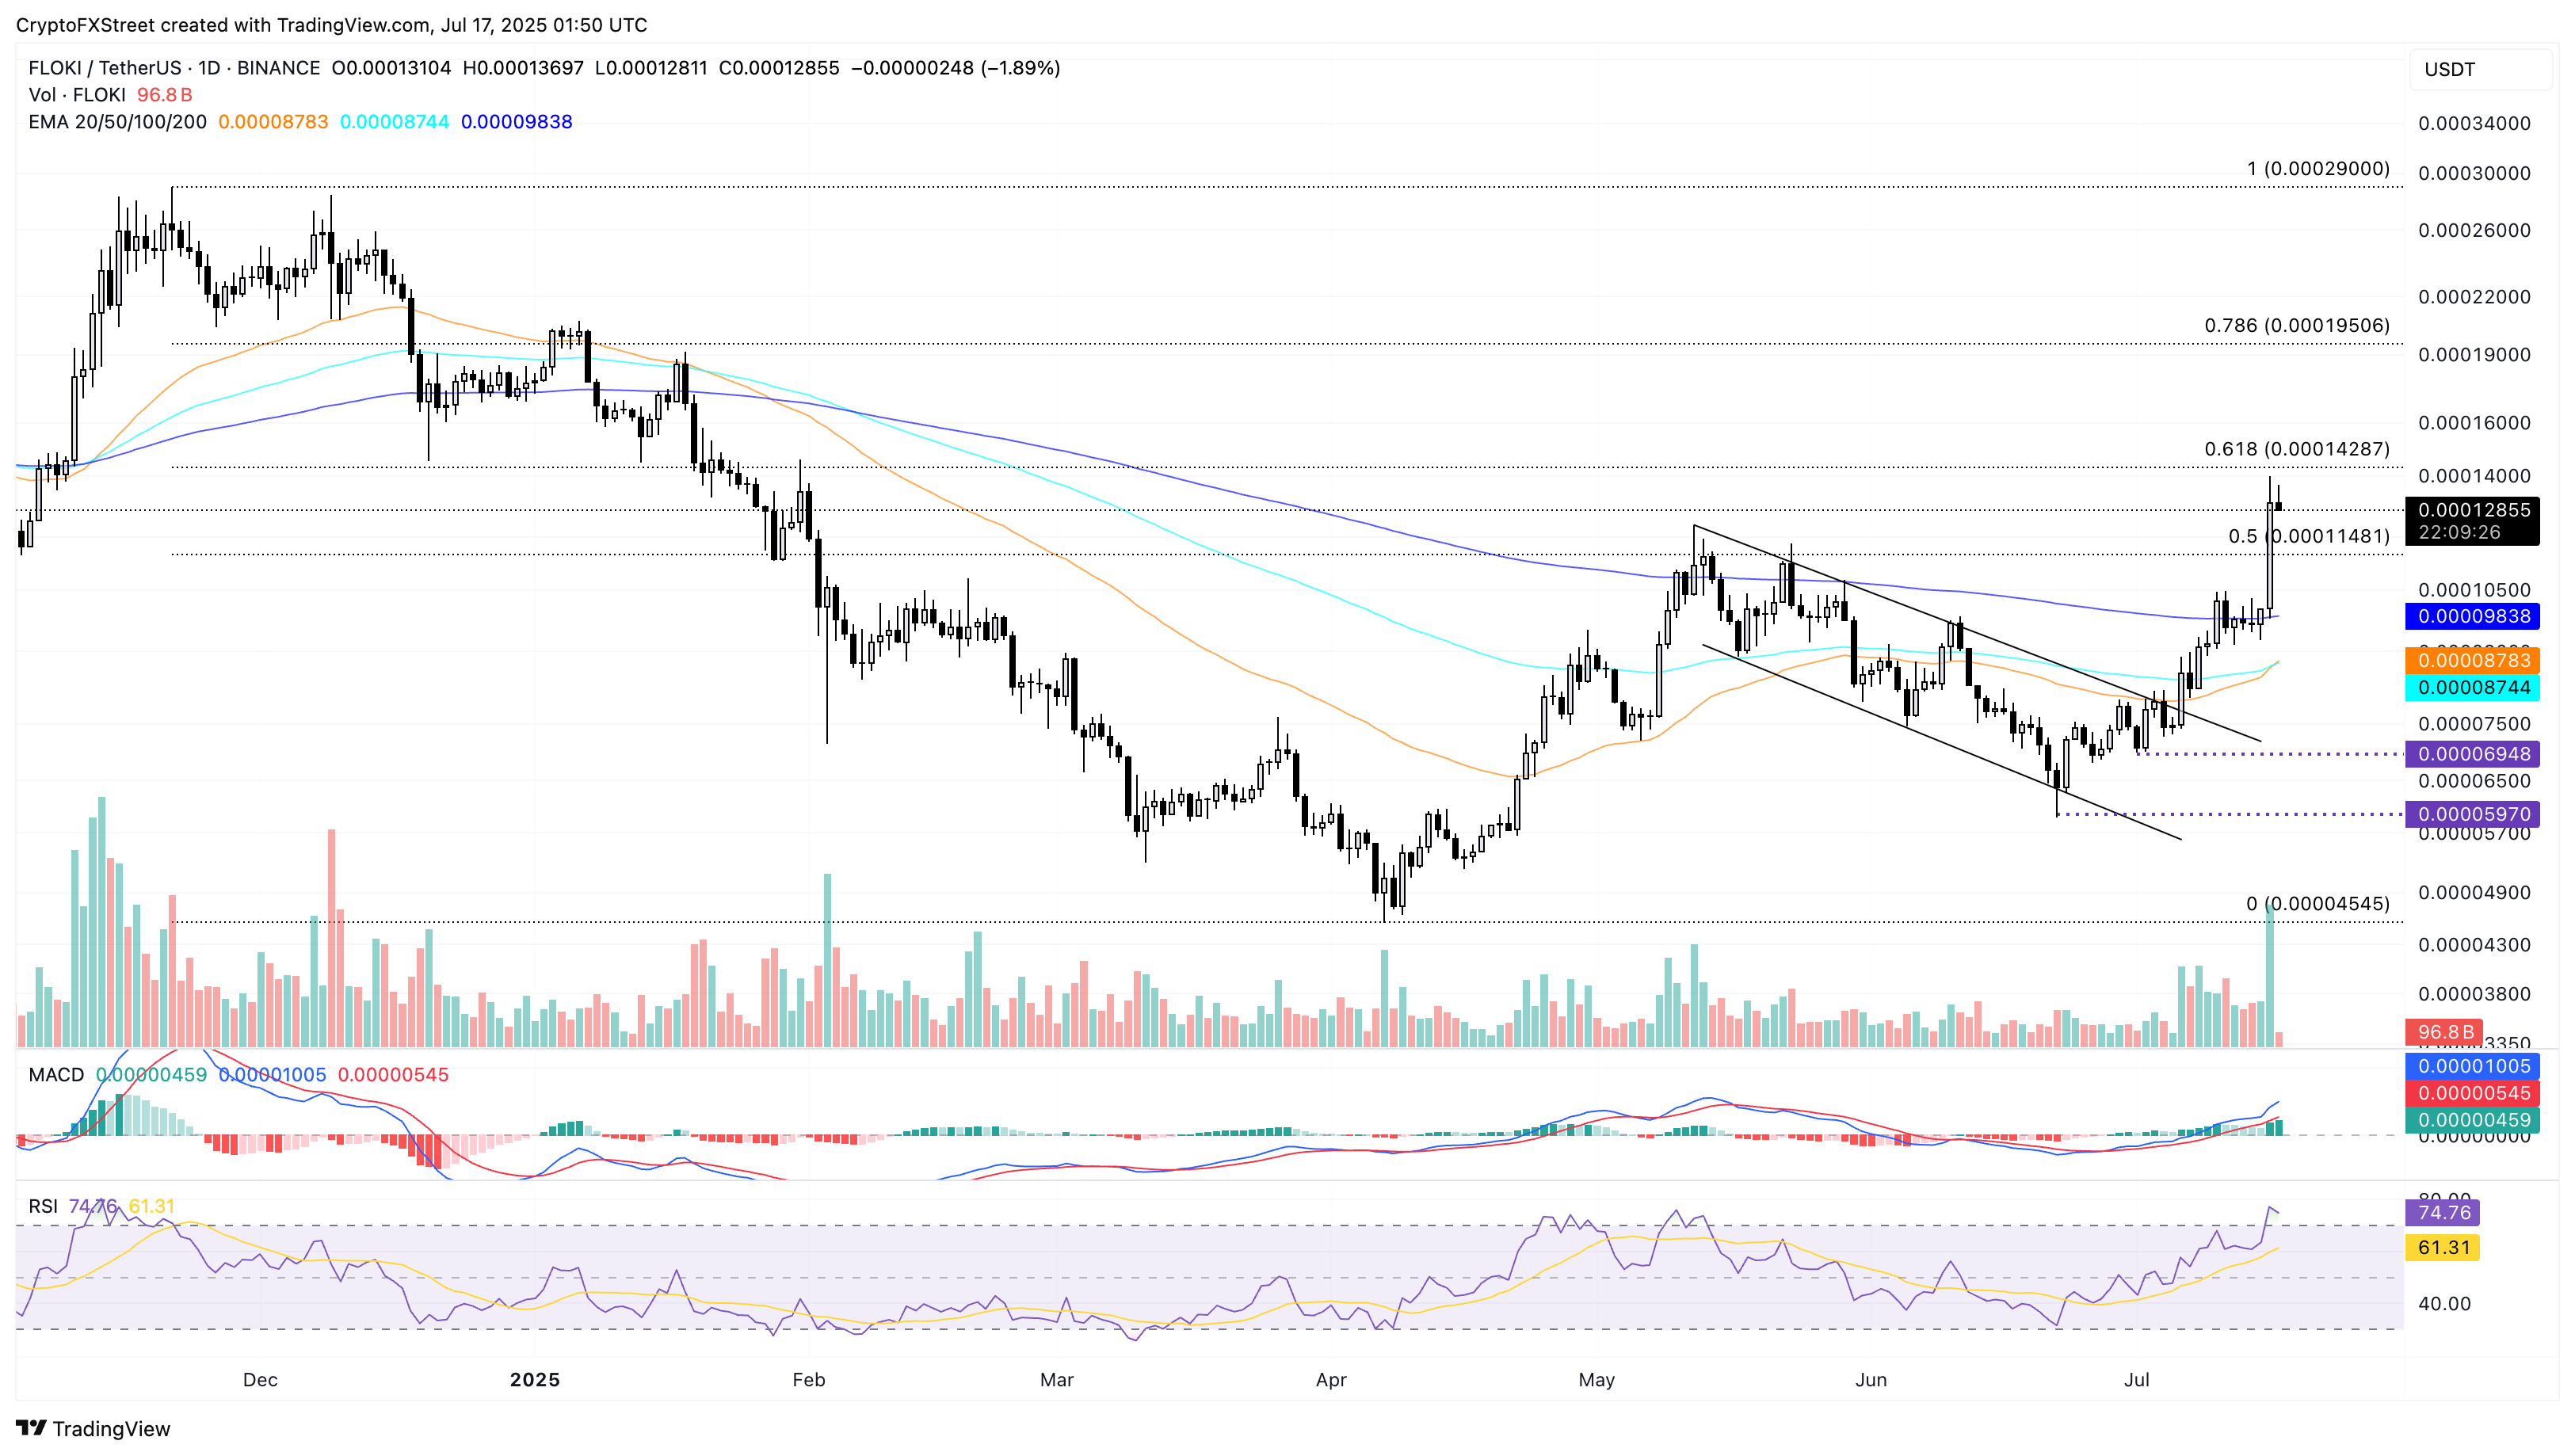
FLOKI/USDT daily price chart.
On the flip side, a reversal in FLOKI could test the 50% Fibonacci retracement level at $0.000114.
BONK eyes further gains amid golden cross
The Solana-based meme coin BONK has declined by 2% so far on Thursday, following five consecutive days of an uptrend. Similar to Floki, BONK surged by 30% on Wednesday, inching closer to the year-to-date high of $0.00003989.
The meme coin struggles to surpass the 78.6% Fibonacci level at $0.00004105, retraced from the November 20 peak of $0.00006230 to the April 7 low of $0.00000886. A decisive push above this level could stretch the BONK rally to $0.00006230.
The 50-day and 200-day EMAs manifest a golden cross, a trend reversal signal indicating further upside.
The MACD and signal line maintain an uptrend in the positive territory, while the overheated RSI at 81 indicates overbought conditions. Investors must remain cautious as overbought conditions foreshadow sharp pullbacks.
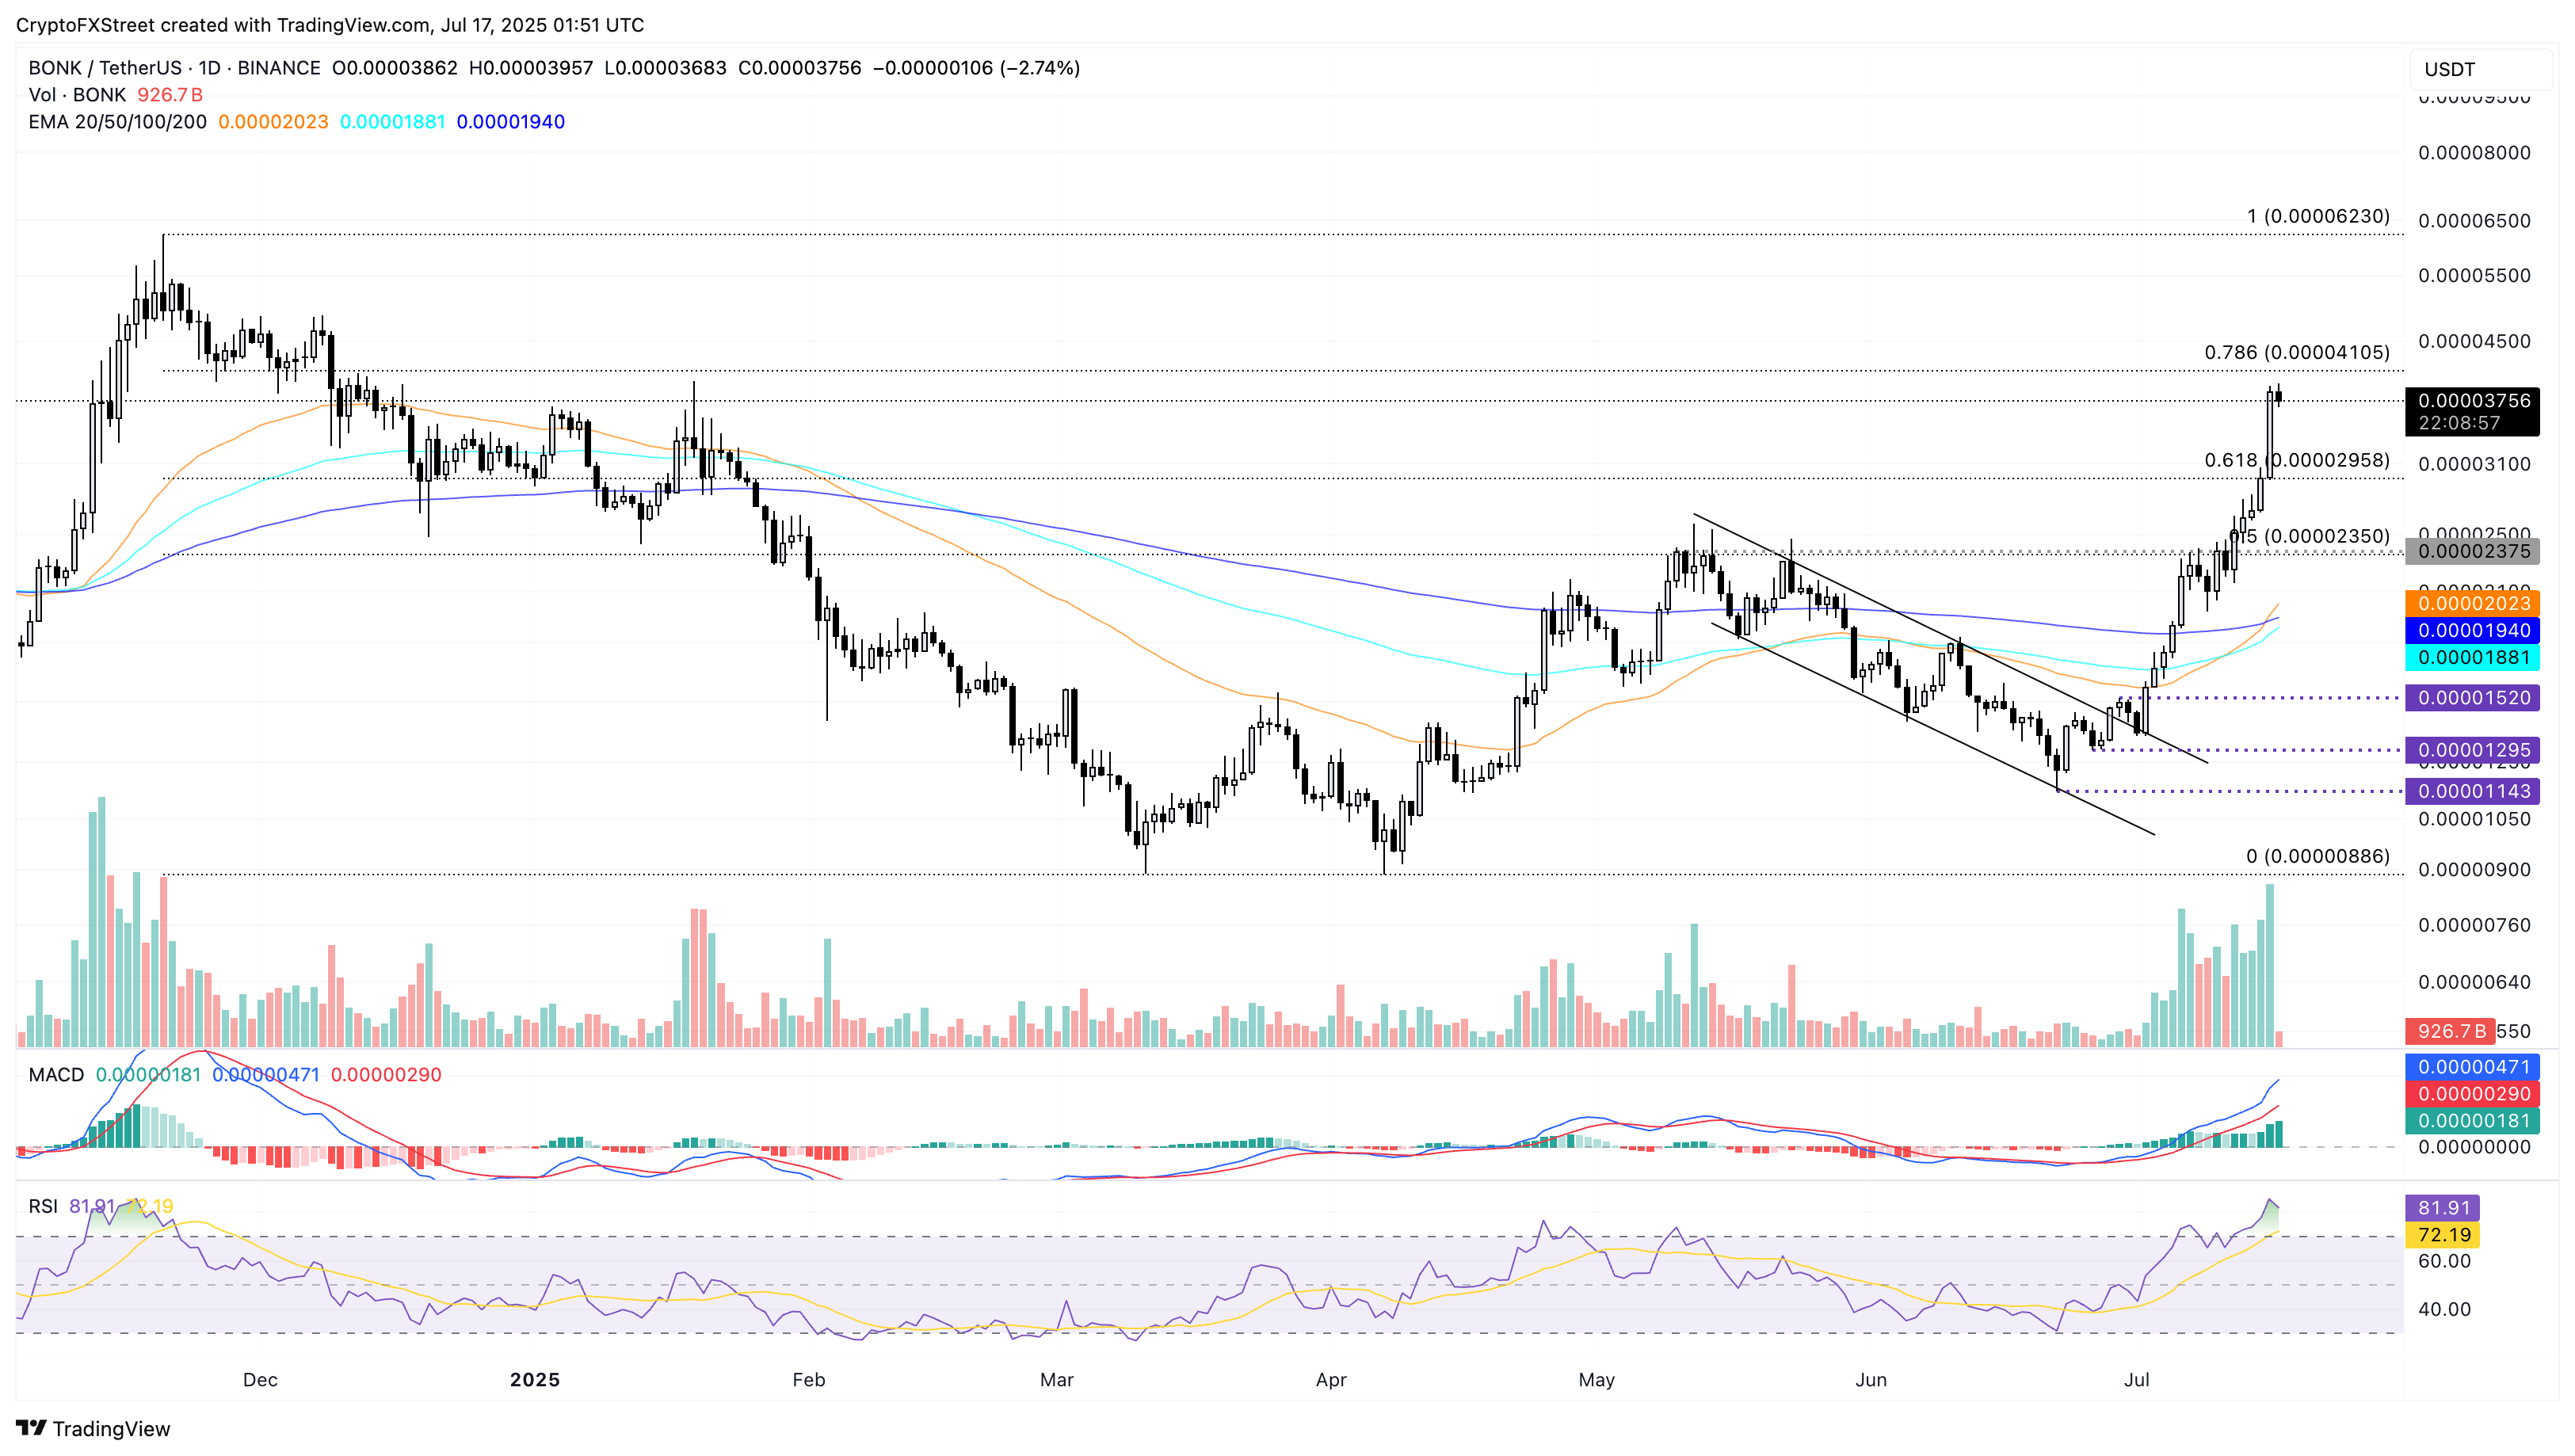
BONK/USDT daily price chart.
A negative close to the day could extend the declining trend to the 61.8% Fibonacci level at $0.00002958.
Curve DAO’s triangle breakout rally targets $1
Curve DAO prints its fifth consecutive bullish candle on the daily chart for a 42% surge so far this week. At the time of writing, CRV edges higher by 3%, marking the highest price since January 19.
The altcoin marks a triangle breakout rally formed by converging resistance (connected by the December 7 and May 22 peaks) and a support trendline (connected by the March 10 and July 5 closes). The breakout rally reaches the 78.6% Fibonacci retracement level at $0.9601, retraced from $1.2484 on December 6 to $0.3660 on March 10.
Investors could witness an extended rally with a daily close above this level, potentially targeting the $1.2484 peak.
The momentum indicators suggest a bullish bias as RSI at 83 rises into the overbought region, with the MACD displaying a rising trend of green histogram bars from the zero line.
An uptick in the 50-day EMA marked a golden cross with the 200-day EMA on Tuesday, signaling a trend reversal.
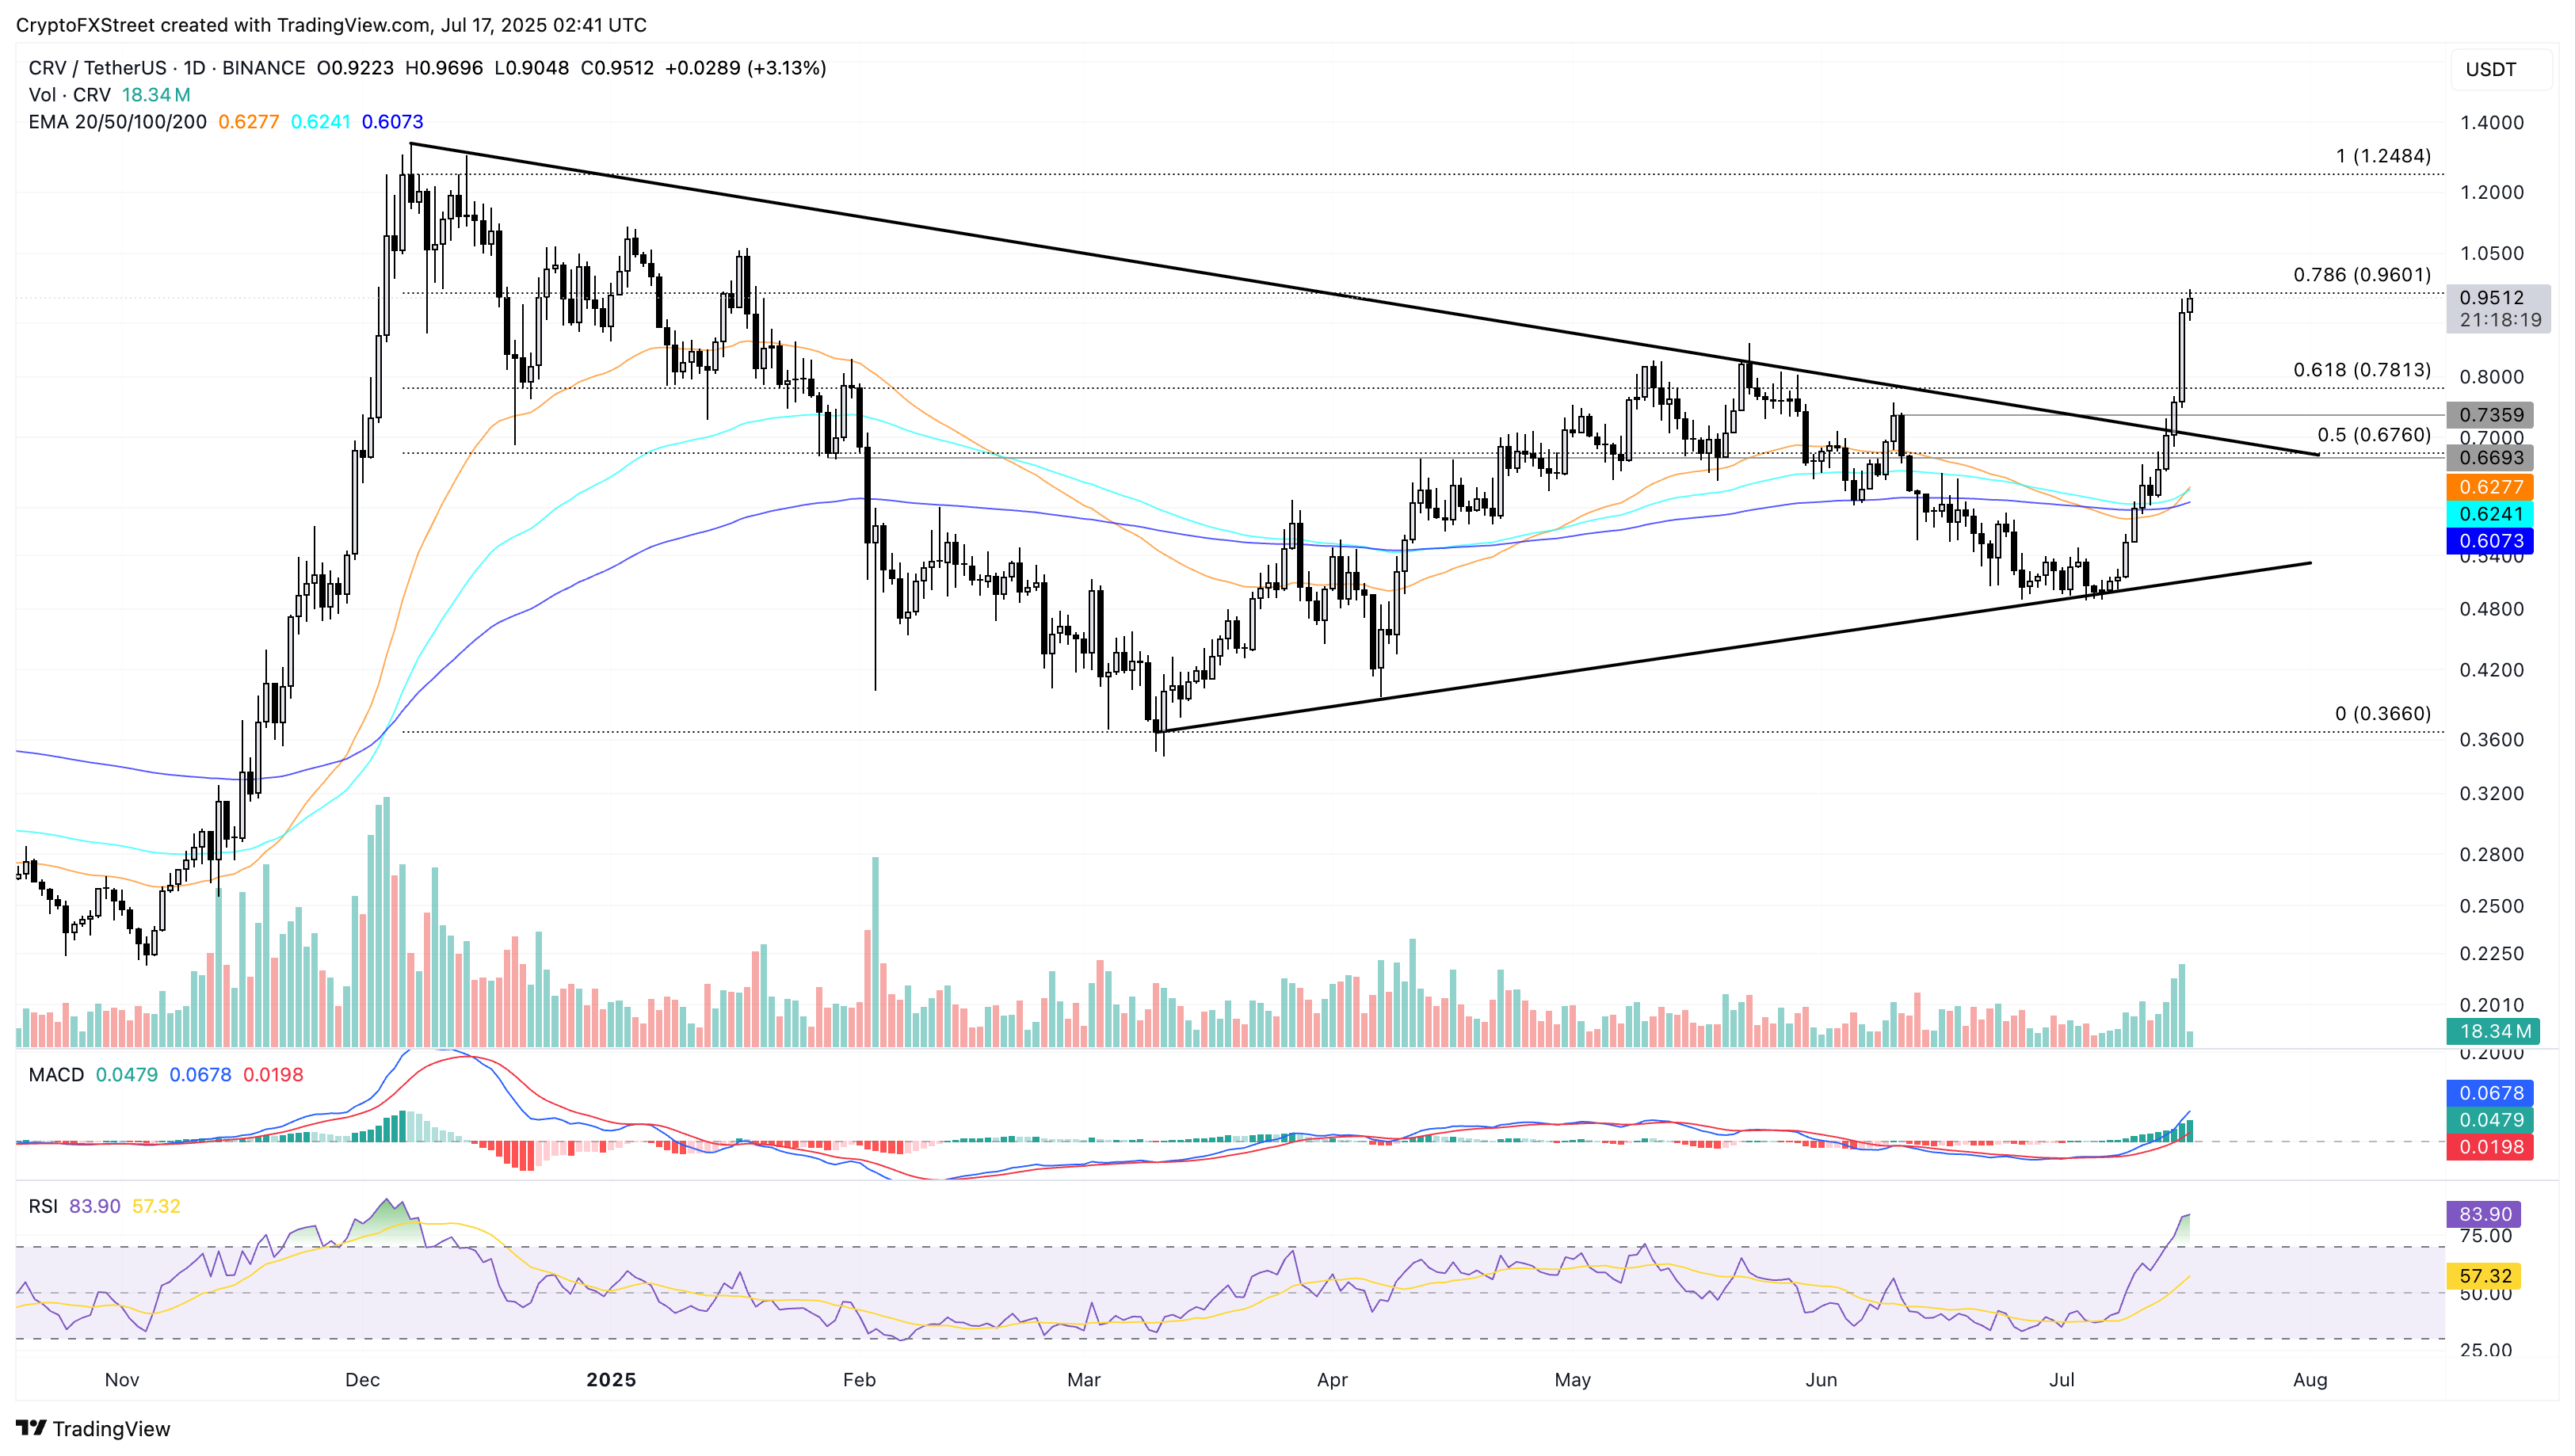
CRV/USDT daily price chart.
On the contrary, a reversal in CRV from the $0.9601 resistance could result in a retest of the $0.7813 level, aligning with the 61.8% Fibonacci retracement level.
