Stellar (XLM) Primed for Breakout: Record Open Interest & Golden Cross Signal Bullish Surge

Stellar's XLM isn't just flirting with gains—it's backed by the kind of technical and derivatives momentum that makes traders sit up. Open Interest at record highs? Check. A Golden Cross flashing on the charts? Double-check. This isn't hopium—it's the math talking.
Why derivatives matter: When Open Interest spikes, it means big money's placing bets. And right now, the smart money's stacking positions in XLM like it's 2021 all over again.
The Golden Cross effect: That 50-day MA slicing above the 200-day isn't just a pretty chart pattern—it's the kind of signal that historically precedes major rallies. Even your boomer uncle's FAANG stocks respect this indicator.
Caveat emptor: Sure, everything's lining up for Stellar... but since when do crypto markets follow the script? (Spoiler: They don't—just ask the 'stablecoin' traders who got rekt in the last bull run.)
Stellar’s network activity surge outpaces XRP ledger
The Block’s data displays a significant increase in Stellar’s number of new active addresses to 12.36K (the 7-day moving average of the number of unique addresses that have been active in the network) as on Monday, outpacing XRP Ledger’s increase to 8.34K addresses. A spike in the number of new active addresses refers to network adoption among new users.
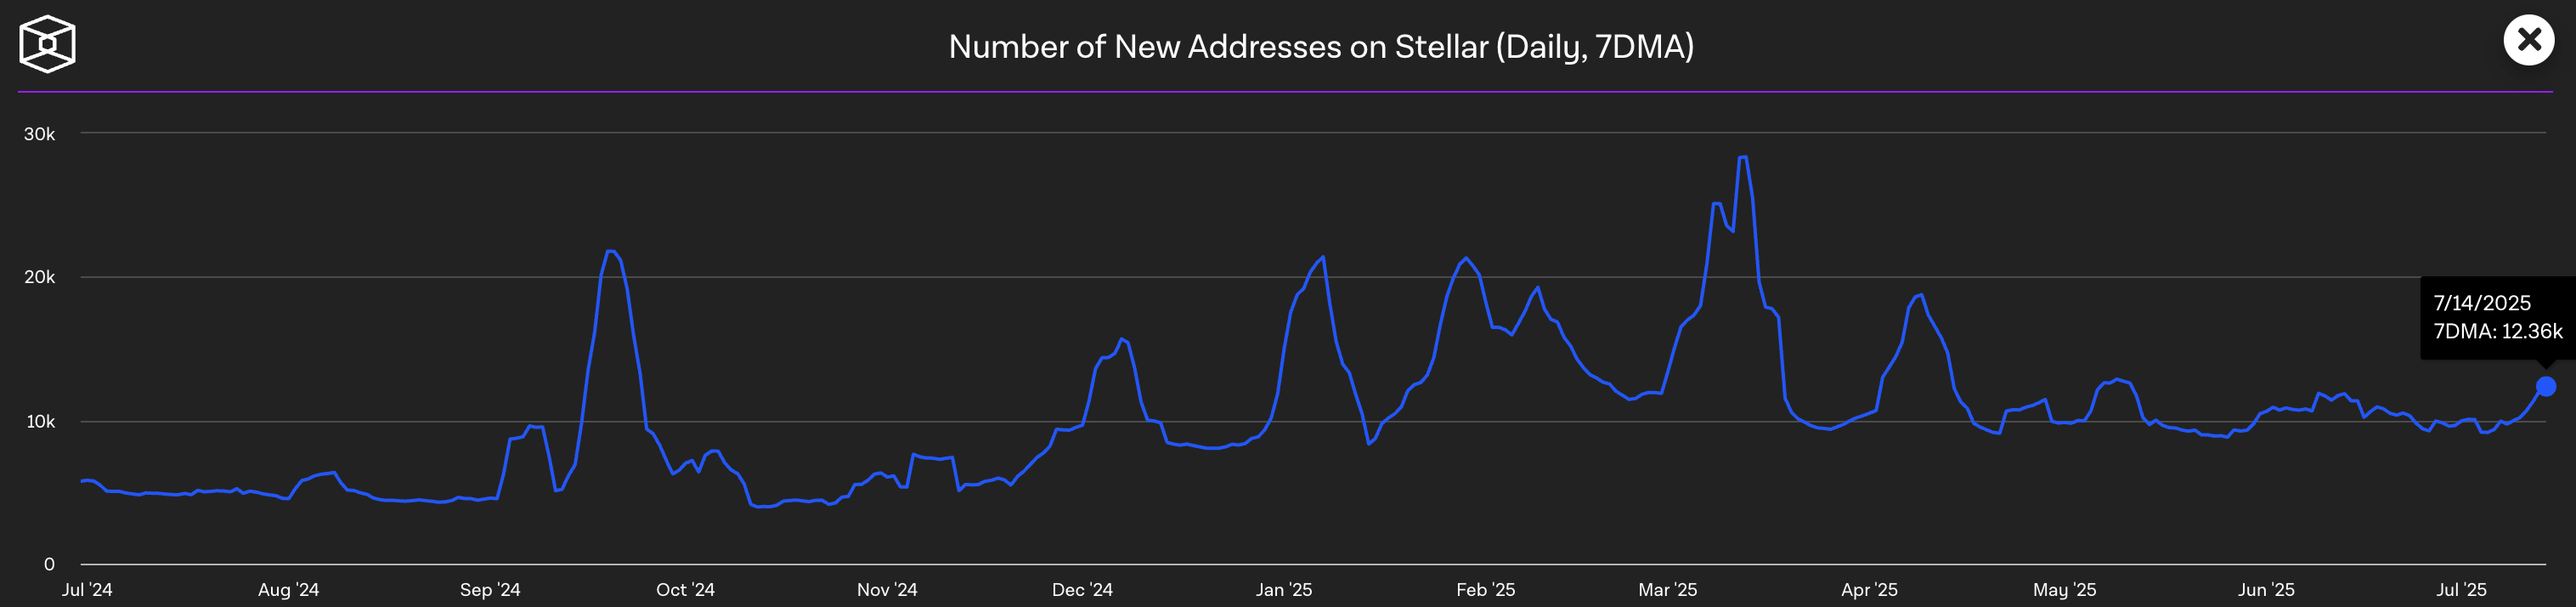
Number of new addresses on Stellar. Source: The Block
Stellar dominates the transaction count, with 5.20 million transactions (7-day moving average) as on Monday, significantly more than the 1.92 million on the XRP Ledger. An increase in transaction count is a direct result of heightened user activity.
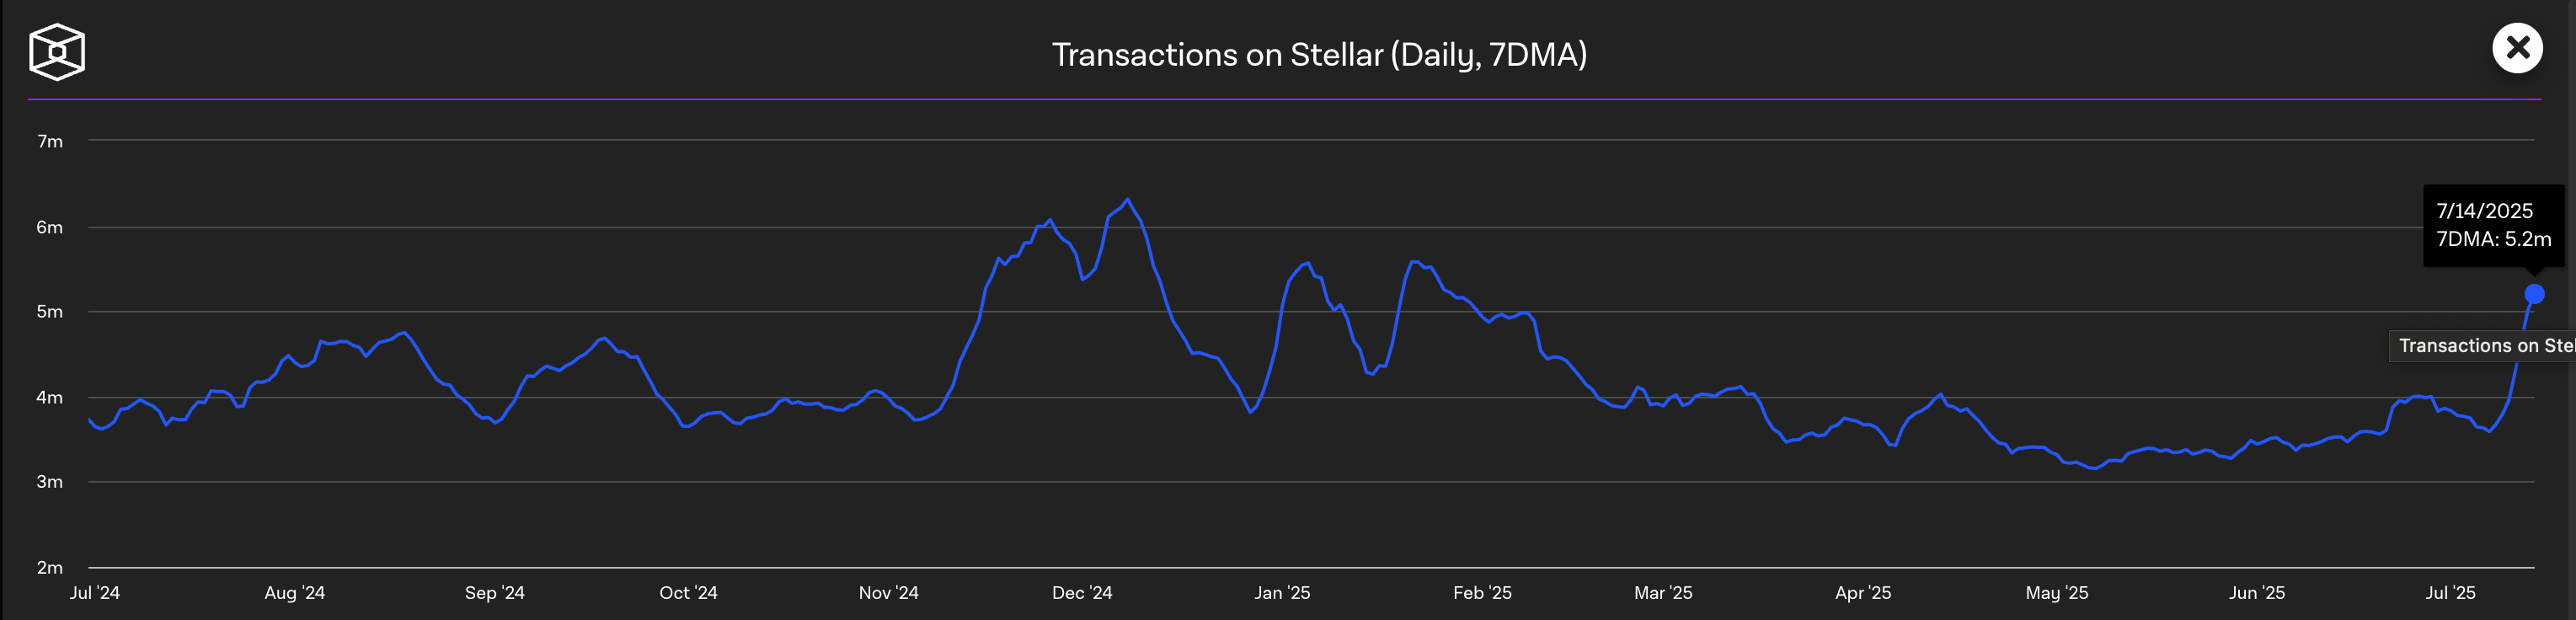
Transaction count on Stellar. Source: The Block
If stellar sustains dominance in network growth, it could win the cross-border payment token race.
XLM eyes $0.50 breakout amid a golden cross, record high Open Interest
XLM fluctuates between the 61.8% and 78.6% Fibonacci retracement levels at $0.4310 and $0.4880, respectively, drawn from the December 1 close of $0.5607 to the April 8 close of $0.2212.
The altcoin extends the bounce back from the 61.8% Fibonacci level on Tuesday, for a NEAR 4% appreciation on the day. If XLM bulls stretch the uptrend for a daily close above $0.4880, it could reclaim the $0.50 round figure, followed by the $0.5607 peak.
The bullish run in XLM triggered a golden cross between the 50-day and 200-day Exponential Moving Averages (EMAs) on July 13, indicating a fresh bullish trend that outpaces the longer-term trend.
The Moving Average Convergence/Divergence (MACD) indicator displays a positive trend, indicated by green histogram bars, suggesting increased bullish momentum.
Still, the Relative Strength Index (RSI) reads 83 after a minor drop in the overbought zone. Investors must remain cautious, as overbought conditions could result in sharp pullbacks.
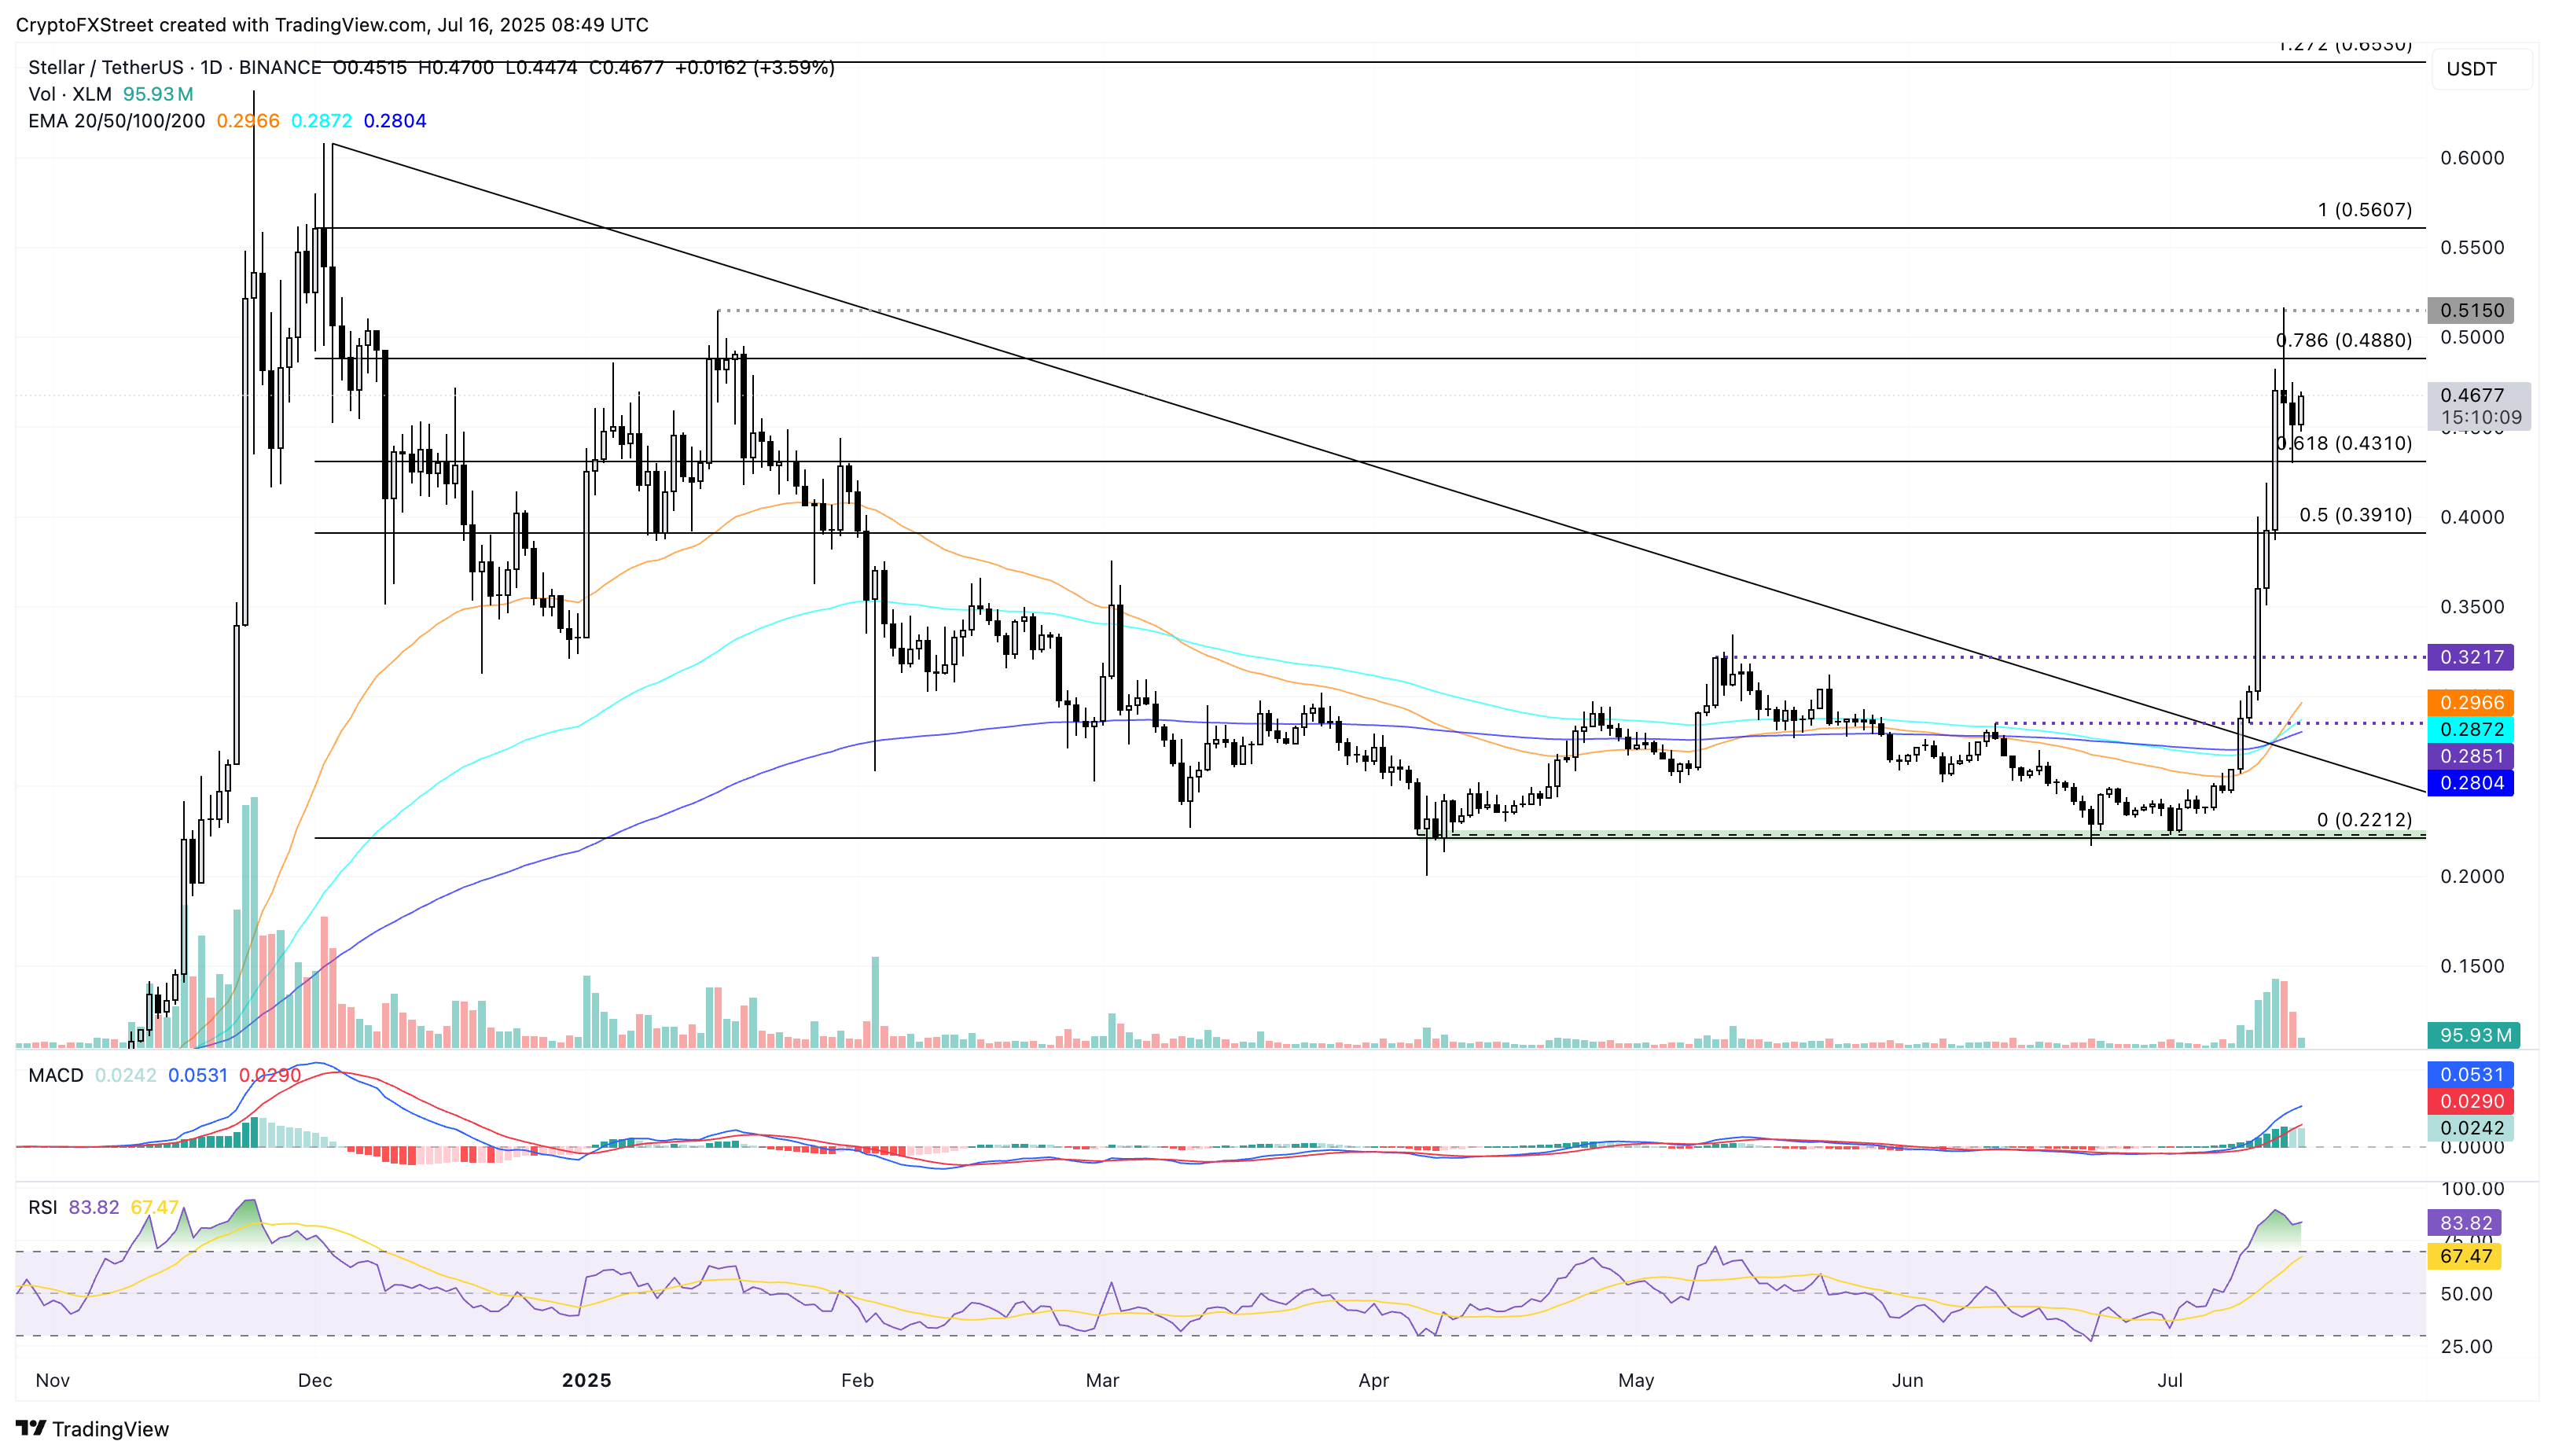
XLM/USDT daily price chart.
CoinGlass data shows that XLM Open Interest (OI) has dropped to $479.02 million, after reaching a record high of $520.03 million on Tuesday. The OI holds at record levels, suggesting increased capital inflows in XLM derivatives, a sign of heightened optimism.
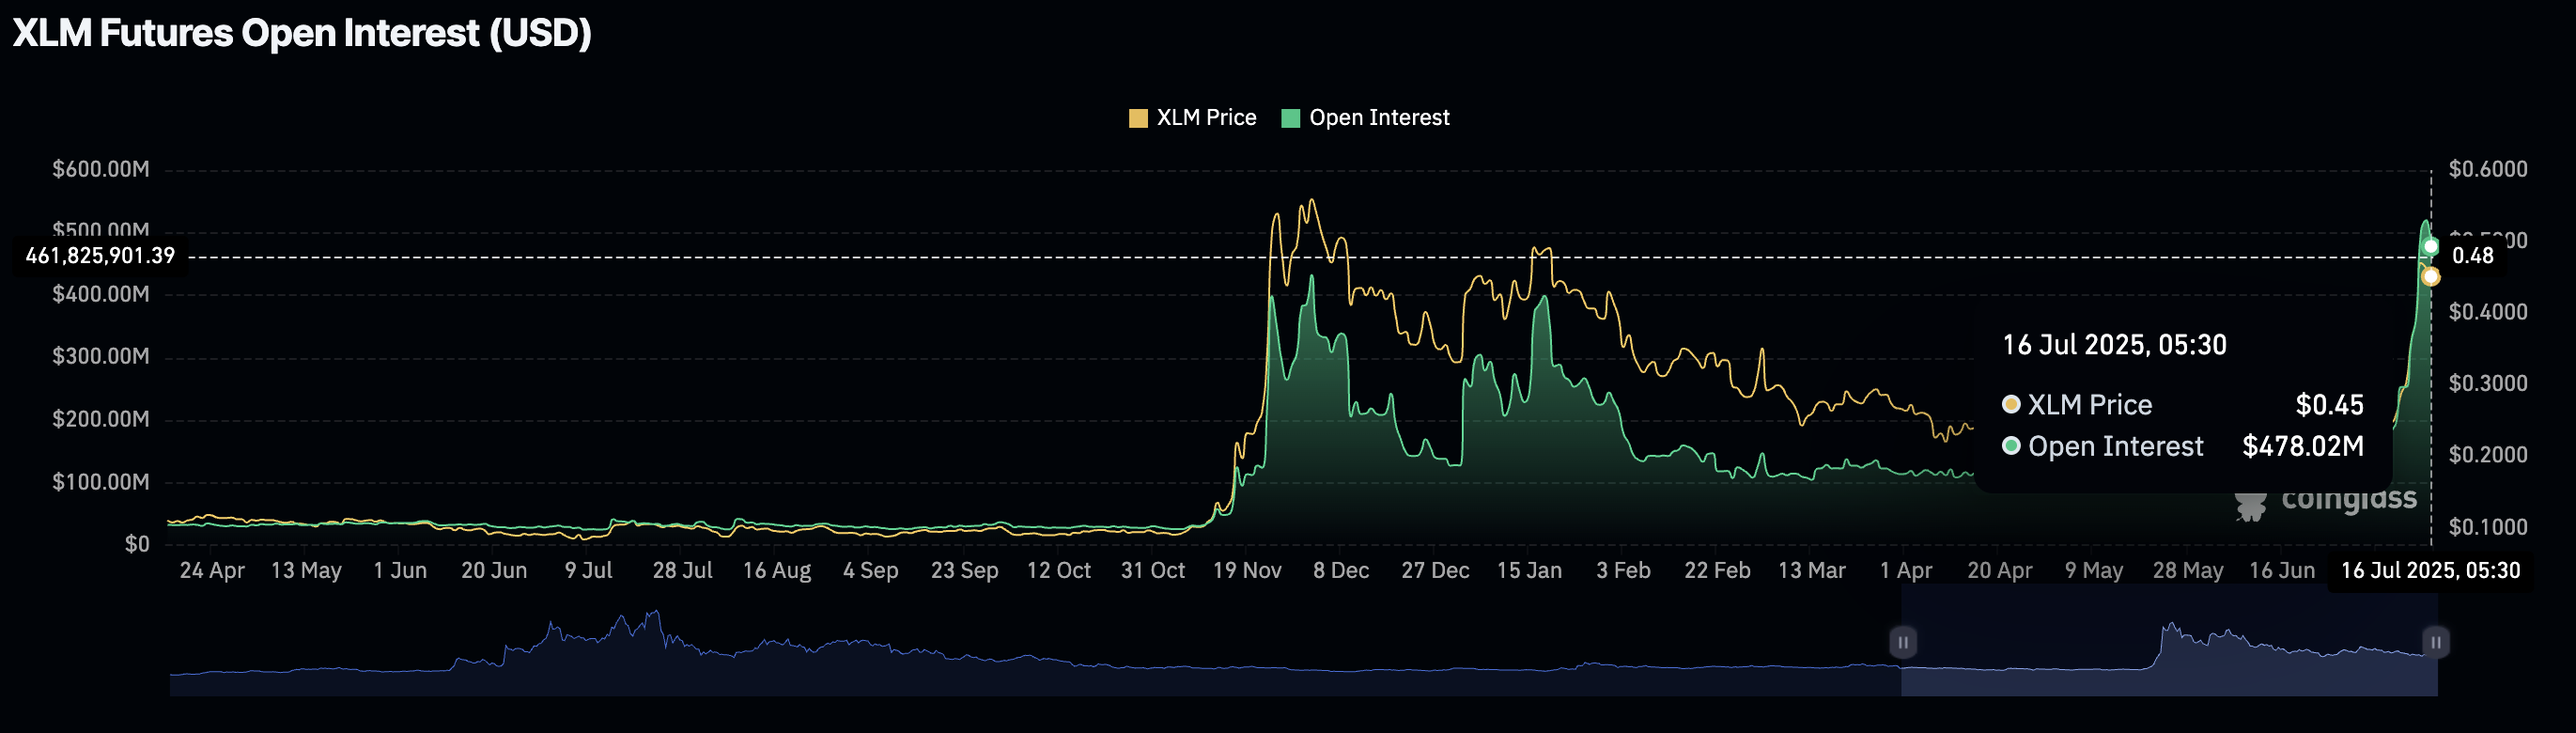
XLM Open Interest. Source: Coinglass
On the contrary, a daily close below the 61.8% Fibonacci retracement level at $0.4310 could extend the XLM declining trend to $0.3910, aligning with the 50% Fibonacci level.
