Bitcoin’s Chart Tells All: The Bull Run You Can’t Ignore (July 2025 Update)

Bitcoin's price action is writing checks Wall Street can't cash—again.
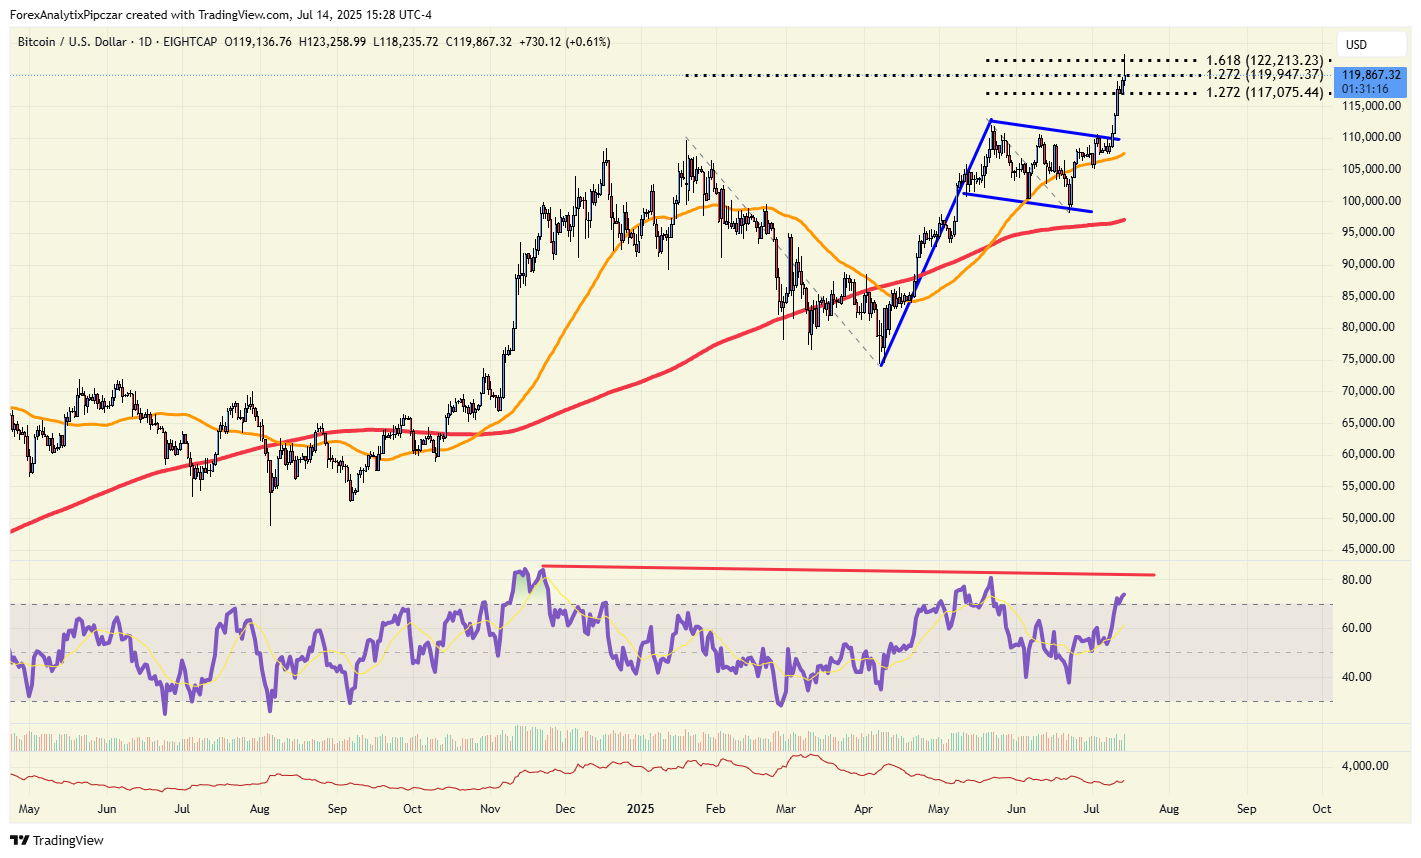
The king of crypto defies gravity
While traditional markets wobble under inflationary pressure, BTC's chart paints a different story: steady accumulation, shrinking supply, and institutional FOMO brewing beneath the surface. The 200-week moving average? Holding like a diamond-handed OG.
Short sellers getting liquidated
Another 10% weekly candle just wrecked another batch of leveraged shorts—because apparently, some hedge funds still think 'this time is different.' Spoiler: It never is.
Bankers hate this one trick
No bailouts. No board meetings. Just pure, uncensorable monetary energy—and a middle finger to the 'money printers go brrr' crowd. (Looking at you, Federal Reserve.)
The closer: Whether you call it digital gold or anarchist tech, one thing's clear—the orange coin outlives another crisis while the suits scramble to explain why their 'stable' assets aren't.