Bitcoin Dominance Hits Critical Resistance – Are Altcoins Primed for a Breakout?

Bitcoin's market dominance is knocking on a make-or-break resistance level—while altcoins hold their breath. Will history repeat with a BTC pullback sparking an altseason rally, or is this just another fakeout before another leg up for the king?
Market psychology at a crossroads
Traders are glued to charts as BTC.D flirts with levels that crushed altcoin dreams three times this year. Meme coins and DeFi tokens twitch with speculative energy, but liquidity's still parked in Bitcoin like a nervous investor hoarding gold bars.
The institutional factor
BlackRock's ETF inflows keep propping up BTC while altcoin volumes bleed out—Wall Street's stamp of approval cuts both ways. Meanwhile, Ethereum ETF delays have ETH maximalists grinding their teeth hard enough to mint NFT collectibles.
Watch these technicals
A decisive weekly close above 55% BTC.D likely means more pain for alts. But flip that resistance into support, and suddenly every crypto VC's 'next Solana' pitch deck starts looking marginally less ridiculous. Just don't expect hedge funds to care until after they've frontrun the retail crowd—again.
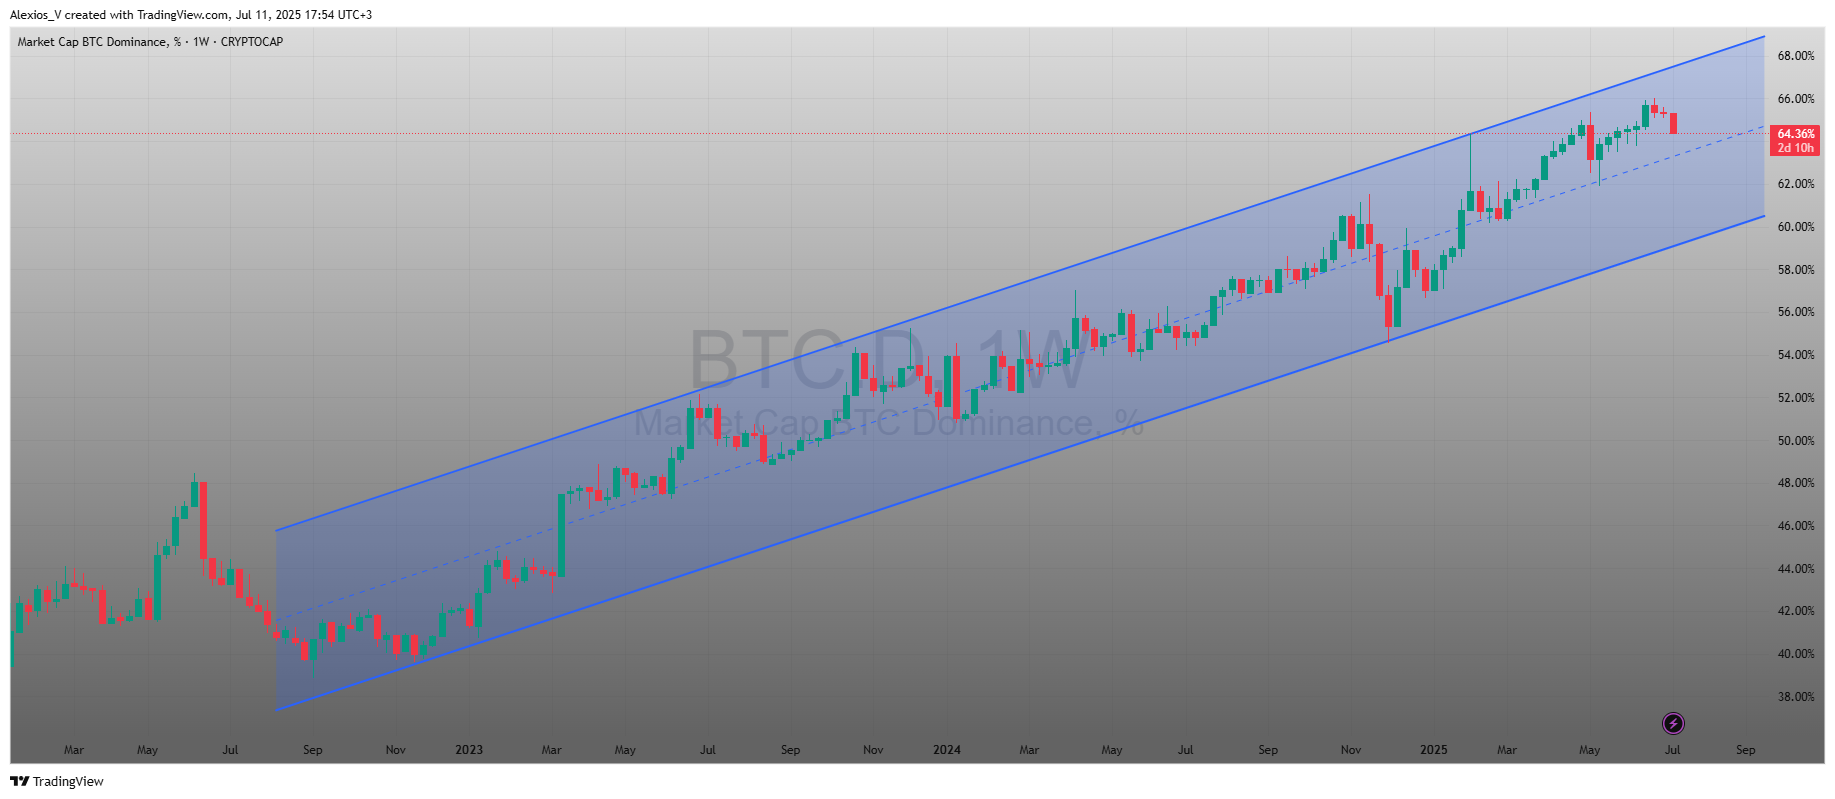
A look at the Bitcoin dominance channel
Since early 2023, bitcoin dominance has been moving inside a steady. This means the trend has been climbing, with price bouncing between two rising lines — support on the bottom and resistance on the top.
Every time dominance touched the lower side of the channel, it found buyers. Every time it reached the top, it lost momentum. This pattern has repeated many times. And now, the chart is again testing the top boundary NEAR 64.58%.
This resistance area has a history. In the past, dominance failed to break above it and turned lower. If that happens again, it could open the door for a shift in capital back to altcoins — a moment many traders call.
What Bitcoin dominance tells us about the crypto market
When dominance rises, it usually means Bitcoin is taking in more value compared to other coins. That can happen for many reasons — fear in the market, major BTC news, or weak altcoin performance. But there is always a limit.
A high dominance level, like the one we see now, often creates pressure in the system. Investors may start taking profit from Bitcoin and MOVE back into altcoins, especially if BTC
shows signs of slowing down. This shift in behavior can change the look of the.
In simple terms, when Bitcoin stops growing faster than everything else, smaller cryptocurrencies have more room to move. That is why many watch this chart closely.
Two scenarios to watch
This moment presents two possible outcomes. Both could bring strong moves across the.
If Bitcoin dominance fails to break above the 64.6%–65% level, it might fall back toward the middle or even the lower end of the channel. That could mean a drop to the 55%–58% area.
Such a decline would likely come with stronger interest in altcoins. Funds might rotate out of Bitcoin and into high-risk tokens, DeFi coins, and other LAYER 1 or Layer 2 projects. In short, this could be the start of, a period when altcoins outperform Bitcoin for weeks or even months.
This scenario would also signal that Bitcoin has reached a short-term peak in relative strength, at least for now. The total crypto market might grow more evenly, rather than being led by BTC alone.
If Bitcoin dominance pushes through the resistance and closes above 66% with strong momentum, that could signal a deeper shift. This breakout WOULD show that Bitcoin is not just leading the market — it is starting to take over completely.
In this case,could rise even faster, pulling value away from almost every altcoin category. Thewould move into new territory, breaking away from the rising channel that has held for nearly two years.
Such a breakout could also mean altcoins face more weakness ahead. Traders may continue to prefer Bitcoin for its relative safety, especially during uncertain market conditions.
What would invalidate the pattern?
Patterns do not last forever. Two situations could break this channel’s meaning:
- A strong breakout above 66% dominance that stays above for many days or weeks. That would mean the channel no longer controls price movement.
- A sharp breakdown below the lower trendline (around 58%) would mean the uptrend is over, and Bitcoin is losing its grip on the total market.
Both cases would change the structure of the market and affect portfolio strategies.
Why this chart matters now
Thechart has been one of the most useful tools for spotting turning points in the. It does not show prices of coins directly, but it shows.
Right now, Bitcoin dominance is at a key resistance level. If the past is any guide, this could be an area where altcoins wake up. But if dominance breaks higher, Bitcoin could pull even more capital, changing how investors approach the market in 2025.
Keep an eye on this chart. Whether tracking,, or the overall, this is one of the best signals for understanding the next big move.
Bitcoin dominance chart today
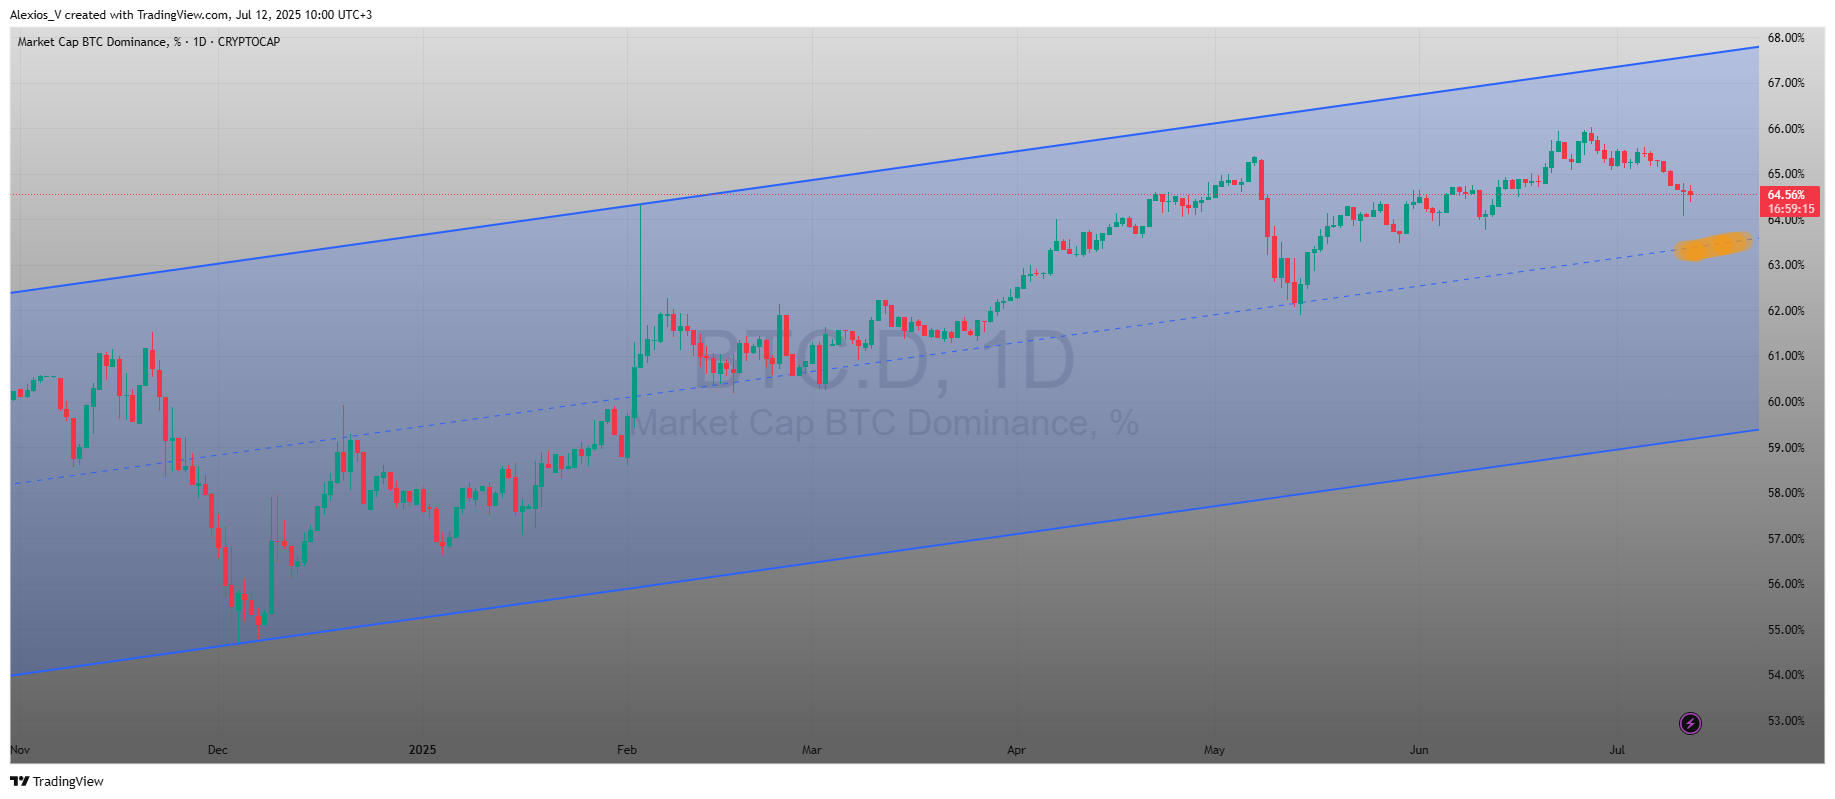
As of today, thebriefly touched 65.42%, attempting to break higher but triggering a sell-off in the. Bitcoin itself stayed relatively stable, while capital rotated into smaller coins. What stands out now is the midline of the rising channel. This level, which once acted as both support and resistance, could become a turning point again. If dominance bounces off the midline and heads lower, toward 60%, altcoins may see renewed momentum. For now, as long as Bitcoin stays above key trend lines, confidence remains strong among bulls, and thecould lean toward furthergrowth.
And remember, this article is for. Always do your own research and never invest more than you can afford to lose.
