🚀 Bitcoin Rockets Past $120K—Ethereum & XRP Catch Fire in Frenzied Crypto Rally

Bitcoin just detonated a bullish bomb across crypto markets—shattering resistance at $120,000 and dragging Ethereum and XRP into its gravity well. Traders are piling into altcoins like gamblers at a rigged roulette table.
### The Domino Effect
When BTC moves, the market grovels. Ethereum’s smart contract engine is revving as DeFi degens leverage up, while XRP’s zombie army of bagholders finally sees green. Neither fundamentals nor SEC lawsuits matter when hopium’s this thick.
### Wall Street’s FOMO Playbook
Hedge funds now ‘diversify’ with 3% crypto allocations—just enough to feign relevance while their quants sweat over vintage Excel models. Meanwhile, retail traders YOLO rent money into meme coins. Some things never change.
The rally’s real? Absolutely. Sustainable? Ask the leveraged longs getting liquidated at the next -20% candle. Crypto winter’s coming… just not today.
Market overview: Bitcoin surges to fresh highs
Bitcoin faces less selling pressure compared to its previous records. According to CryptoQuant data, despite Bitcoin ascending to fresh all-time highs, selling pressure remains significantly low, as evidenced by a slump in exchange inflows, which average 18,000 BTC, the lowest level since April 2015.
“Large holders are also reducing activity: the daily volume of BTC sent to exchanges in batches of 100+ BTC has dropped from 62K BTC on November 26, 2024, to just 7K BTC today,” CryptoQuant outlined in Thursday’s Weekly crypto Report.
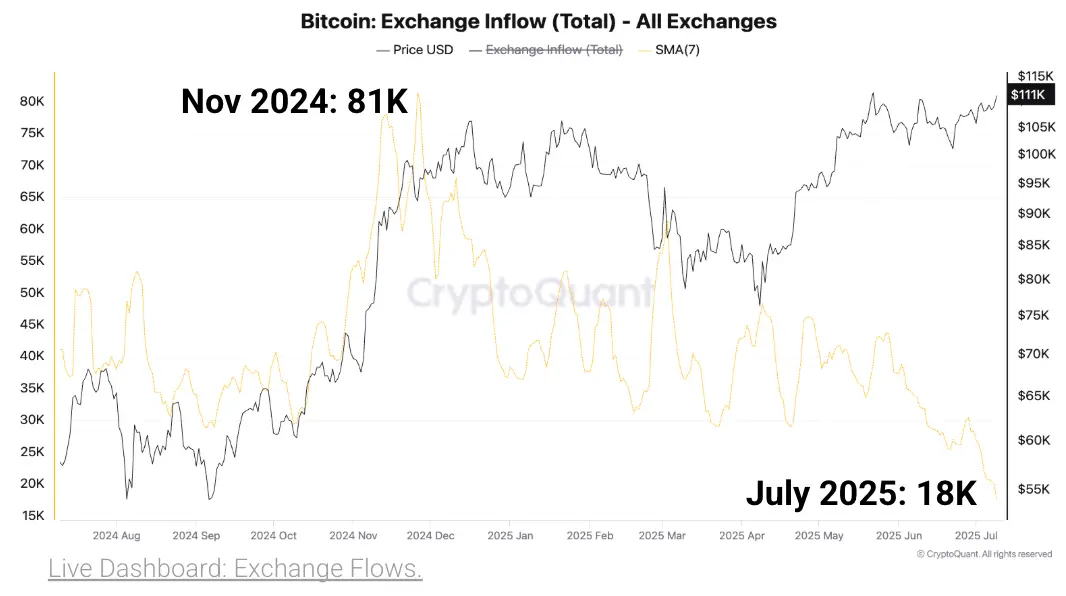
Bitcoin exchange inflows | Source CryptoQuant
The report pointed to the muted transactions in the altcoin sector, indicating that investors are not rushing to sell at the earliest sign of profit. Often, daily altcoin exchange inflow transactions tend to surge during or following a significant price upswing. This implies that traders intend to sell for profit.
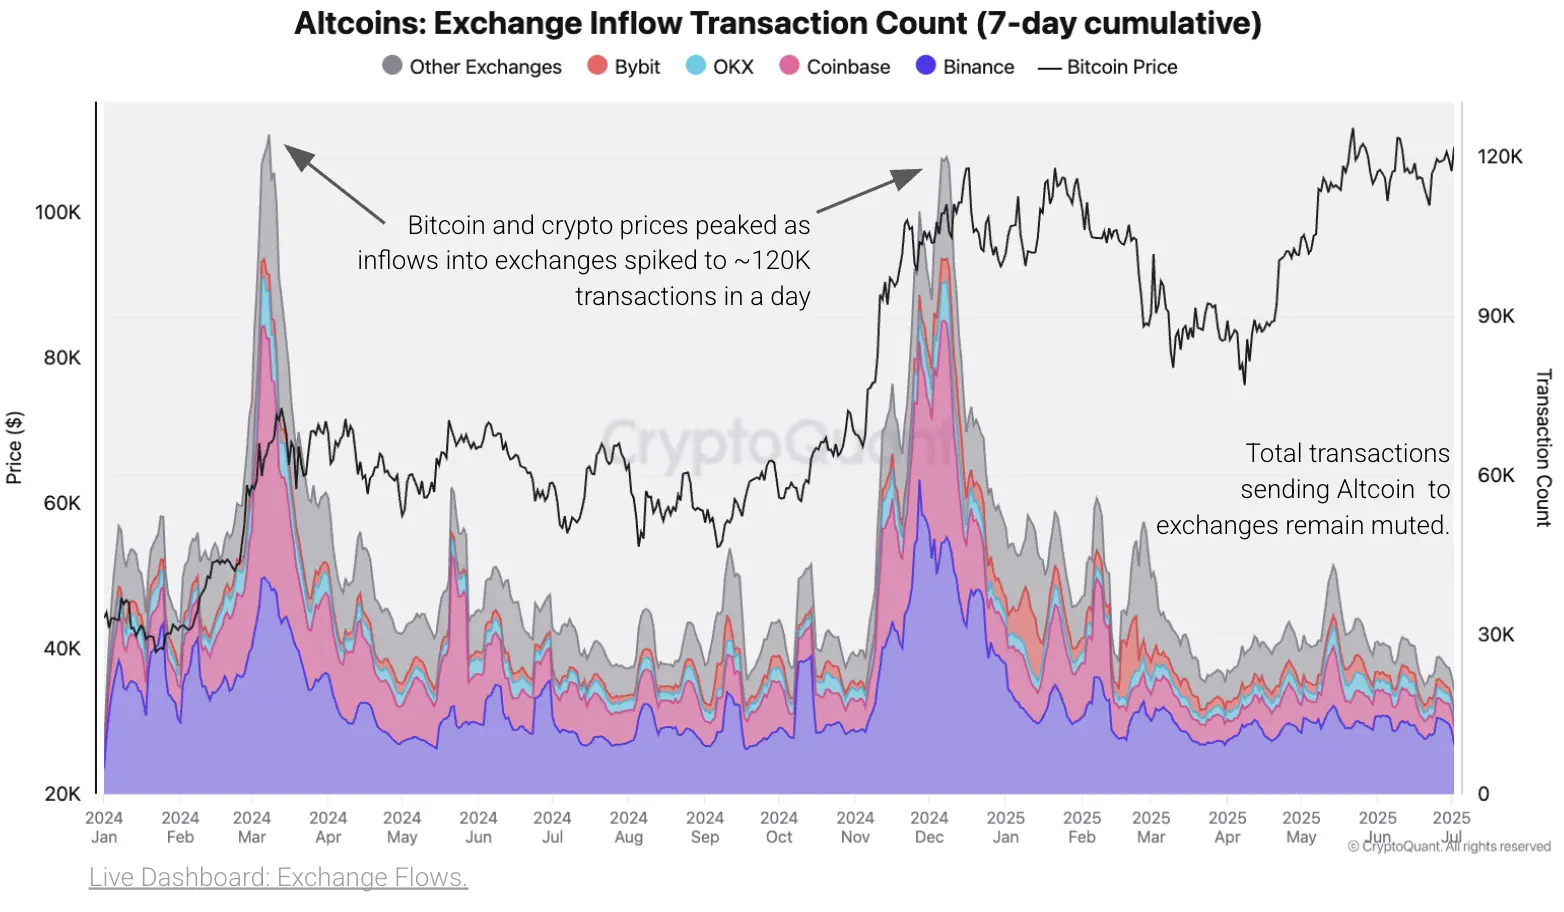
Altcoin exchange inflow | Source: CryptoQuant
Data spotlight: Bitcoin spot ETF inflow exceeds $1 billion
Bitcoin spot Exchange Traded Funds (ETFs) daily total net inflow surged on Thursday, reaching $1.18 billion, marking the second-largest daily capital inflow in history. The surge coincided with Bitcoin price rally to new all-time highs, underscoring the role of institutional investors in the coin’s performance. All the 12 ETFs licensed in the US boast $51.3 billion in cumulative net inflows, with net assets averaging $144 billion.
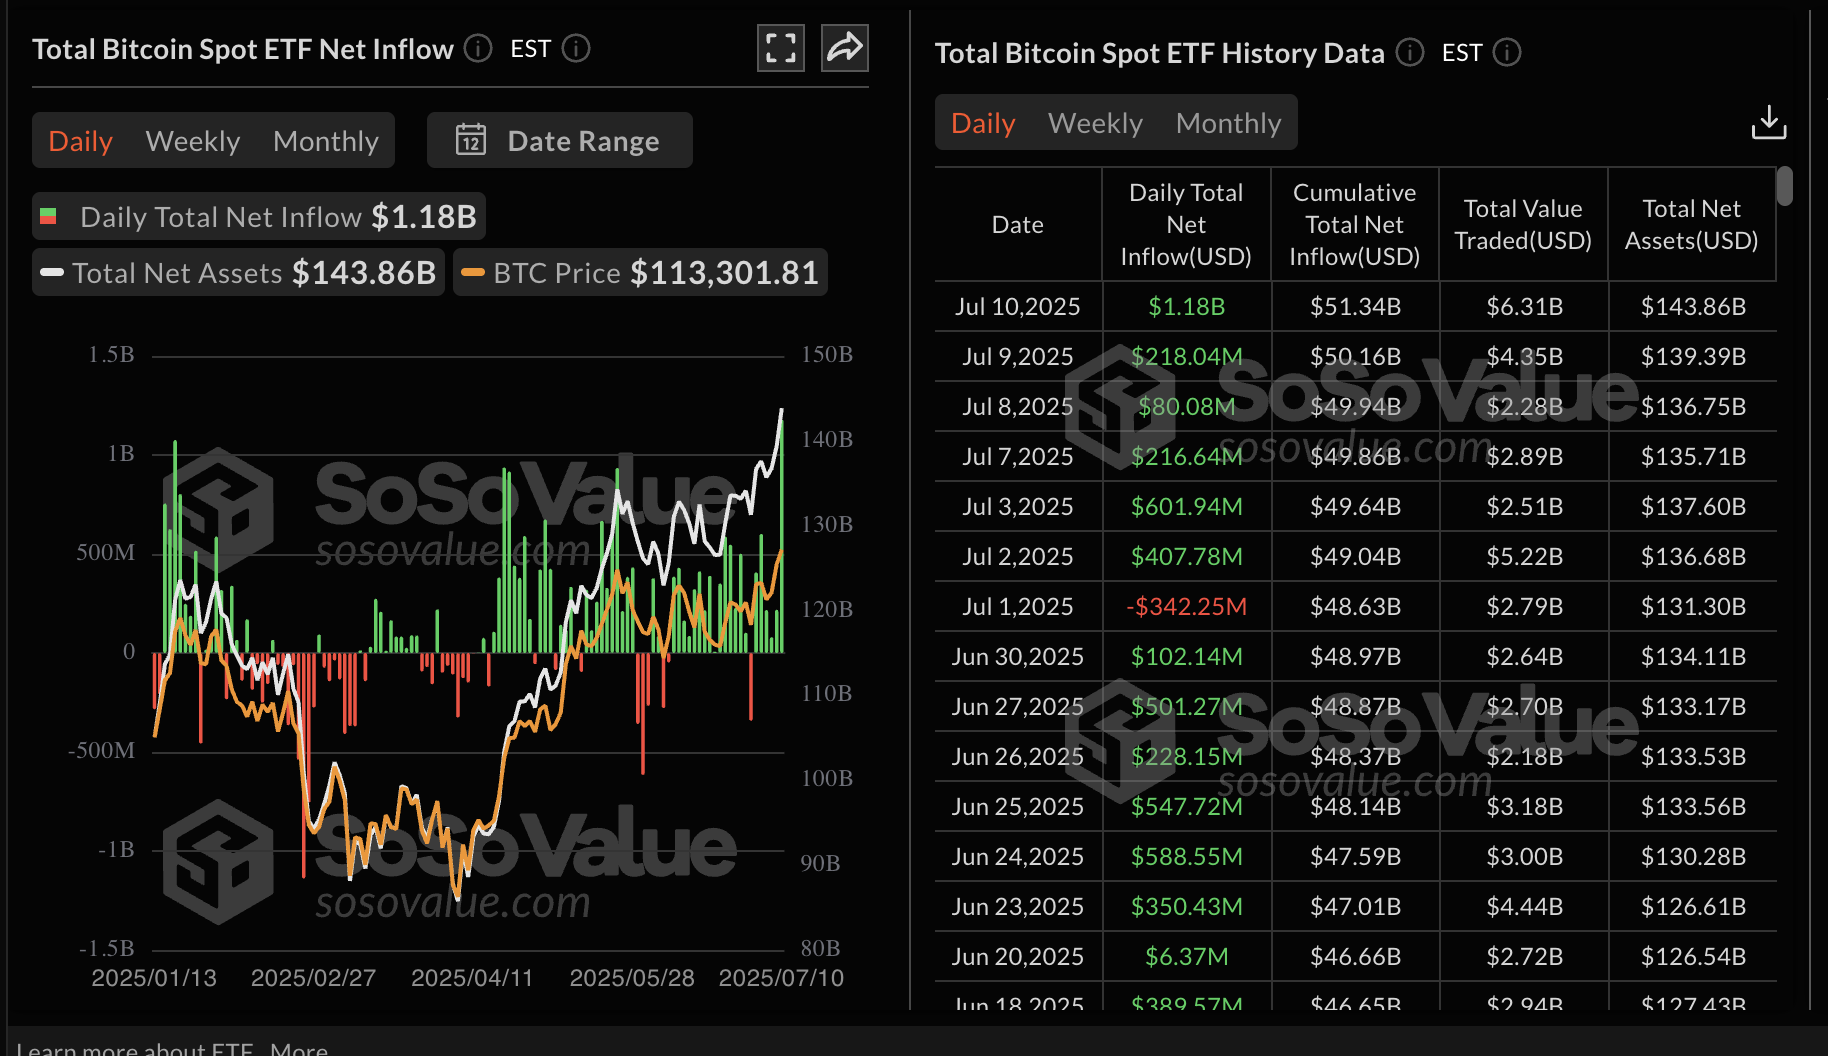
Bitcoin spot ETFs data | Source: SoSoValue
Ethereum spot ETFs, on the other hand, extended the bullish streak, marking the fifth consecutive day of net inflows. SoSoValue data shows that approximately $383 million entered the spot ETFs. This was also the second-largest inflow in the history of US ETH spot ETFs. With the cumulative total inflow currently at $5.1 billion, net assets average $12.50 billion.
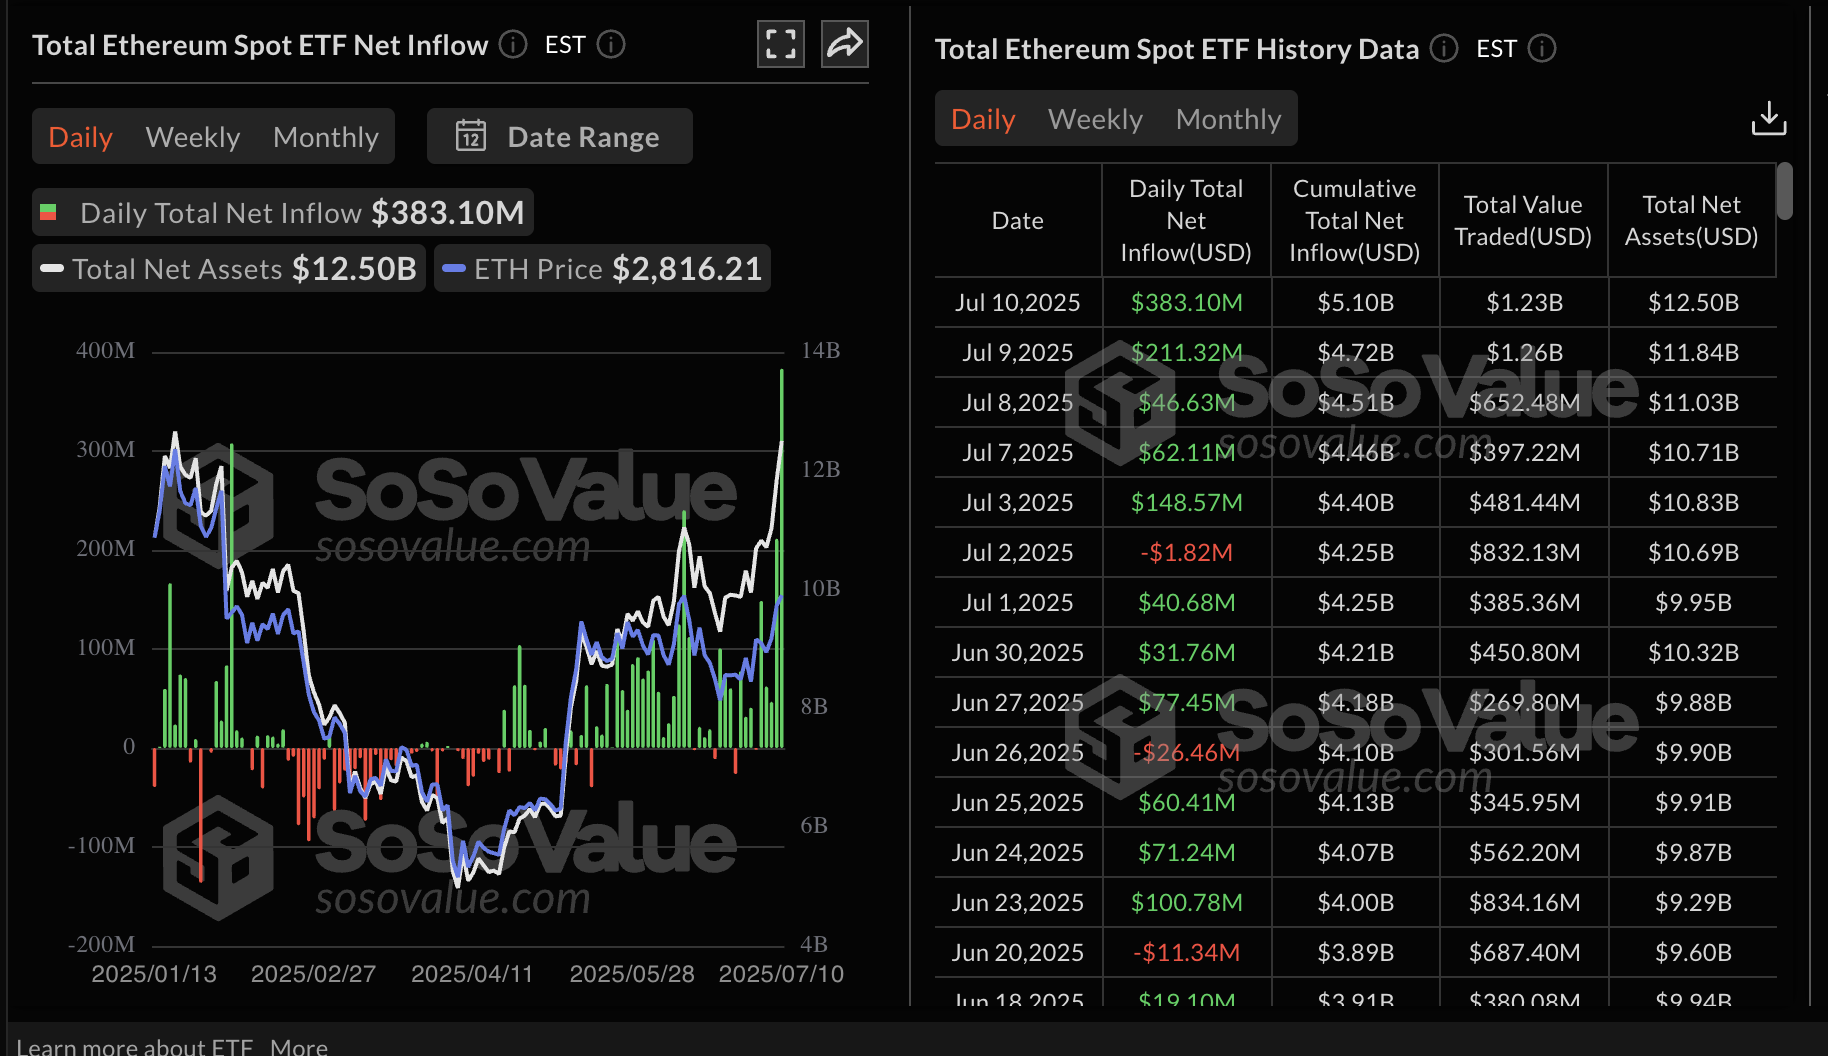
Ethereum spot ETFs data | Source: SoSoValue
Chart of the day: What’s next with Bitcoin at record highs?
Bitcoin price is trading at around $118,152, after almost a 2% increase on the day. The path of least resistance appears upward, with traders looking forward to a close above the $120,000 threshold.
A buy signal from the Moving Average Convergence Divergence (MACD) indicator indicates bullish momentum, encouraging risk-on sentiment.
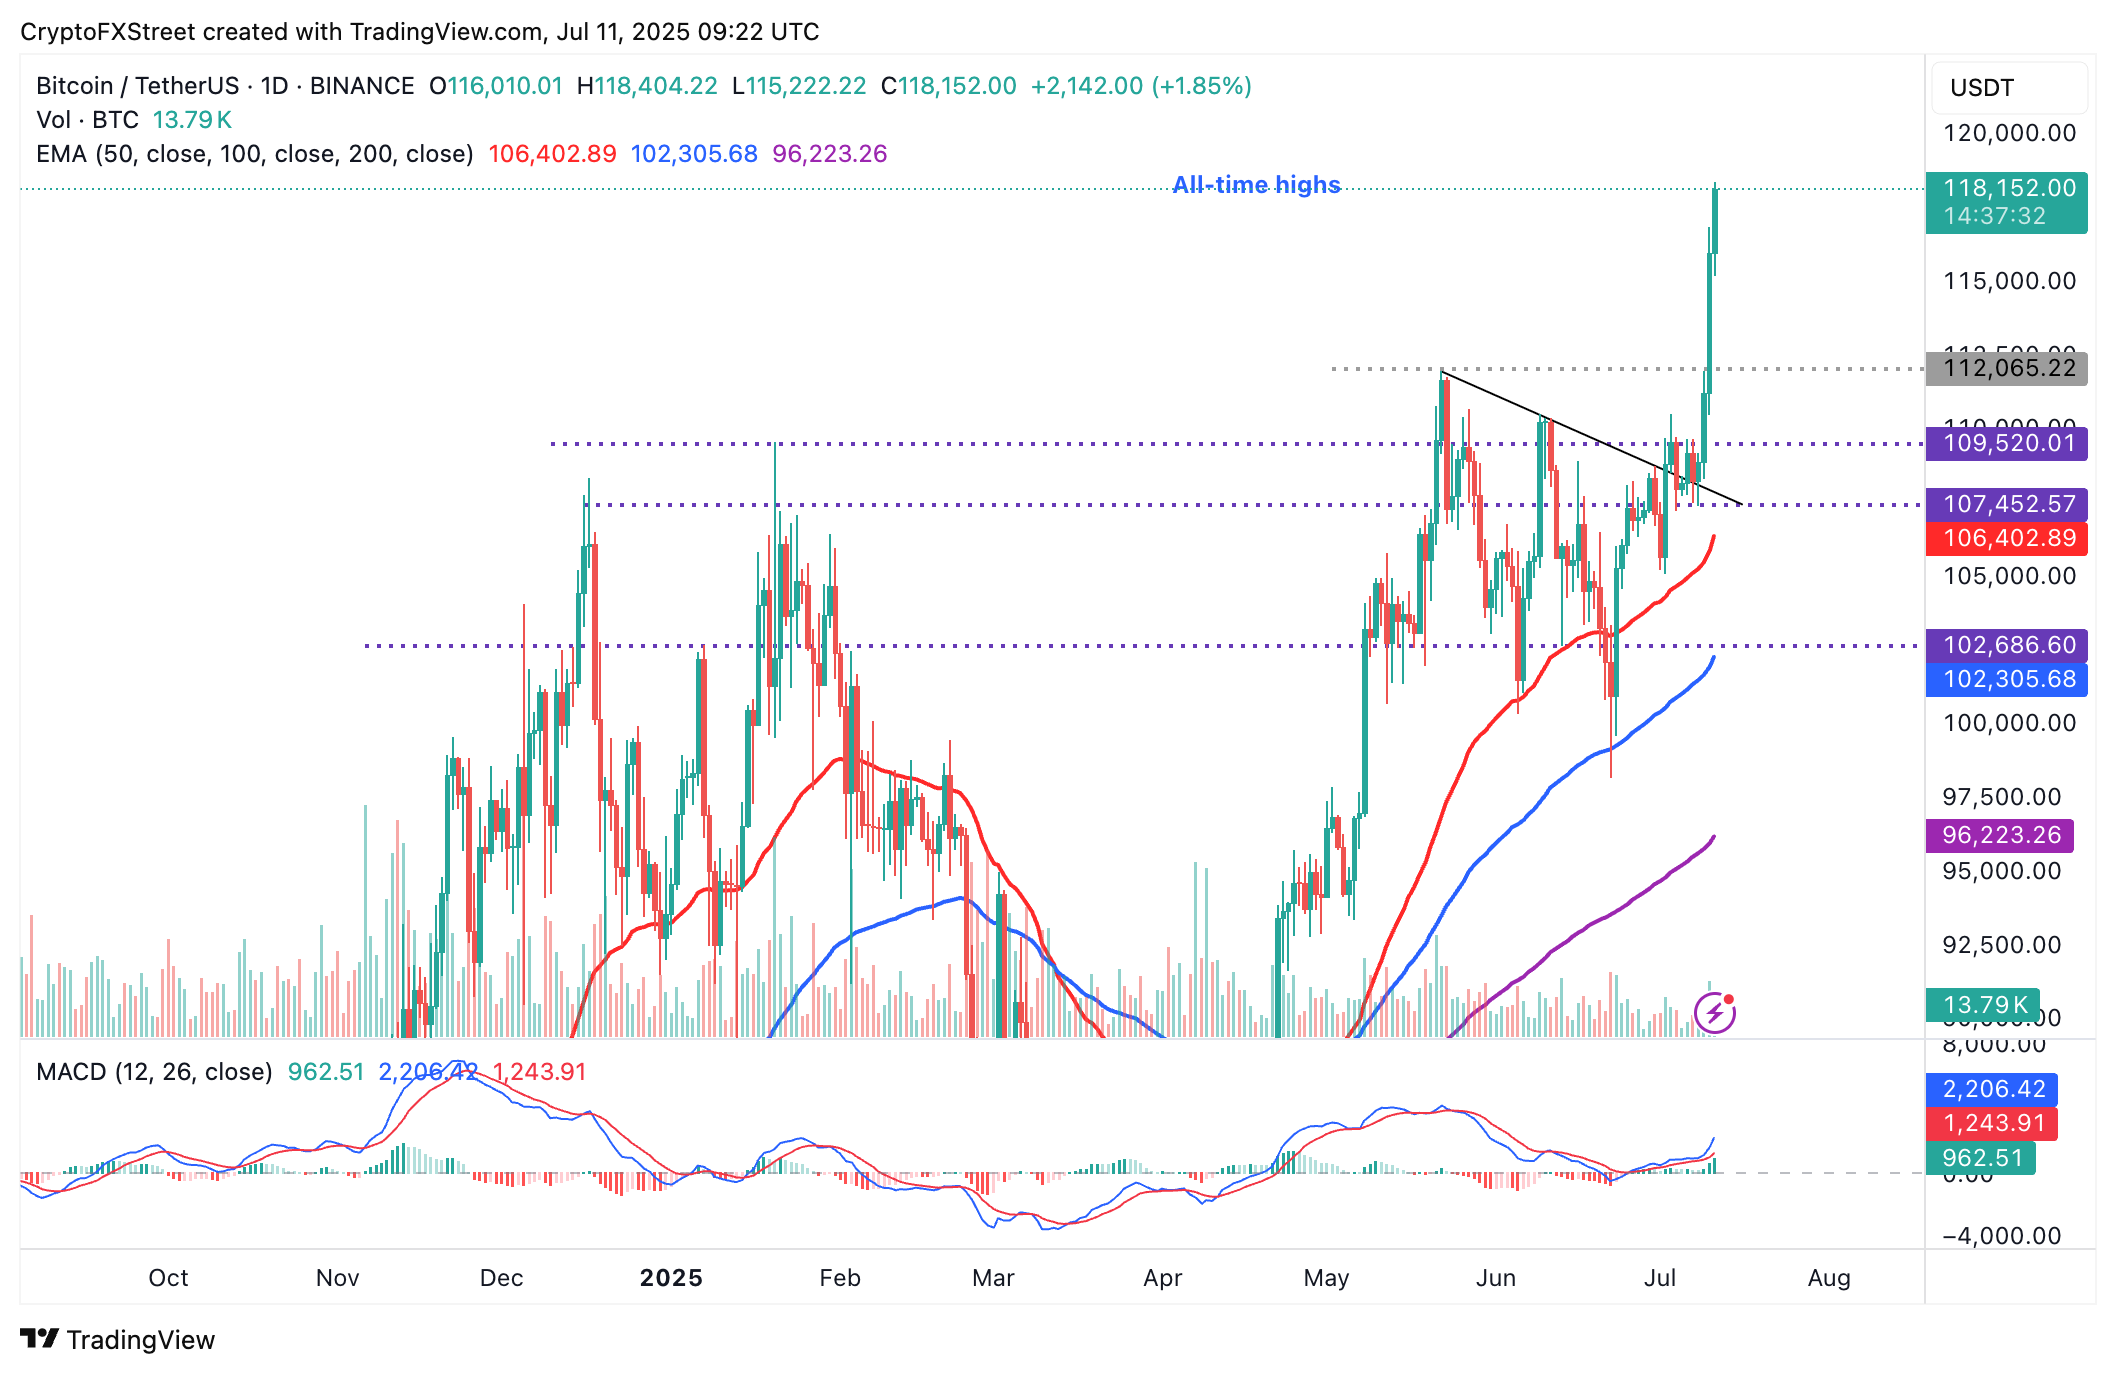
BTC/USDT daily chart
Still, traders should tread with caution as potential profit-taking may result in a sudden trend reversal. Key areas of interest on the downside include the level of $115,112 tested as support earlier on Friday and the previous all-time high at $111,890.
Altcoins update: Ethereum reclaims $3,000 as XRP upholds uptrend
Ethereum has cleared the barrier at $3,000, extending the uptrend to $3,024 at the time of writing. Its technical outlook seems robust, with the MACD indicator flaunting the buy signal triggered on July 2. With interest from institutional investors holding steady, the price of ETH could rally toward key targets at around $3,229, a level that temporarily capped price movement in November, and at $3,530, which acted as support in December.
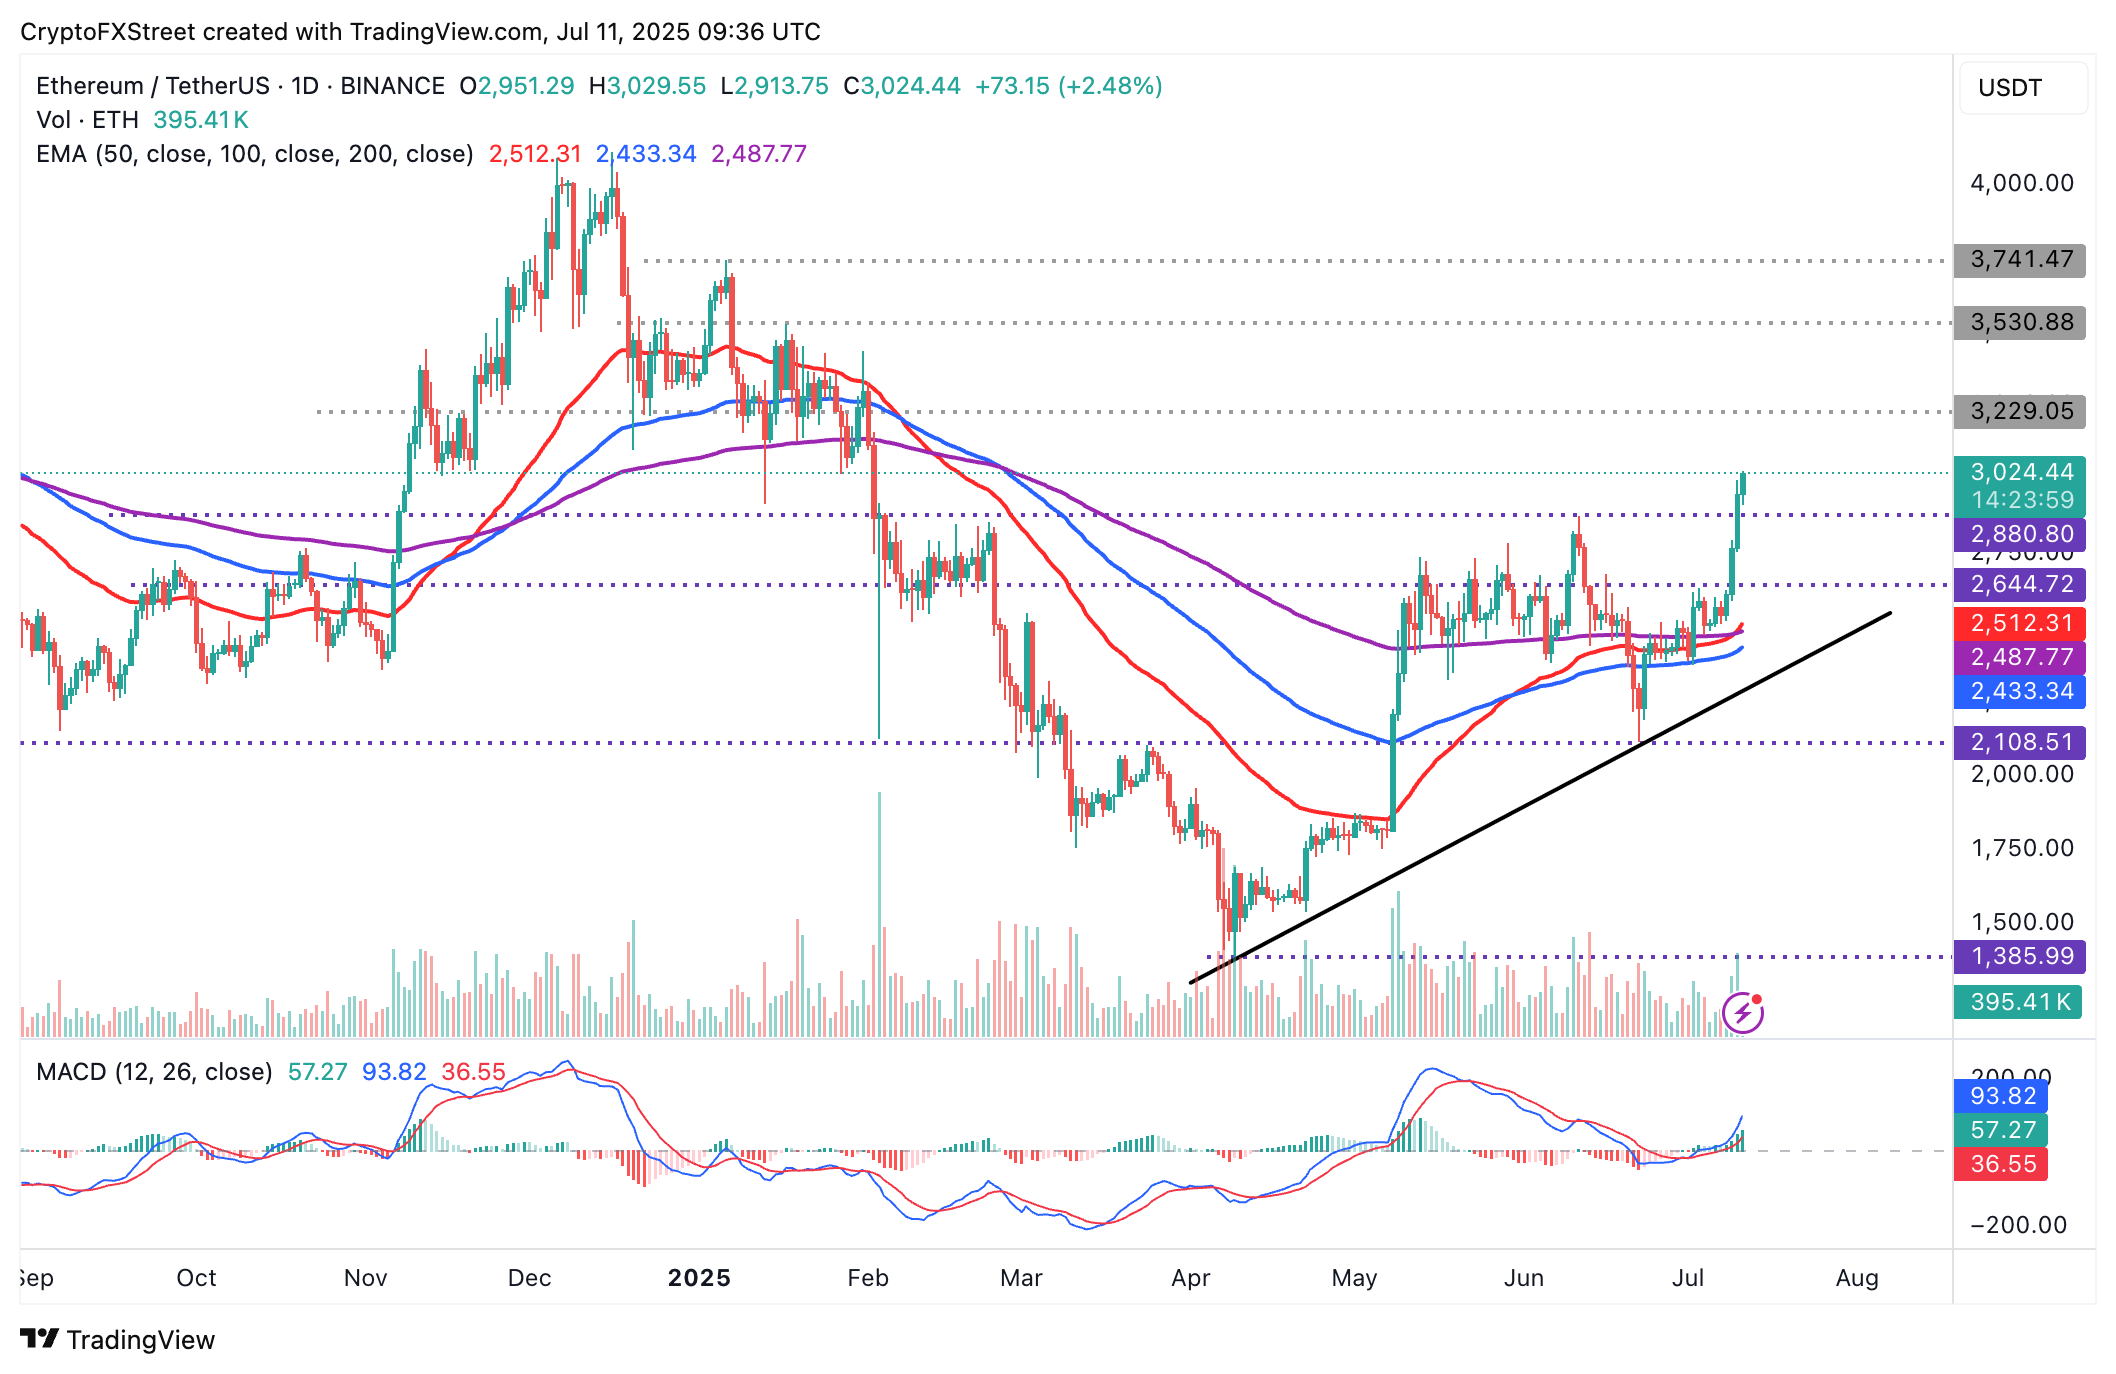
ETH/USD daily chart
As for XRP, bulls have reclaimed support at $2.60, following in Bitcoin’s footsteps. Interest in the cross-border token remains steady, with traders seeking exposure and betting on a breakout above the coveted psychological resistance at $3.00.
The Money FLOW Index (MFI), which tracks the amount of money entering XRP, is steadily rising, now in overbought territory. This suggests that buyers could continue having the upper hand.
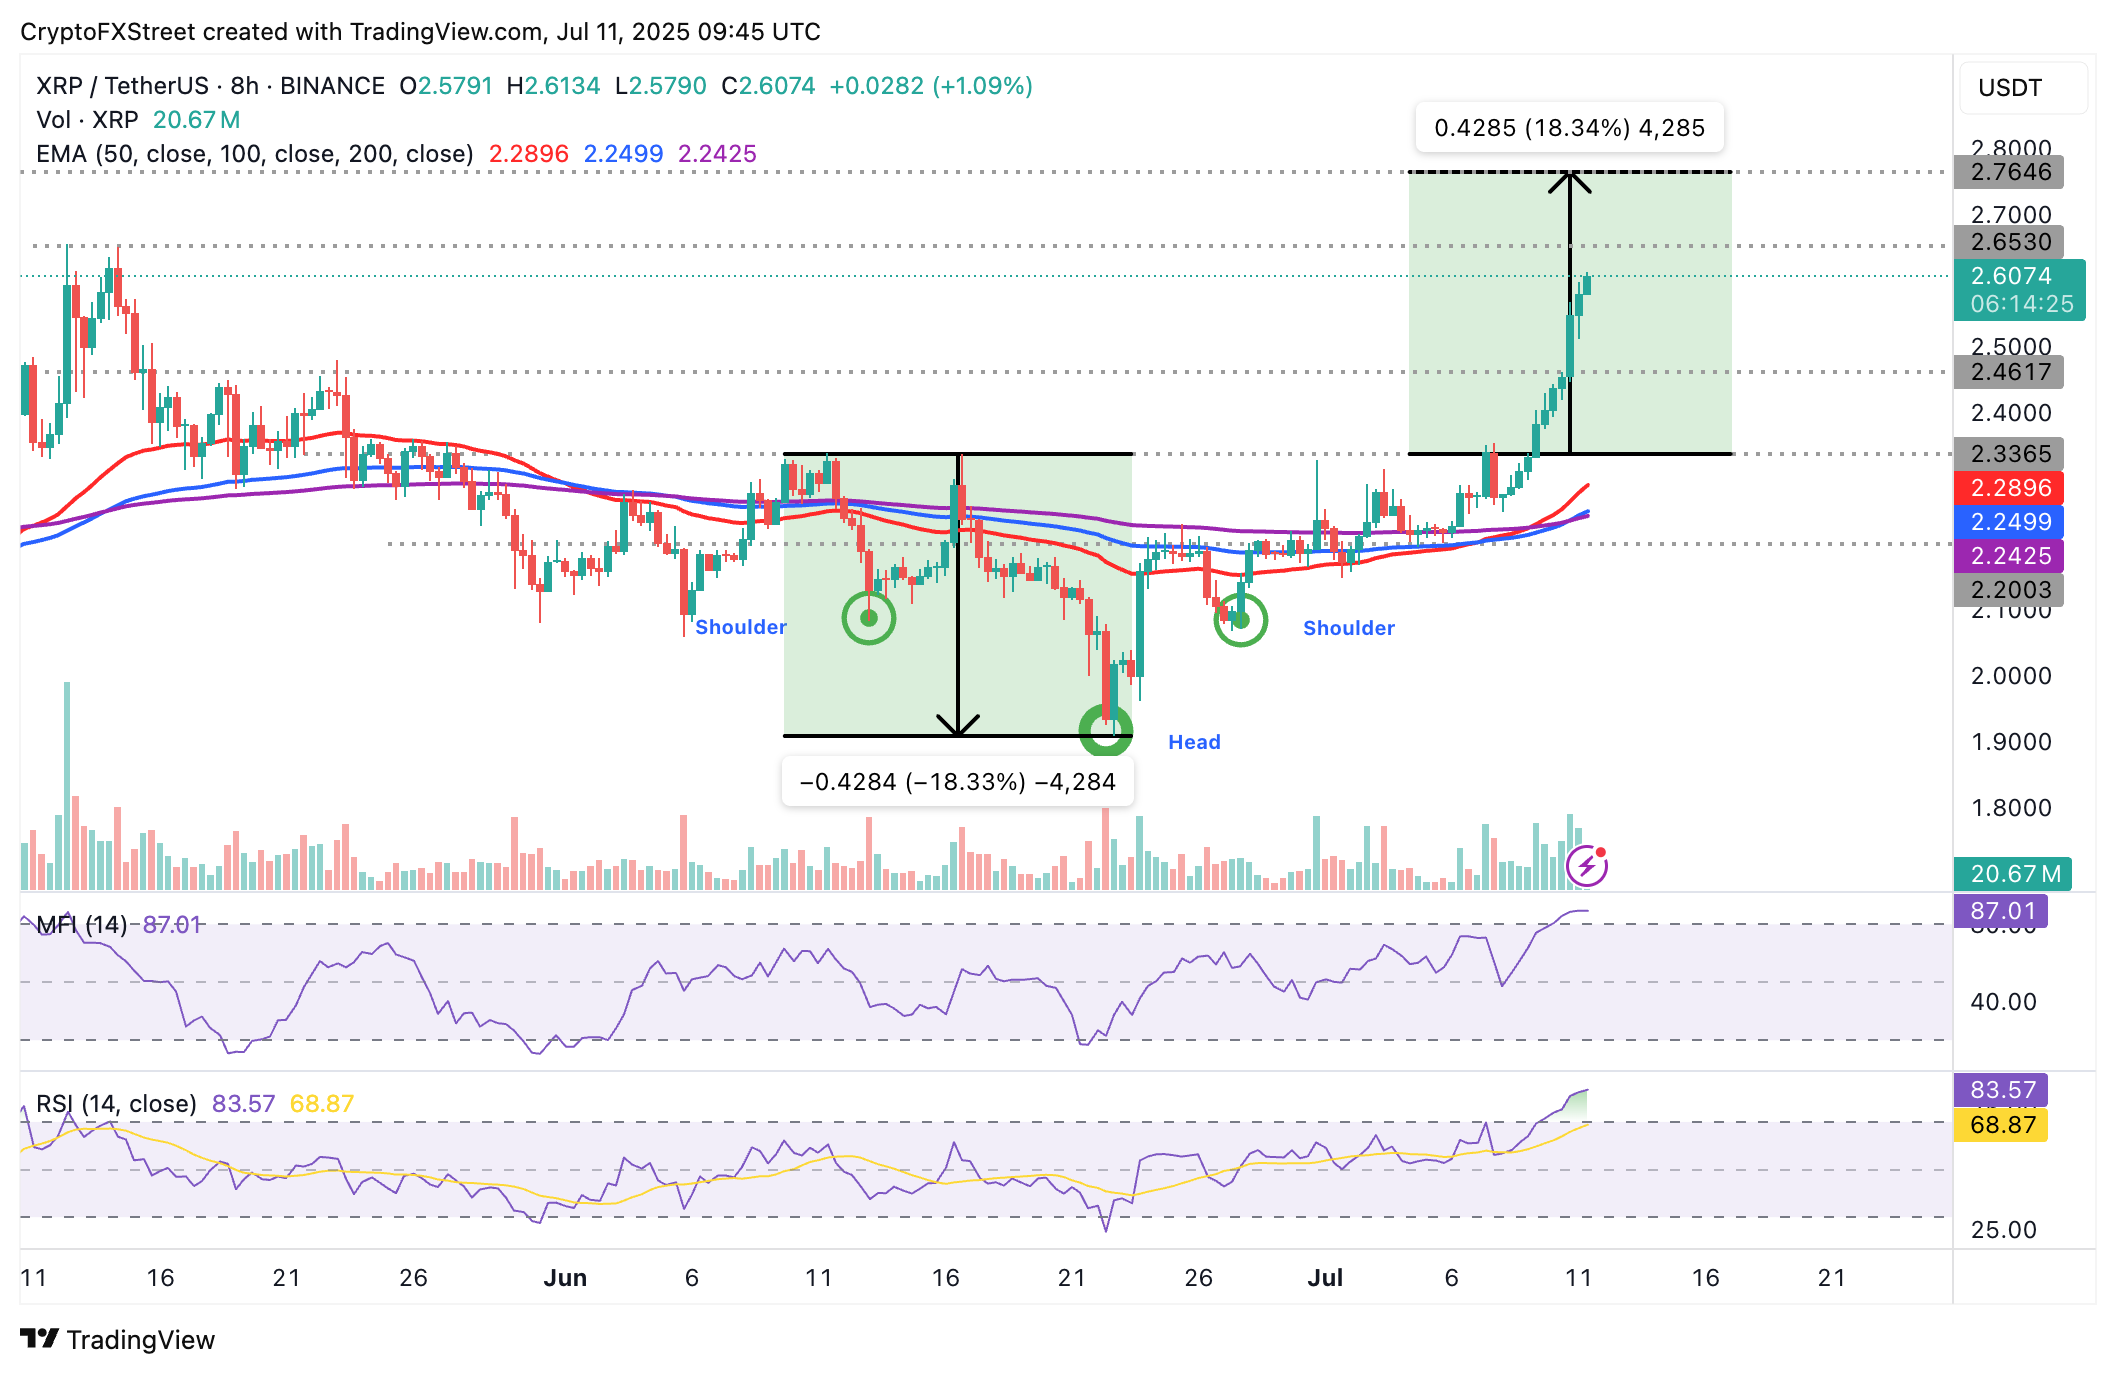
XRP/USDT 8-hour chart
Despite the seemingly bullish outlook, the Relative Strength Index (RSI) overbought at 83 hints at a potential pullback as investors could opt to sell to take profits. While a breakout to $2.76 is likely in upcoming sessions, it may be prudent to prepare for the possibility of a reversal toward the 50-period Exponential Moving Average (EMA) at $2.28 on the 8-hour chart.
Cryptocurrency metrics FAQs
What is circulating supply?
The developer or creator of each cryptocurrency decides on the total number of tokens that can be minted or issued. Only a certain number of these assets can be minted by mining, staking or other mechanisms. This is defined by the algorithm of the underlying blockchain technology. On the other hand, circulating supply can also be decreased via actions such as burning tokens, or mistakenly sending assets to addresses of other incompatible blockchains.
What is market capitalization?
Market capitalization is the result of multiplying the circulating supply of a certain asset by the asset’s current market value.
What is trading volume?
Trading volume refers to the total number of tokens for a specific asset that has been transacted or exchanged between buyers and sellers within set trading hours, for example, 24 hours. It is used to gauge market sentiment, this metric combines all volumes on centralized exchanges and decentralized exchanges. Increasing trading volume often denotes the demand for a certain asset as more people are buying and selling the cryptocurrency.
What is the funding rate?
Funding rates are a concept designed to encourage traders to take positions and ensure perpetual contract prices match spot markets. It defines a mechanism by exchanges to ensure that future prices and index prices periodic payments regularly converge. When the funding rate is positive, the price of the perpetual contract is higher than the mark price. This means traders who are bullish and have opened long positions pay traders who are in short positions. On the other hand, a negative funding rate means perpetual prices are below the mark price, and hence traders with short positions pay traders who have opened long positions.
