Cardano (ADA) Primed for Explosive Rally as Bitcoin Shatters All-Time Highs

Bitcoin's record-breaking surge ignites altcoin season—and Cardano's ADA is flashing bullish signals.
The Domino Effect
When BTC rallies, capital rotates. ADA's tight correlation with Bitcoin's movements suggests an impending breakout as traders chase higher beta plays.
Technical Tailwinds
Cardano's chart shows a textbook accumulation pattern. The 20-day moving average just crossed above the 50-day—a classic 'golden cross' that historically precedes major runs.
The Institutional Angle
With Grayscale's ADA trust trading at a 12% premium, smart money's already positioning for the next leg up. Retail FOMO hasn't even started yet.
The Cynic's Corner
Of course, this could all be another 'number go up' illusion—Wall Street's favorite parlour trick since the invention of fractional reserve banking.
Cardano’s derivatives data show a bullish bias
CoinGlass derivatives data for Cardano shows a bullish picture. The open interest for ADA has increased by 13.66% over the last 24 hours, reaching $970.59 million. An increasing OI represents new or additional money entering the market and new buying, which could fuel the current ADA price rally.
The rising Optimism in Cardano has triggered a wave of liquidations of nearly $4.10 million in the last 24 hours, with $3.8 million of these being short positions. With the wipeout of massive short positions, the long-to-short ratio for ADA reads 1.03 on Thursday. This ratio, above one, reflects bullish sentiment in the markets, as more traders are betting on the asset price to rally.

Cardano derivatives data chart. Source: Coinglass
Cardano Price Forecast: ADA breaks above a bullish reversal pattern
Cardano price broke above the upper resistance trendline of a falling wedge pattern on Wednesday. This pattern is formed by connecting multiple highs and lows with two trendlines from early May. At the time of writing on Thursday, it trades slightly down after retesting its 50-day Exponential Moving Average (EMA) at $0.62.
If ADA closes above its 50-day EMA at $0.62 on a daily basis, it could extend the rally toward its June 11 high of $0.73.
The Relative Strength Index (RSI) on the daily chart reads 54 and points upwards, indicating that bullish momentum is gaining traction. Additionally, the Moving Average Convergence Divergence (MACD) indicator showed a bullish crossover on June 29. It also shows rising green histogram bars above its neutral zero line, suggesting bullish momentum is gaining traction and continuing an upward trend.
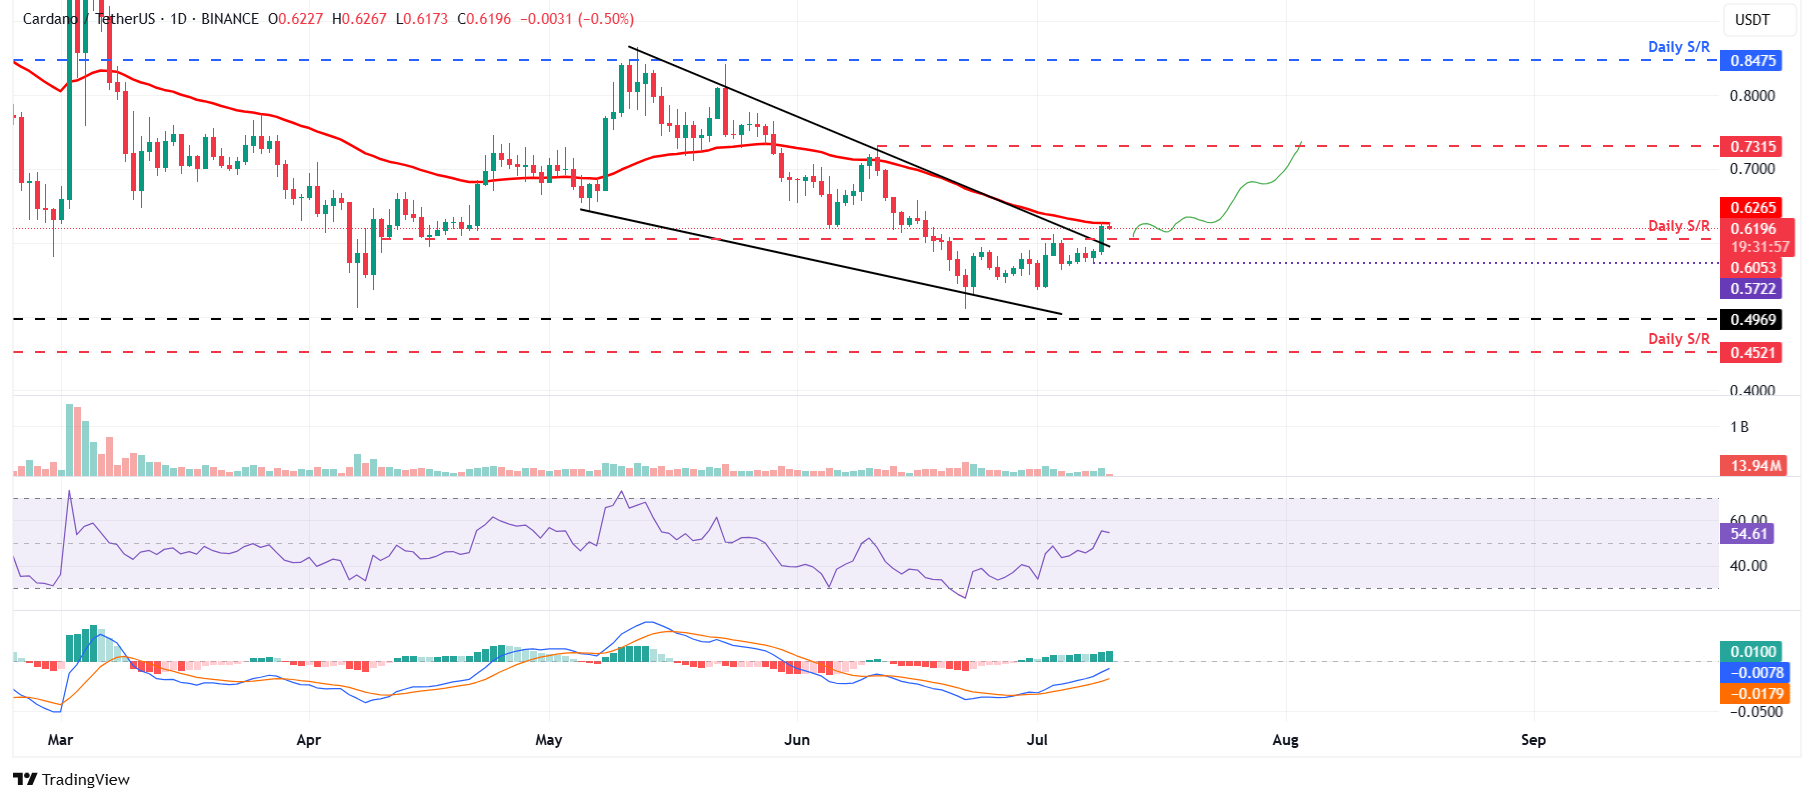
ADA/USDT daily chart
However, if ADA faces a correction and closes below $0.60, the daily support level, it could extend the decline toward Tuesday's low at $0.57.

Log in to Reply
Log in to comment your thoughtsComments
Related Articles
|Square
Get the BTCC app to start your crypto journey
Get started today Scan to join our 100M+ users