DOGE & SHIB Ready to Moon? Bullish Bets and Holder Accumulation Signal Meme Coin Rally

Dogecoin and Shiba Inu are barking up the right tree—whale wallets are loading up while derivatives traders pile into long positions. The meme coin duo shows classic signs of a liquidity squeeze in the making.
When dog coins wag the market
Retail FOMO meets institutional-grade accumulation patterns. DOGE’s 30-day holder growth outpaces BTC’s, while SHIB’s burn rate hits its highest level since the 2021 mania. Neither fundamentals nor utility required—just pure, uncut speculative momentum.
The cynical take? Another proof that markets will rally behind literally anything—even JPEGs of dogs—when liquidity’s sloshing around. But for degens riding the wave? Woof.
DOGE and SHIB could rally as derivative data and on-chain metrics hint at a bullish bias
According to Coinglass’s data, the long-to-short ratio of dog-themed memecoins DOGE and SHIB reads 1.10 and 1.08, respectively. This ratio, above one, reflects bullish sentiment in the markets, as more traders are betting on the memecoinss to rally.
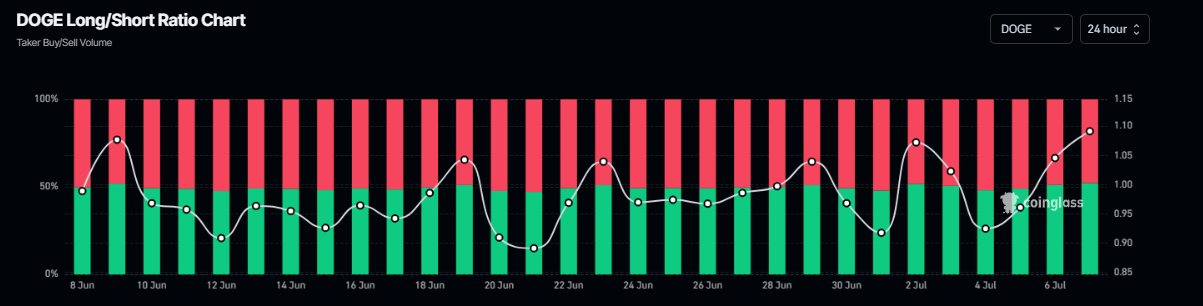
DOGE long-to-short ratio chart. Source: Coinglass
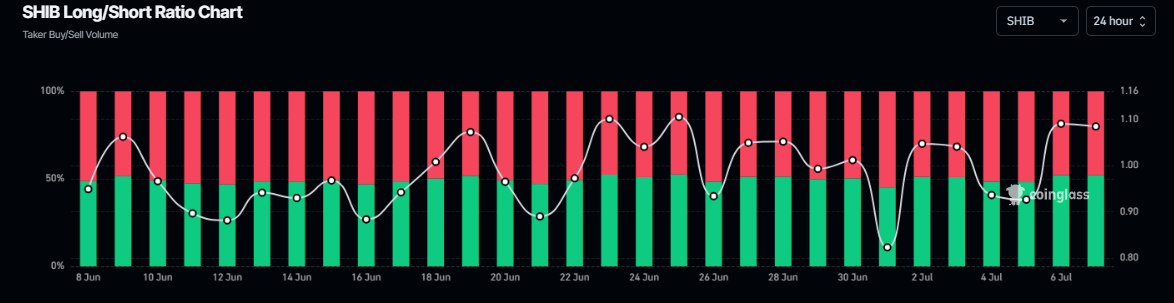
SHIB long-to-short ratio chart. Source: Coinglass
Santiment’s Supply Distribution shows that the number of large-wallet holders is rising for both dog-theme-based memecoins. The metric indicates that the whales holding between 100,000 and 1 million (red line) and between 1 million and 10 million (yellow line) for SHIB and Doge tokens have been increasing since last week, further supporting the bullish outlook.
%20%5B10-1751867968164.02.37,%2007%20Jul,%202025%5D.png)
Dogecoin Supply distribution chart. Source: Santiment
%20%5B11-1751867994922.09.12,%2007%20Jul,%202025%5D.png)
Shiba Inu Supply distribution chart. Source: Santiment
Dogecoin Price Forecast: DOGE bulls in control of momentum
Dogecoin price rebounded after retesting its previously broken descending trendline (drawn by connecting multiple highs since May 23) around $0.15 on Wednesday and rallied 9.8% until Sunday. At the time of writing on Monday, it trades at around $0.17.
If DOGE continues its upward trend and closes above the weekly resistance at $0.18 on a daily basis, it could extend the rally to retest its June 11 high of $0.20.
The Relative Strength Index (RSI) on the daily chart stands at 51, having moved above its neutral level of 50, indicating indecision among investors. The Moving Average Convergence Divergence (MACD) indicator also displayed a bullish crossover last week. It also shows a rising green histogram bar above its neutral level, indicating bullish momentum and an upward trend.
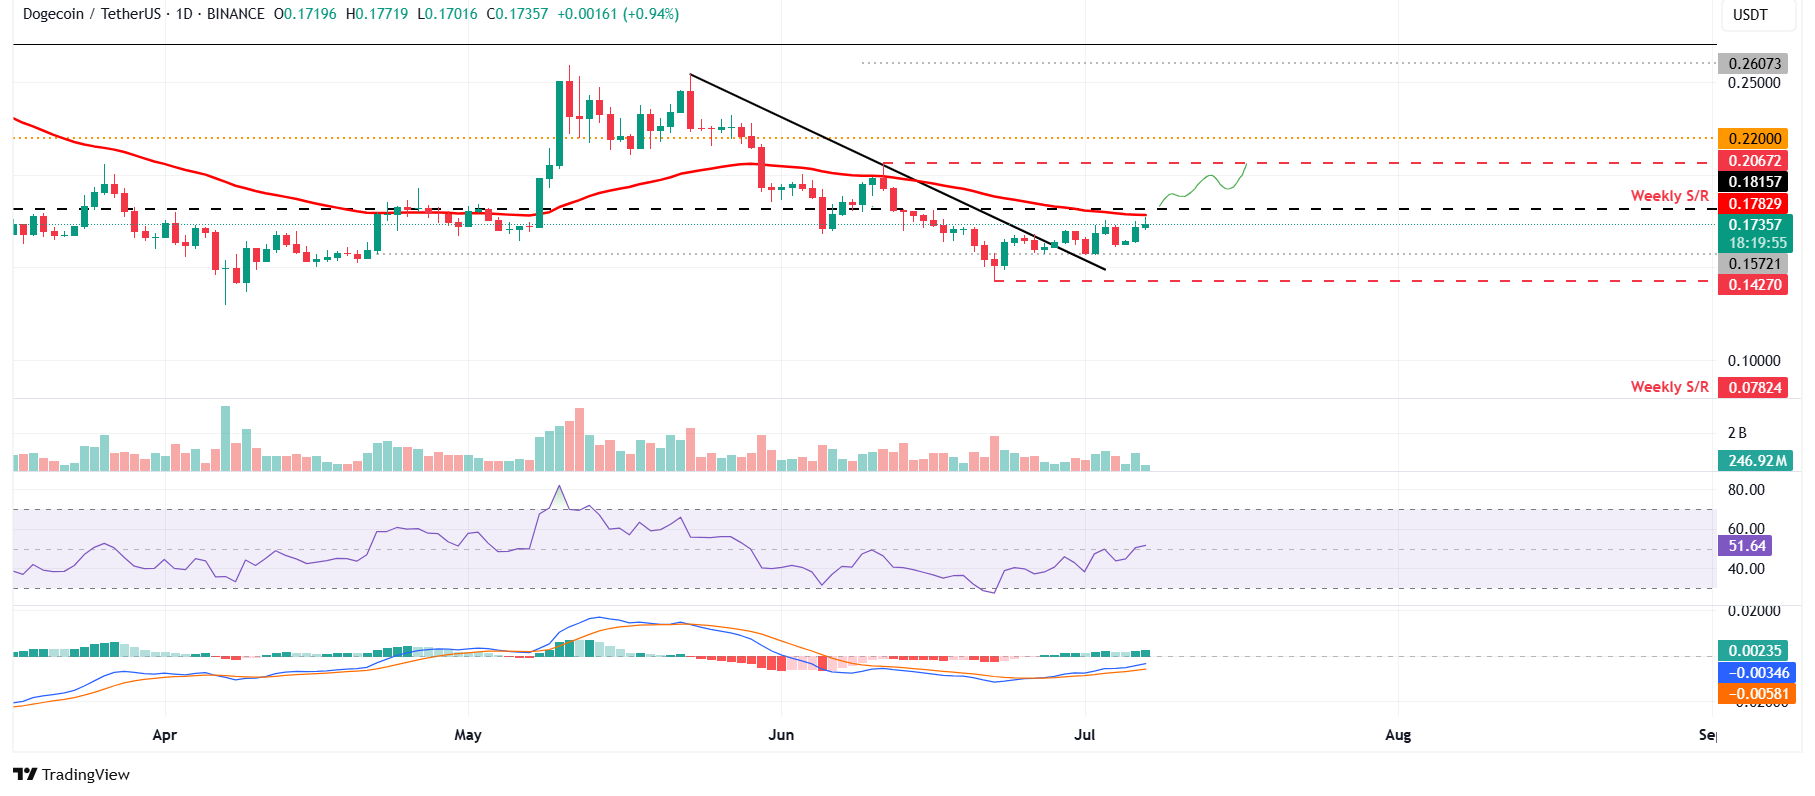
DOGE/USDT daily chart
However, if DOGE faces a correction, it could extend the decline to retest its trendline support level at $0.15.
Shiba Inu Price Forecast: SHIB could rally if it closes above the 50-day EMA
Shiba Inu price broke above the descending trendline (drawn by connecting multiple highs since mid-May) on June 28. Still, it consolidated between the daily level at $0.0000111 and below the 50-day EMA at $0.0000123 last week. It edges slightly lower on Monday, hovering around $0.0000118 at the time of writing.
If SHIB rallies and closes above its 50-day EMA at $0.0000123 on a daily basis, it could extend the rally toward its June 11 high of $0.0000136.
The RSI on the daily chart stands at 49, hovering around its neutral level of 50, which indicates indecisiveness among traders. For the bullish momentum to be sustained, the RSI must MOVE above its neutral level of 50. The MACD indicator displayed a bullish crossover last week. It also shows a rising green histogram bar above its neutral level, indicating bullish momentum and an upward trend.
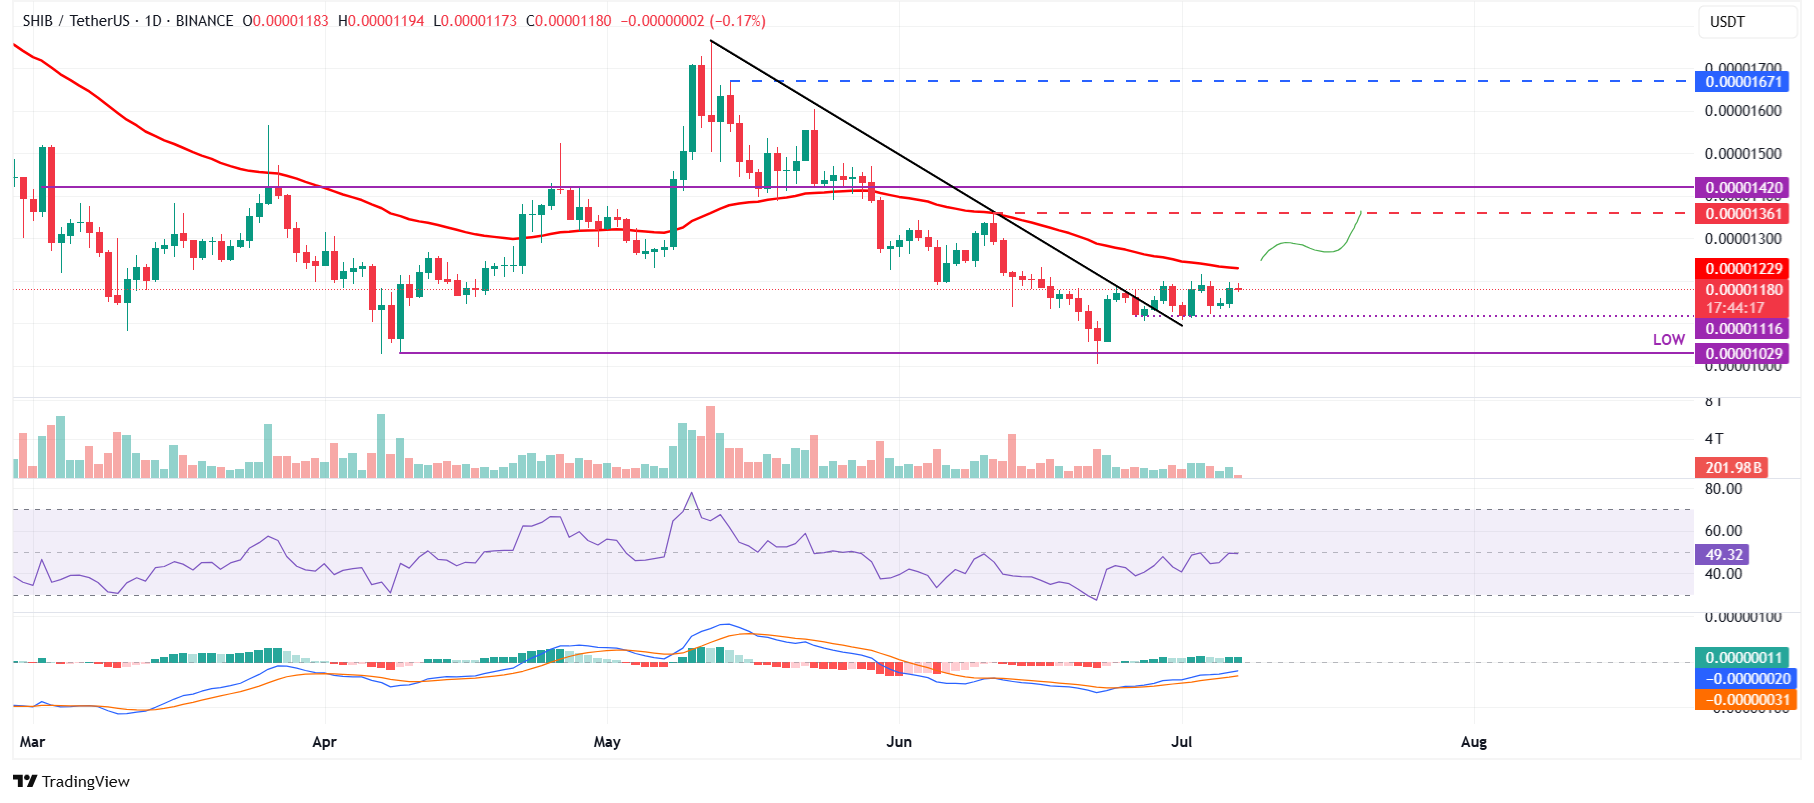
SHIB/USDT daily chart
On the other hand, if SHIB faces a correction, it could extend the decline to find support around its daily level at $0.0000111.
