Cardano Price Surge: Bulls Charge as 2.34B ADA Flips to Profit – What’s Next?

Cardano’s bulls are back in the driver’s seat—and they’re not slowing down. With 2.34 billion ADA now in the green, the stage is set for a potential breakout. Here’s why traders are betting big.
### The Profit Paradigm
When this much supply flips profitable, history suggests momentum isn’t done yet. Cardano’s network metrics whisper ‘accumulation season’—while skeptics mutter about bagholders waiting for their exit liquidity. Classic crypto.
### The Technical Take
Key resistance levels are crumbling faster than a Bitcoin maximalist’s arguments in 2025. If ADA holds above critical support, the next leg up could send shockwaves through altcoin portfolios.
### The Bottom Line
This isn’t just hopium—it’s math. But remember: in crypto, ‘number go up’ works until it doesn’t. Trade accordingly.
Rising Cardano supply in profit adds 2.34 billion ADA in July
Santiment’s data shows the cardano supply in profit reaching 18.23 billion ADA on Friday, up from 15.89 billion ADA on Tuesday. The increase of 2.34 billion ADA supply in profit so far in July aligns with the weekly recovery and could increase the buying pressure.
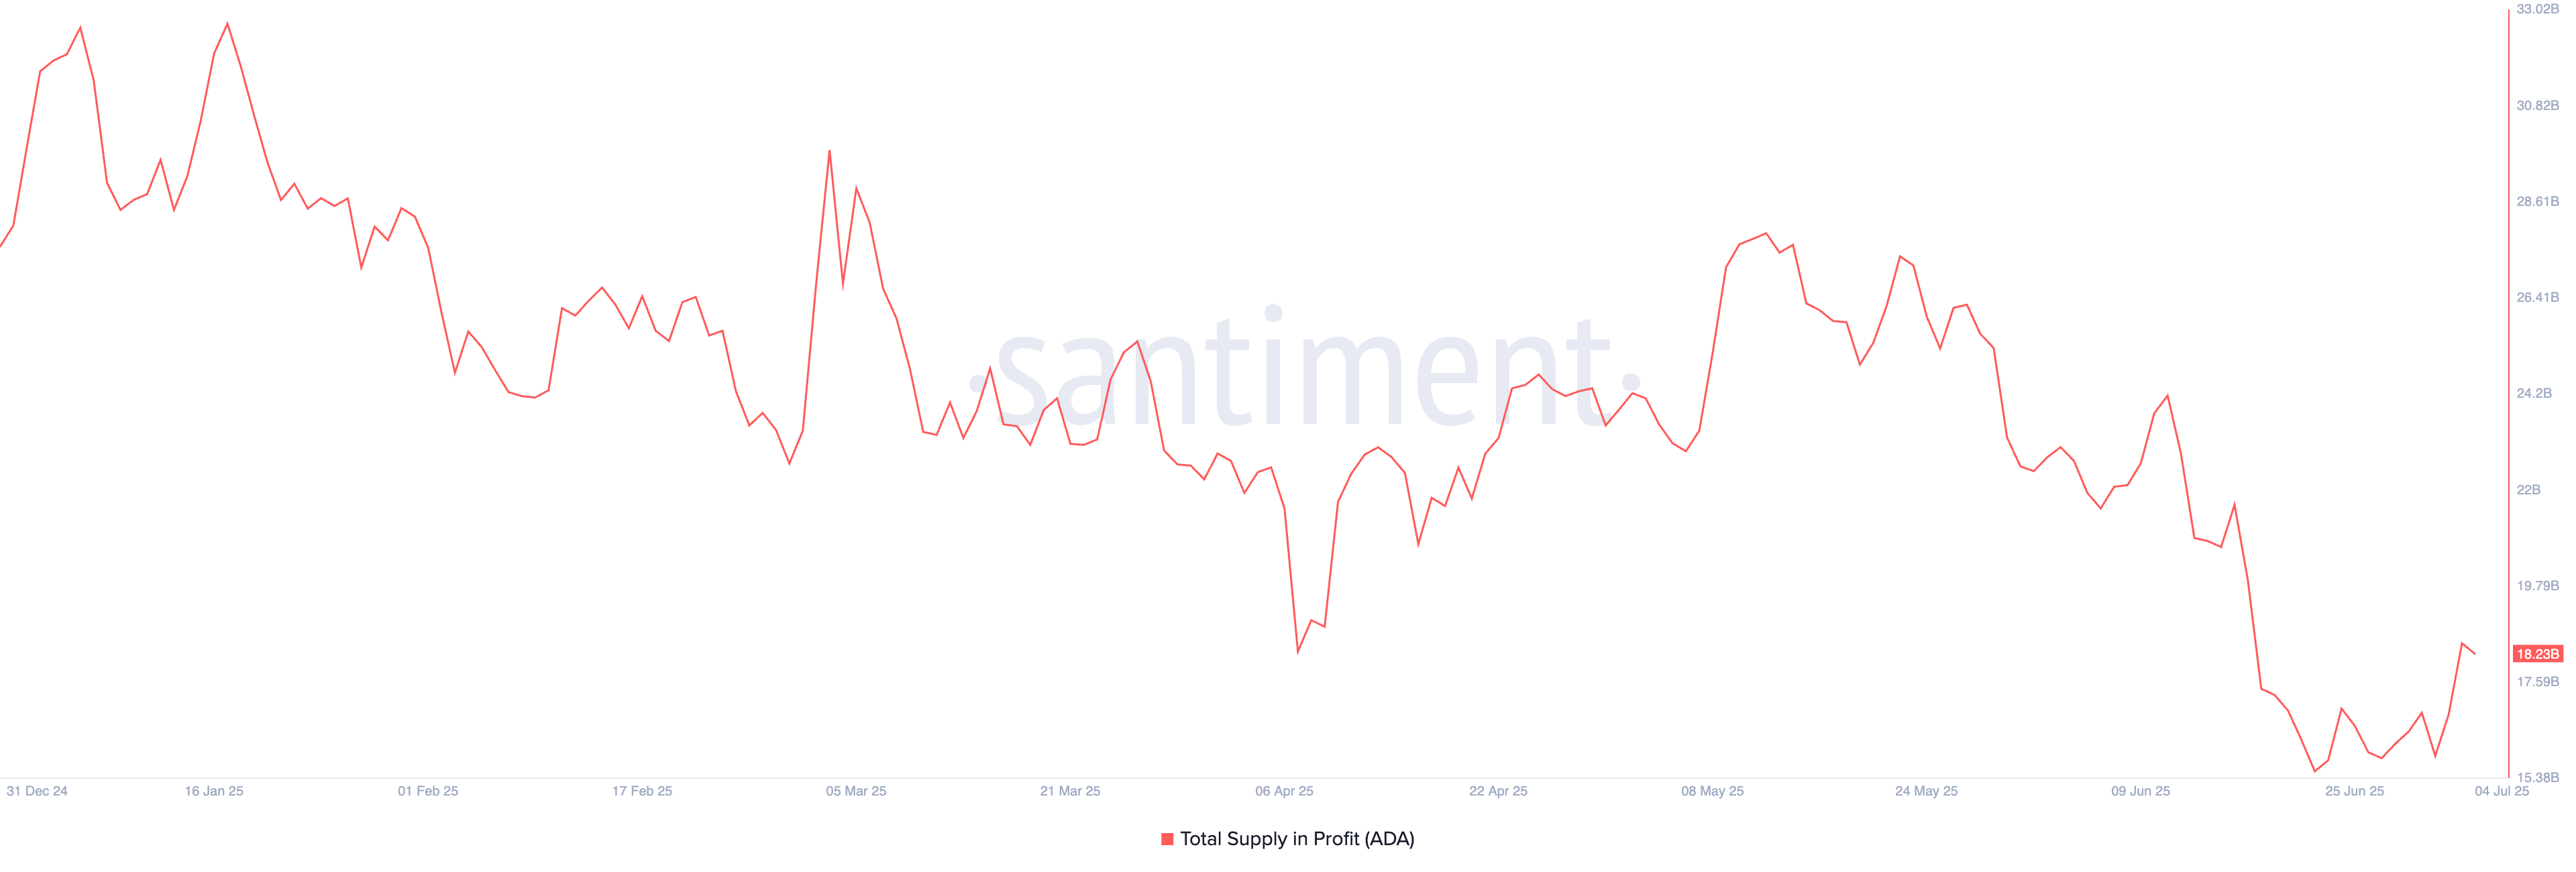
Cardano total supply in profit. Source: Santiment
The supply in profit represents the tokens acquired or last moved at a price lower than the market price. However, a significant increase poses the risk of potential profit booking.
Cardano eyes channel breakout, targeting $0.71
Cardano loses steam after posting 10% gains in the last two days, resulting in a pullback of over 1% at the time of writing on Friday. Thursday’s high of $0.6119, before closing at $0.5992, indicates an overhead supply outgrowing demand.
A resistance trendline formed by connecting the highs of May 23 and June 10, coupled with a parallel support trendline by connecting May 19 and June 5 lows, forms a falling channel pattern. Cardano floats NEAR the resistance trendline with the intraday pullback, struggling for a decisive bullish close to signal a breakout.
If ADA holds a bullish close to the day, the uptrend could target the May 19 low at $0.7100.
The technical indicators provide mixed signals, as the Moving Average Convergence/Divergence (MACD) indicator displays a surge in green bars from the zero line, suggesting the trend momentum is shifting bullish. However, the MACD and signal line remain DEEP in the negative zone, indicating room for growth before turning into a flashing trend reversal signal.
The Relative Strength Index (RSI) at 47 reverts from the halfway line, reflecting a struggle to regain bullish momentum.
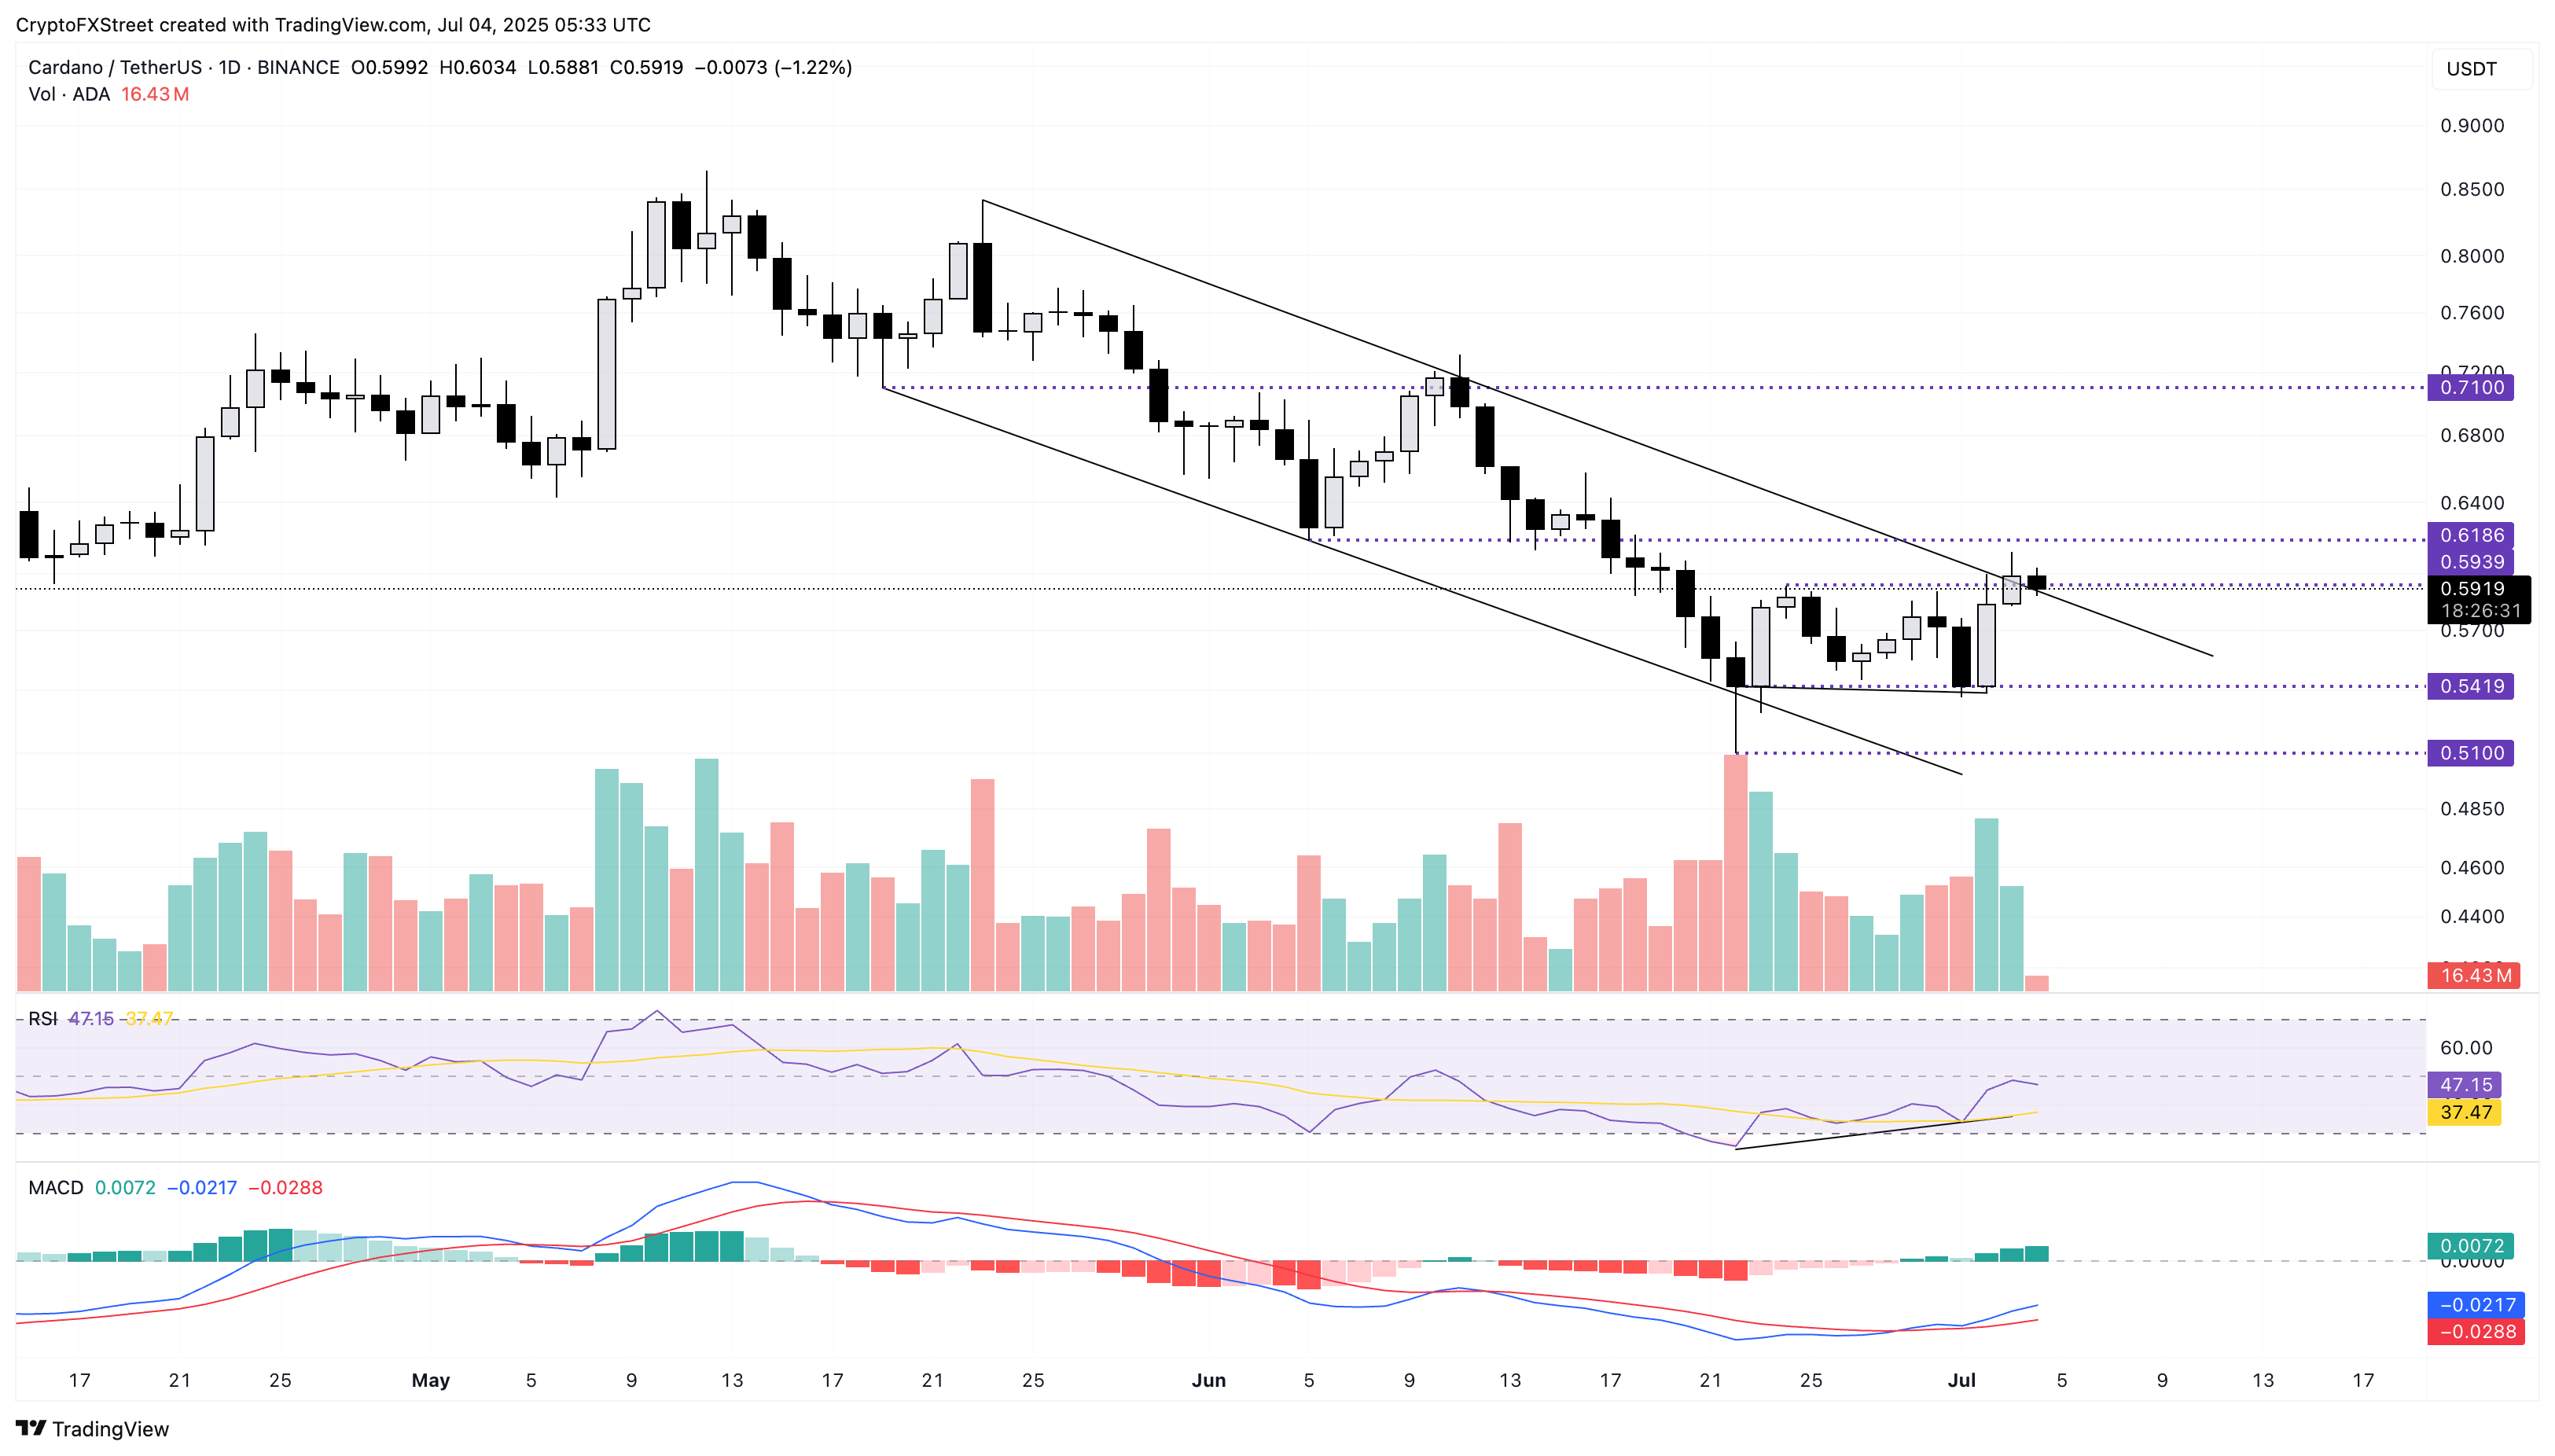
ADA/USDT daily price chart.
On the downside, if ADA marks a daily close below Thursday’s opening price of $0.5840, it could decline towards the $0.5419 support marked by the June 22 daily close.

Log in to Reply
Log in to comment your thoughtsComments
Related Articles
|Square
Get the BTCC app to start your crypto journey
Get started today Scan to join our 100M+ users