BNB Price Surge Ahead? Maxwell Hardfork Upgrade Fuels Bullish Momentum

BNB's latest tech leap sends traders scrambling. The Maxwell hardfork isn't just another update—it's a turbocharge for the blockchain's capabilities. Here's why the charts might start looking very interesting.
Speed, efficiency, and lower costs—the holy trinity of blockchain upgrades. BNB's developers just dropped all three into the ecosystem with surgical precision. Market makers are already recalculating their positions.
Meanwhile, Wall Street still can't decide whether crypto is a scam or the future. Good thing decentralized networks don't wait for permission to innovate.
With institutional money quietly stacking positions, this upgrade could be the catalyst that pushes BNB past previous resistance levels. Just don't tell the 'efficient markets' academics—they're still writing papers about how this isn't supposed to happen.
BNB Chain completes Maxwell hardfork upgrade
BNB Chain announced on Monday that its Maxwell hardfork is complete. This major upgrade to the BNB Smart Chain reduces block times from 1.5 seconds to 0.75 seconds, improving network responsiveness, transaction speed, and validator performance. Additionally, fast finality is also achievable in ~1.875 seconds, improving confirmation time and consistency.
A review of the BscScan data shows a bullish outlook. The overview statistics for BSC show that new addresses, transactions, and network utilization have increased following the upgrade.
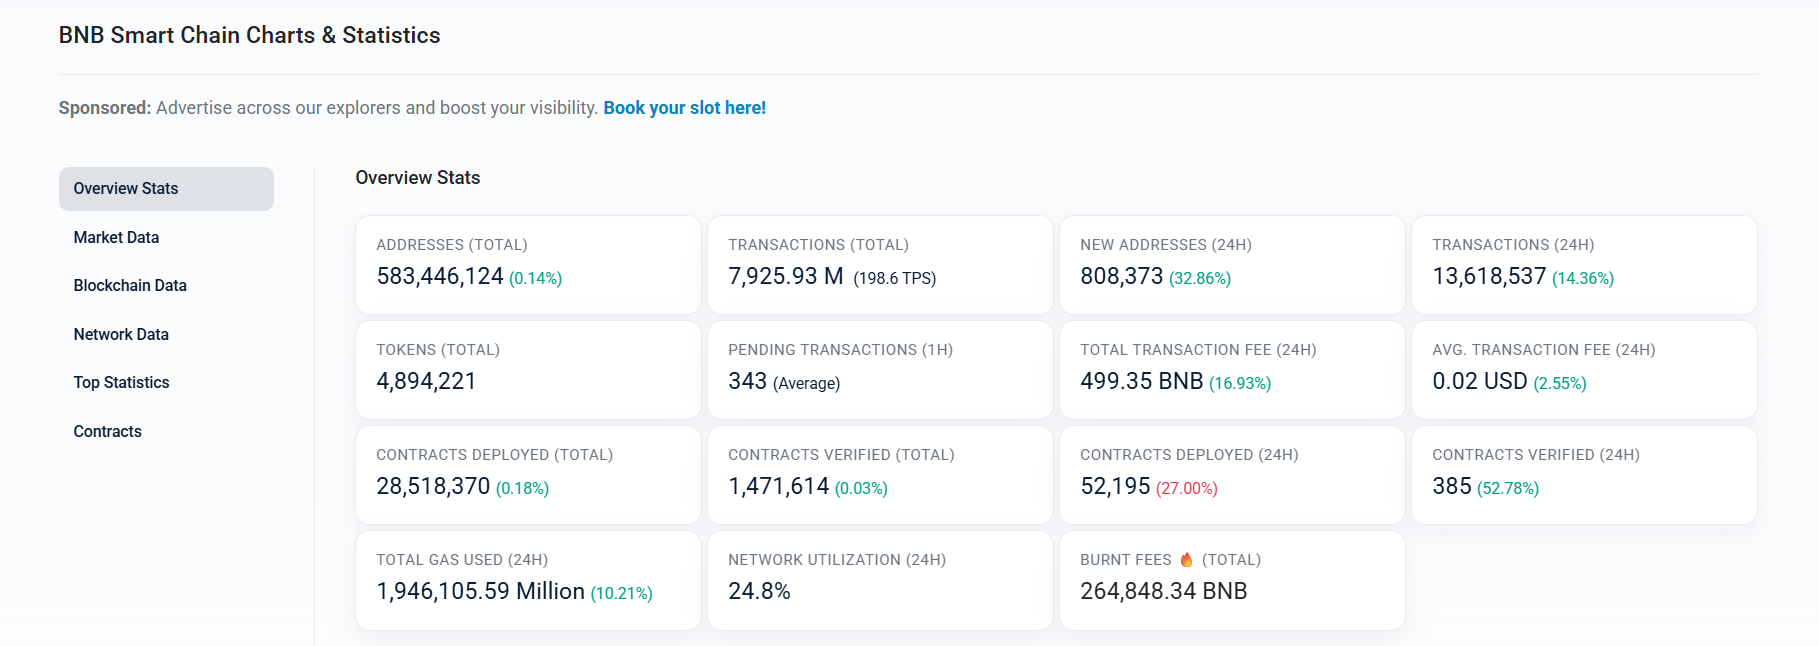
BNB Smart Chain overview stats chart. Source: BscScan
CoinGlass’s OI-Weighted Funding Rate data shows that the number of traders betting that the price of BNB coin will slide further is lower than that anticipating a price increase.
The metric flipped to a positive rate on Monday and stood at 0.0034% on Tuesday, indicating that longs are paying shorts and supporting the bullish outlook.
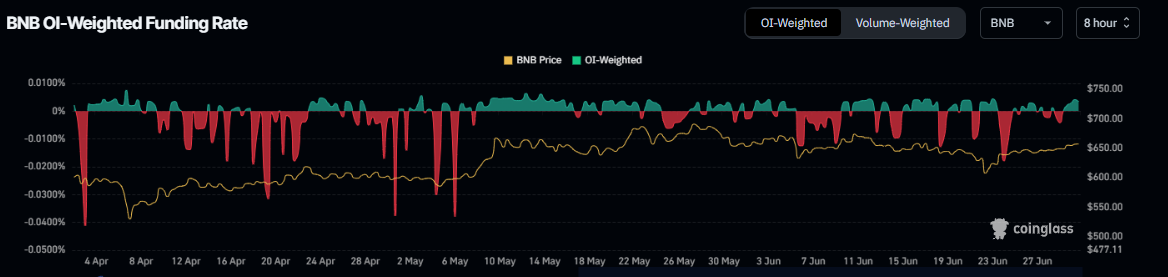
BNB funding rate chart. Source: Coinglass
BNB Price Forecast: BNB breaks above a falling wedge pattern
BNB price broke above the upper trendline of the falling wedge pattern on Saturday and ROSE nearly 2% until Monday. This pattern is formed by connecting multiple high and low levels with a trendline from mid-May; a breakout indicates a bullish bias. At the time of writing on Tuesday, it hovers around $657.
If BNB continues its upward trend, it could extend the rally toward its weekly resistance at $709.29.
The Relative Strength Index (RSI) on the daily chart reads 55, above its neutral level of 50, indicating that bullish momentum is gaining traction. The Moving Average Convergence Divergence (MACD) indicator also displayed a bullish crossover on Saturday, providing a buy signal and indicating an upward trend.
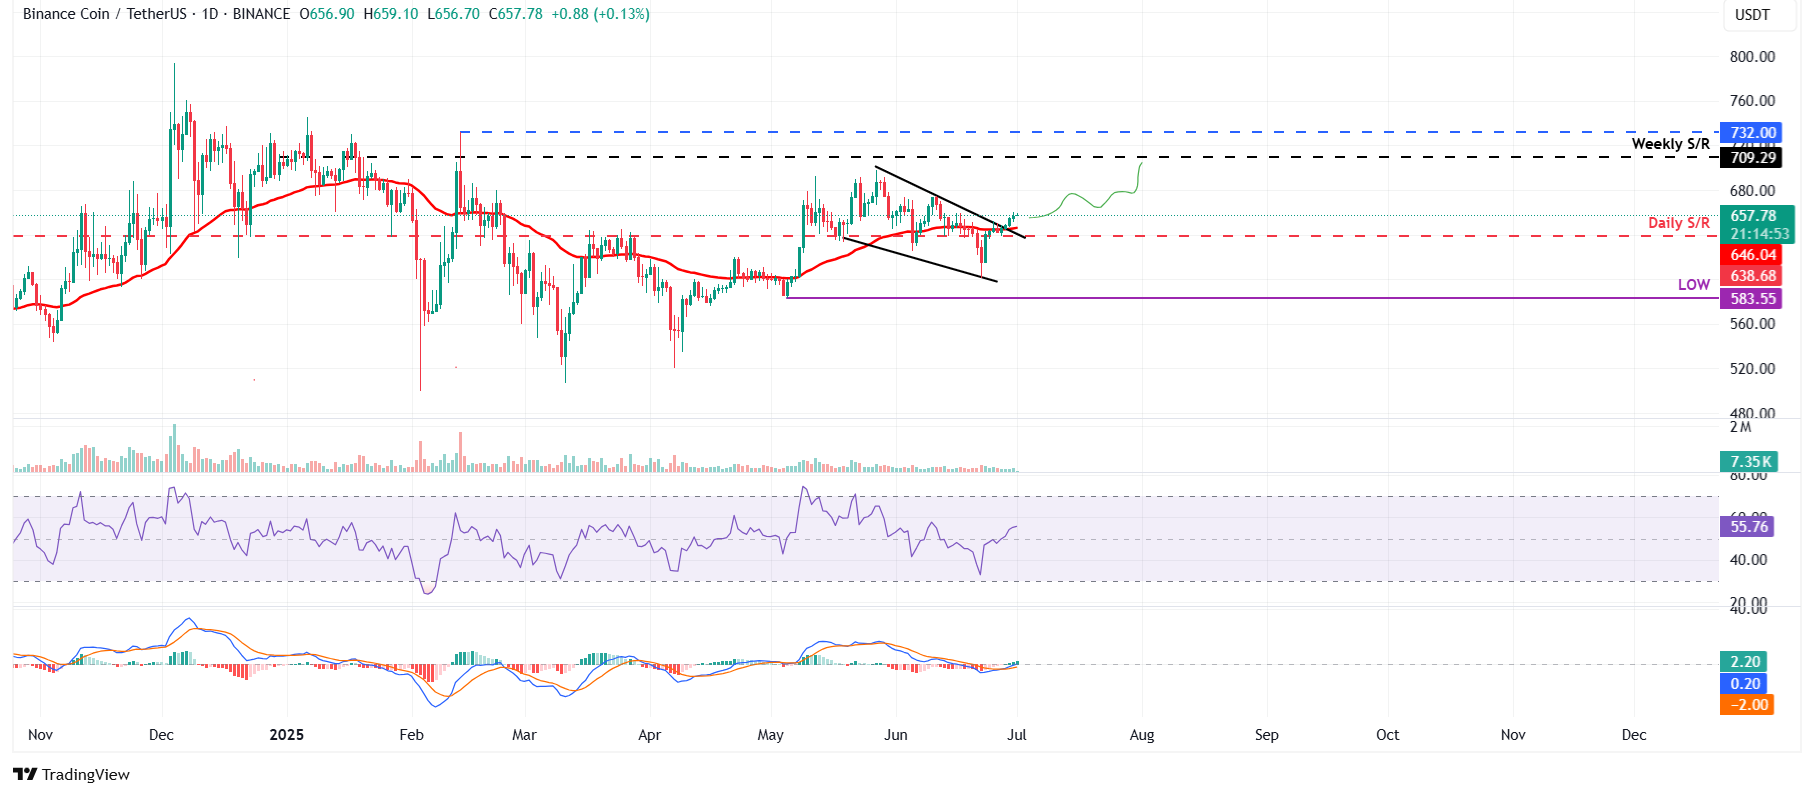
BNB/USDT daily chart
However, if BNB faces a correction, it could extend the decline to retest its daily support level at $646.04.
