🚀 ARB, PYTH, IMX Rocket: These Cryptos Are Outperforming the Market with Double-Digit Surges

Altcoins roar back as ARB and PYTH spearhead a bullish charge—while IMX quietly builds momentum. Traders pile in, skeptics scoff, and your portfolio either cheers or weeps.
The Rebound Play: Forget 'dead cat bounce'—these tokens are sprinting while BTC plays catch-up. ARB's governance buzz and PYTH's oracle dominance fuel the frenzy.
Dark Horse Alert: IMX isn't screaming headlines yet, but its gaming-infrastructure bets are paying off. (Unlike your neighbor's 'sure thing' meme coin.)
Wall Street Whispers: 'This is why we hedge,' mutters one institutional trader—right before doubling their alt position. Classic.
Arbitrum aims to surpass an overhead supply zone
Arbitrum eases slightly by 1% at press time on Monday, following the 18% surge the previous day. ARB challenges the $0.35 supply zone, holding its 37% recovery from last week.
A close above the supply zone marked in yellow on the daily chart below could propel the uptrend towards the 200-day Exponential Moving Average (EMA) at $0.45.
The Moving Average Convergence/Divergence (MACD) displays a bullish crossover (MACD line crossing above its signal line) on Thursday, indicating an uptrend in motion.
The Relative Strength Index (RSI) crosses above the halfway line to 58, indicating a boost in buying pressure.
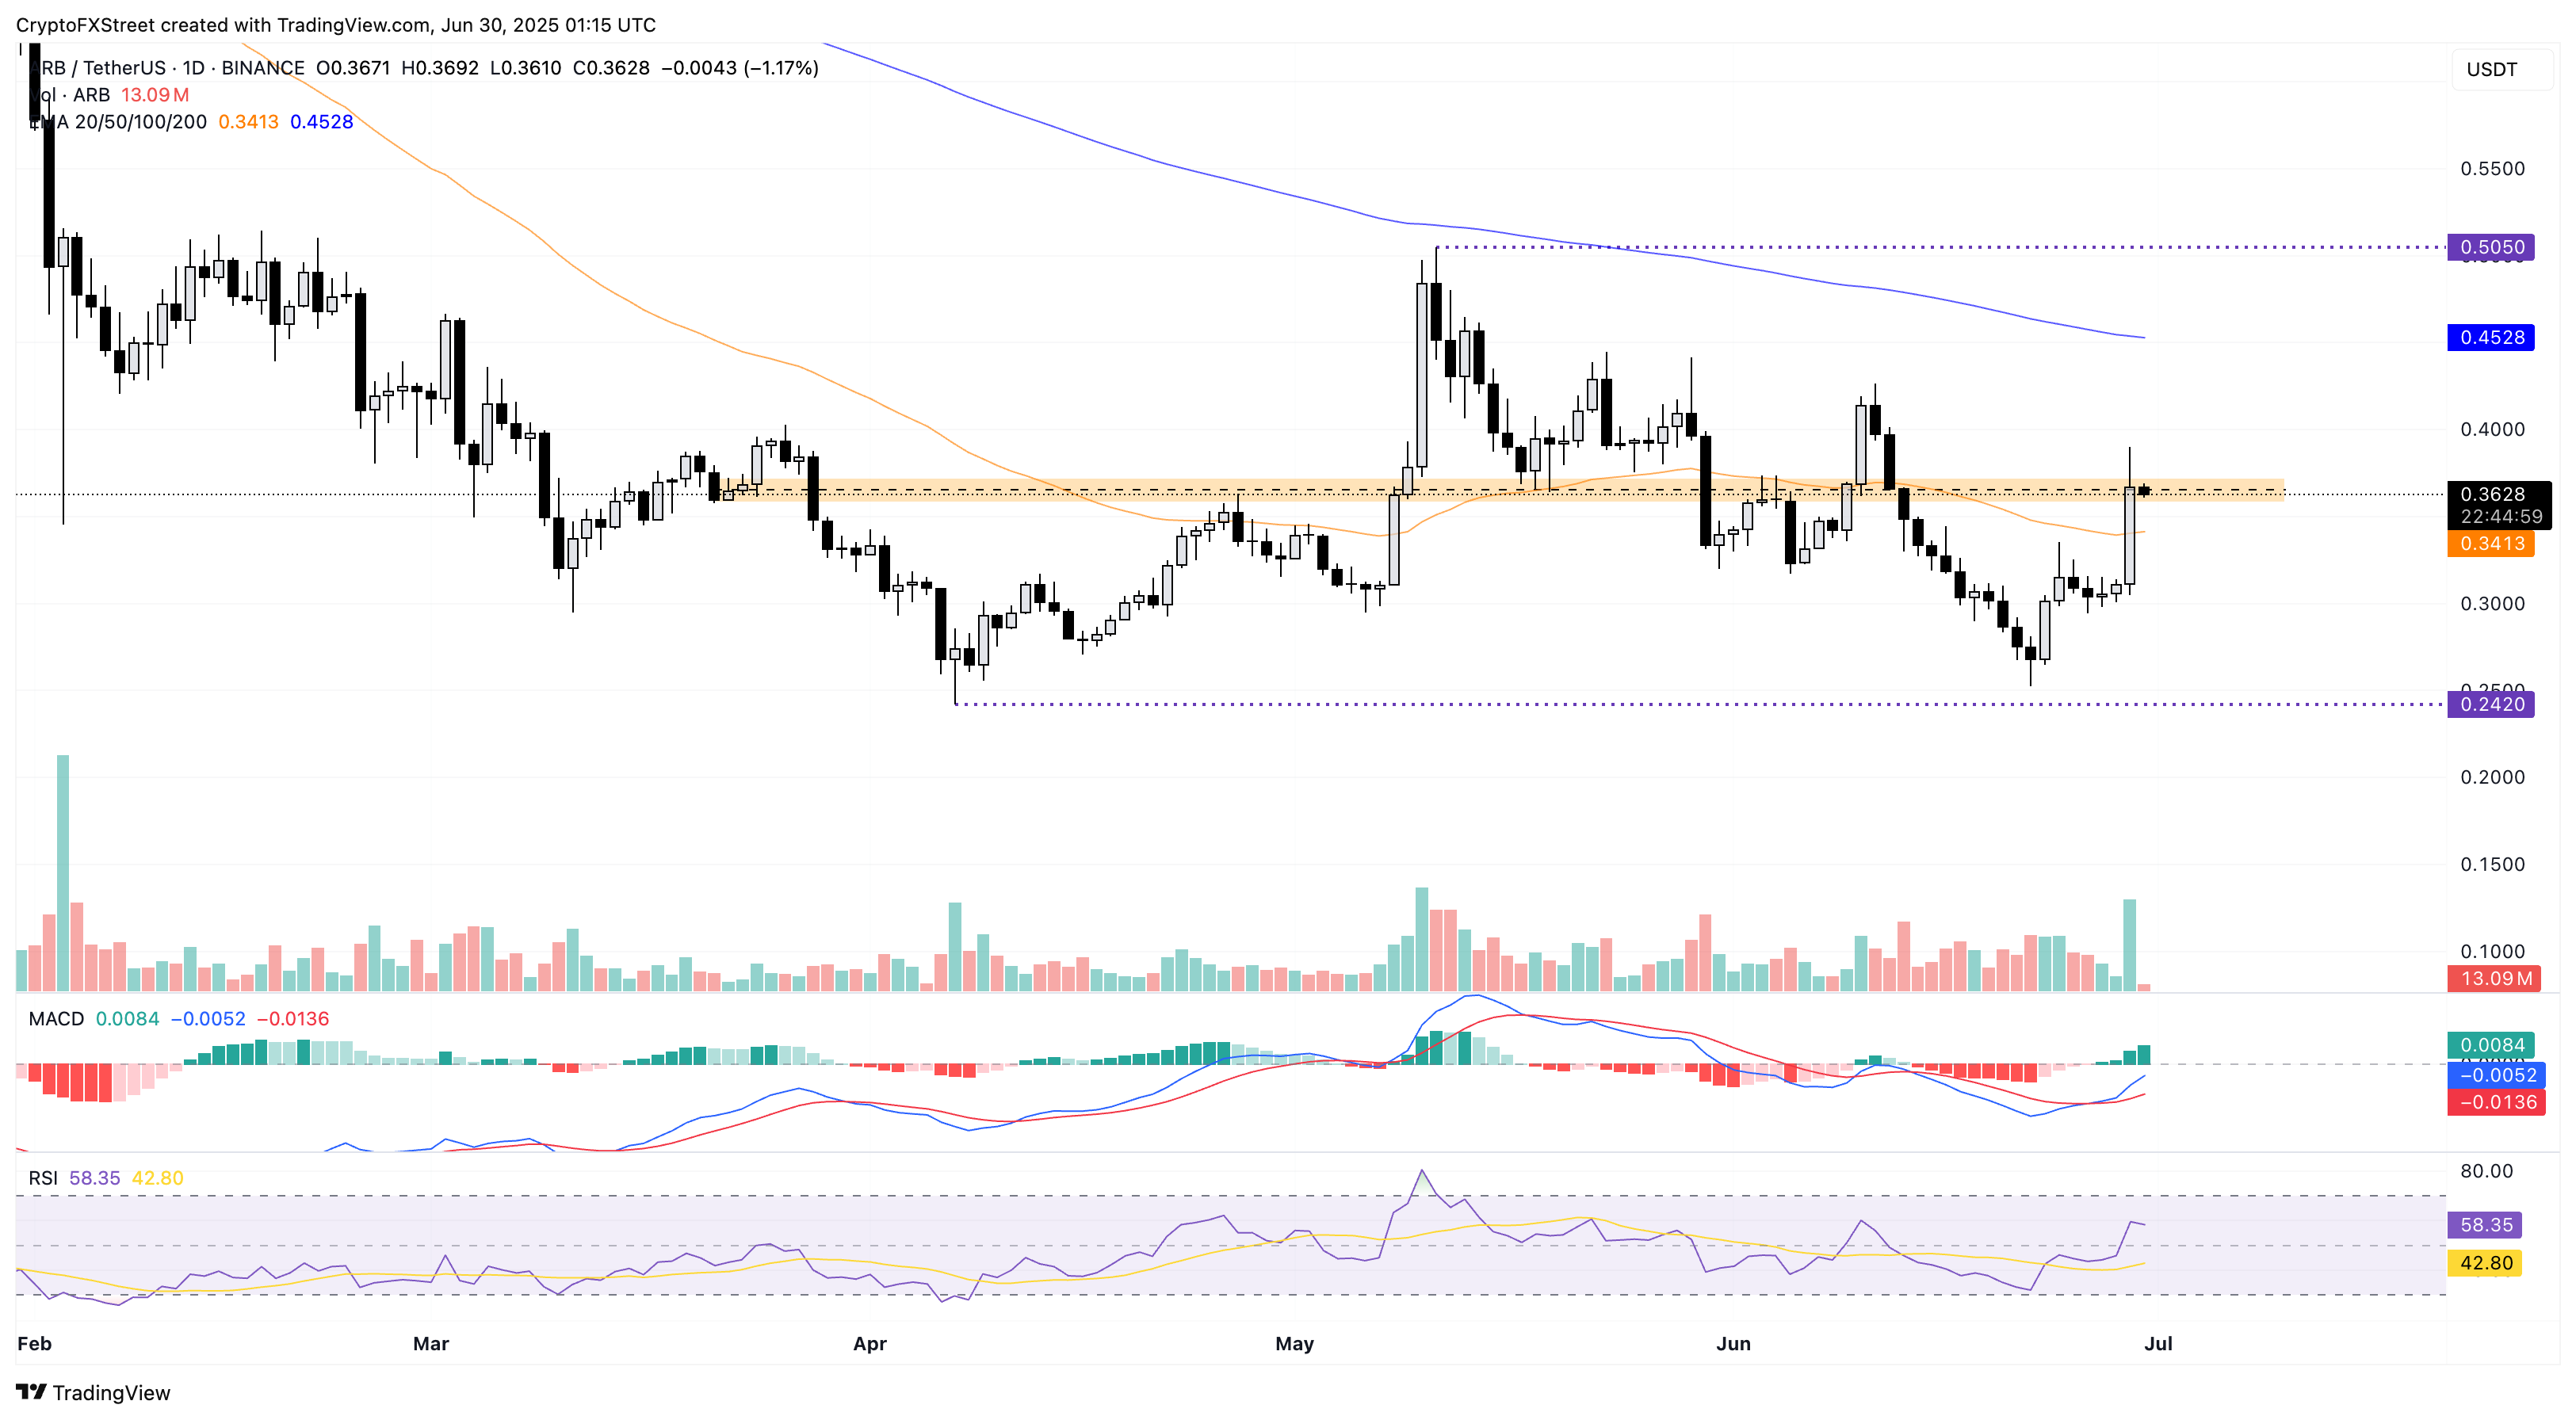
ARB/USDT daily price chart.
A reversal from the supply zone could result in the 50-day EMA retest at $0.34.
Pyth targets 50-day EMA breakout
Pyth Network jumped 30% last week following its new year-to-date low of $0.080 on June 22. At the time of writing, PYTH edges lower by almost 1% following the 10.85% rise on Sunday.
The altcoin struggles to reach the 50-day EMA at $0.117, resulting in its first bearish candle in the last five days. A clean push above the dynamic resistance could extend PYTH towards the monthly high of $0.131.
The MACD indicator displays growing green histogram bars above the zero line, indicating a momentum surge and supporting the uptrend.
The RSI takes a swift reversal from the oversold boundary last week, crossing the halfway line to 51, indicating increased buying pressure.
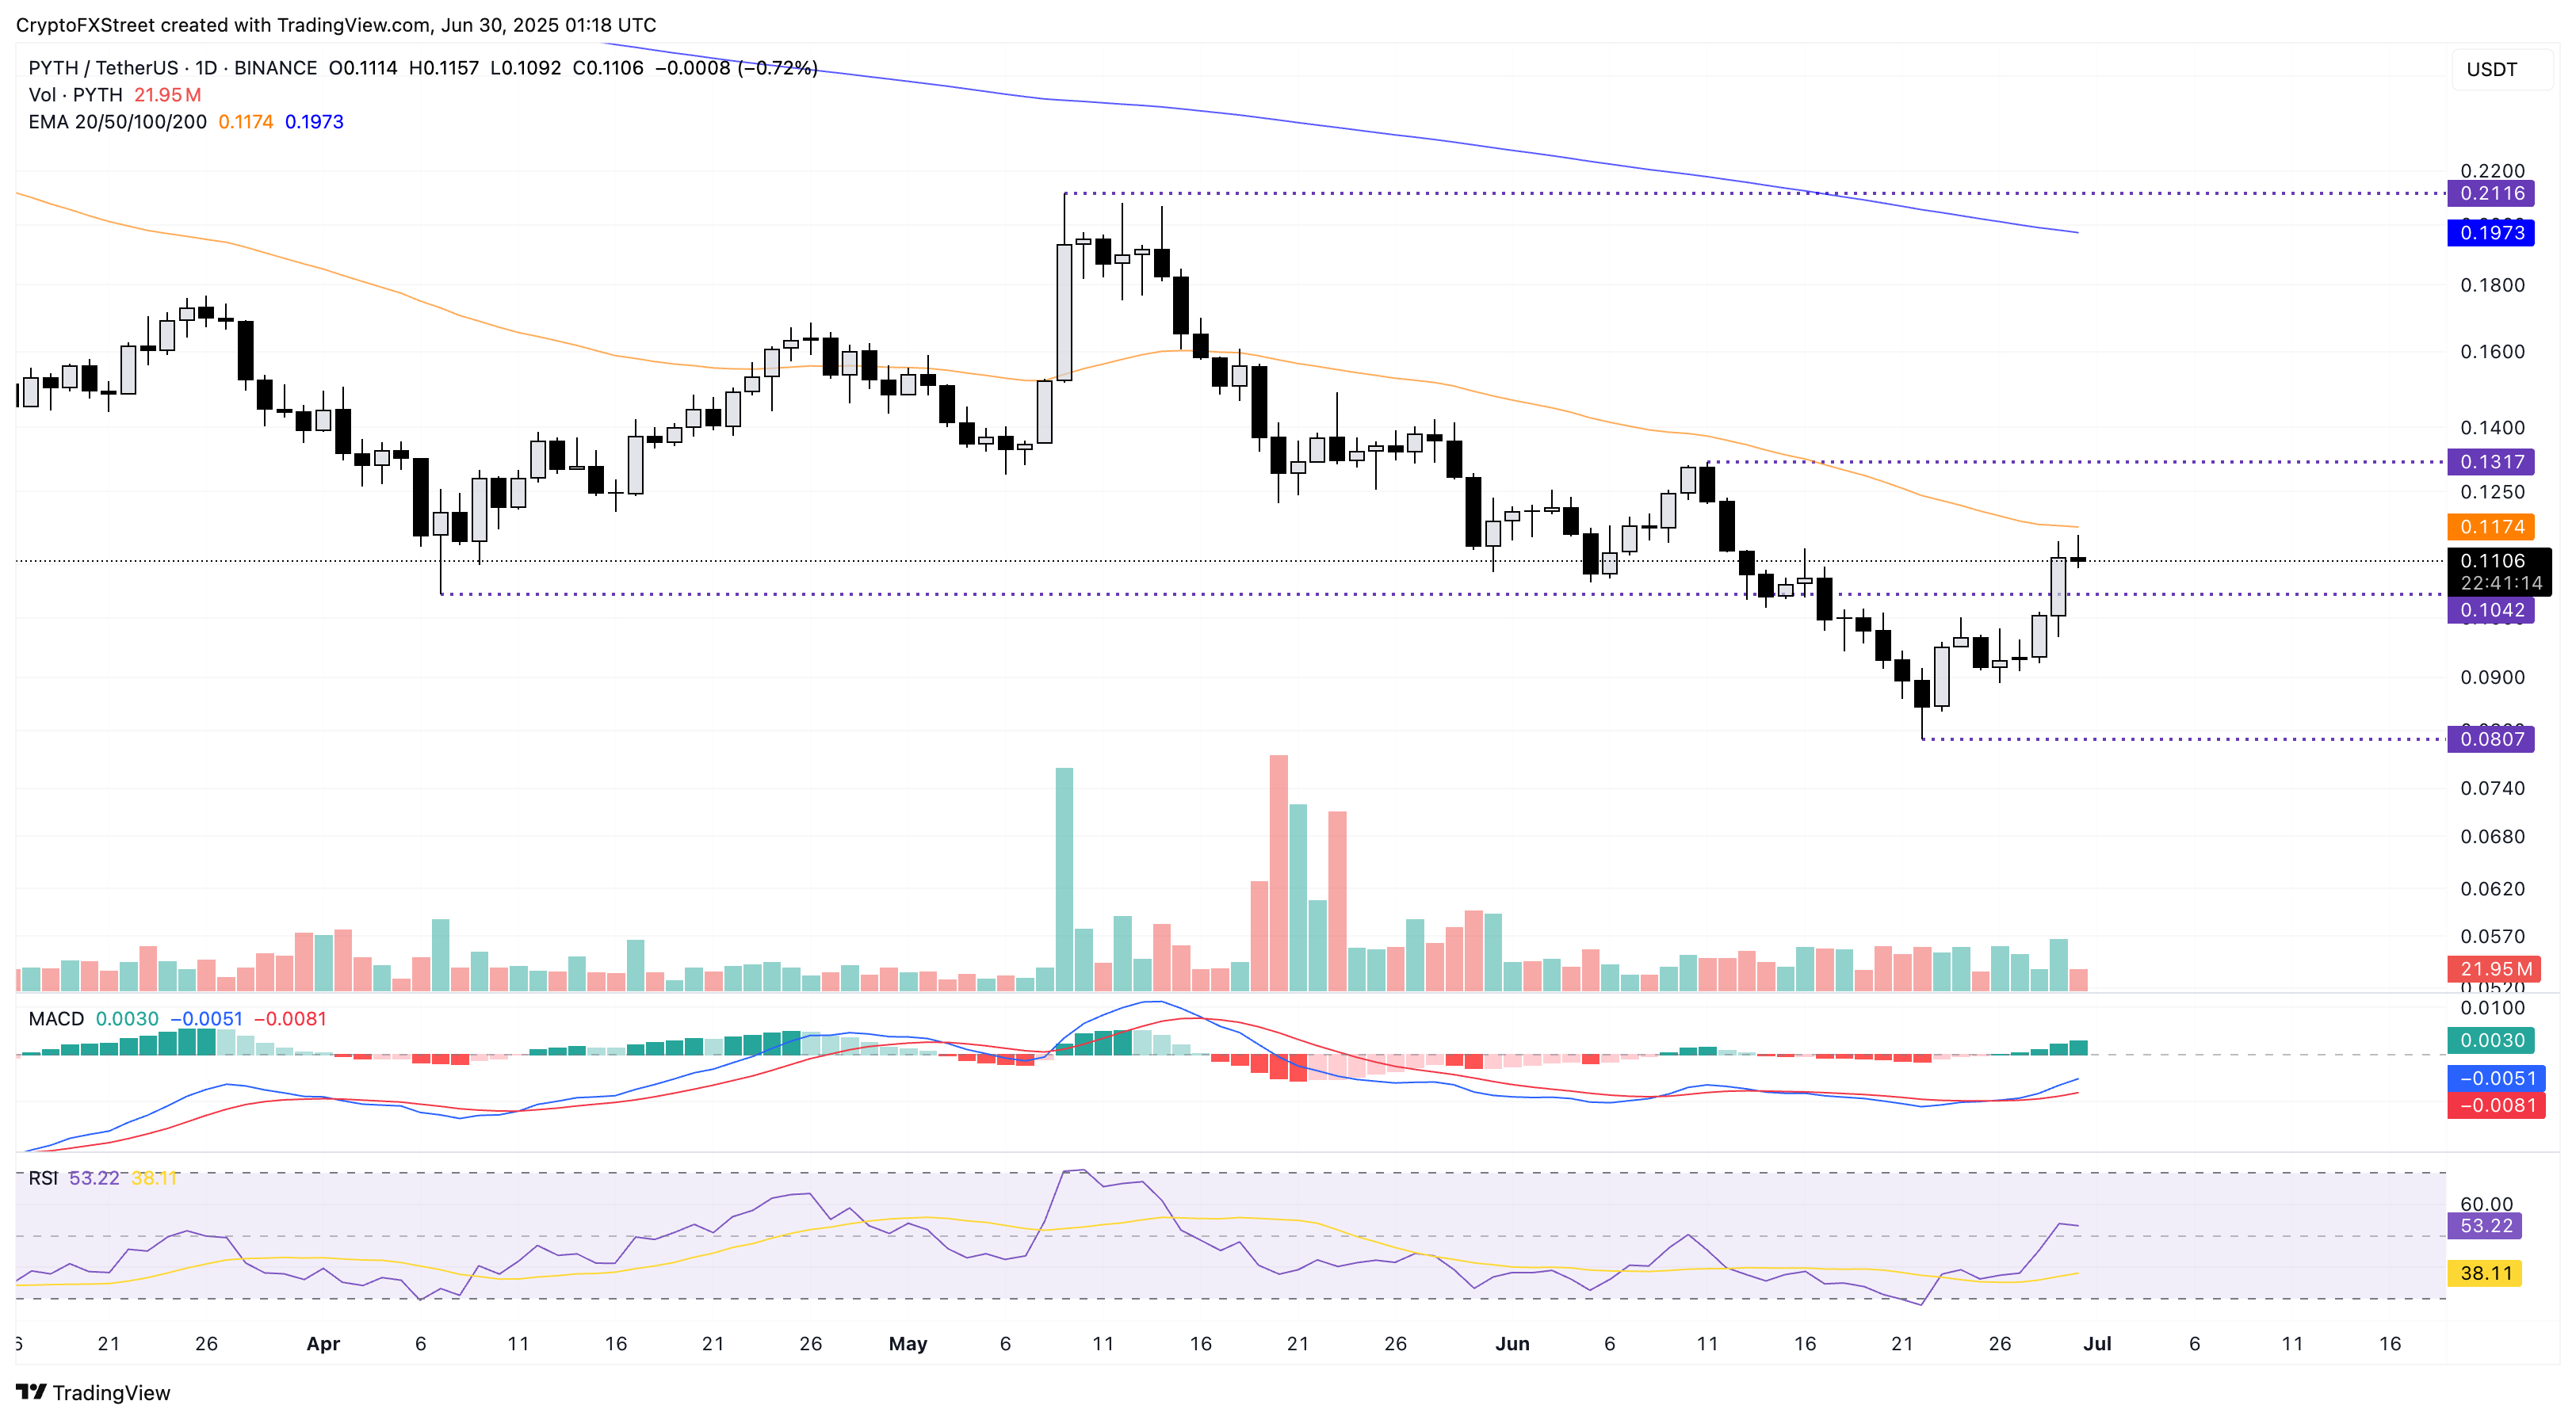
PYTH/USDT daily price chart.
A reversal could extend the prevailing downfall towards the year-to-date low of $0.080.
IMX struggles to cross an overhead trendline
Immutable ticks lower by 1% at press time on Monday, reversing from the 50-day EMA at $0.50. The 30% recovery last week challenges a long-standing resistance trendline formed by the peaks on May 11, May 23, and June 11.
A decisive daily close above the trendline and the 50-day EMA could drive IMX towards the monthly high of $0.58.
The MACD indicator triggers a buy signal (MACD line crossing above its signal line) on Wednesday. A fresh wave of green histogram bars from the zero line signals a bullish trend in motion.
The RSI reaches the midpoint level after a bounce back from the oversold boundary, suggesting a sharp decline in prevailing bearish pressure.
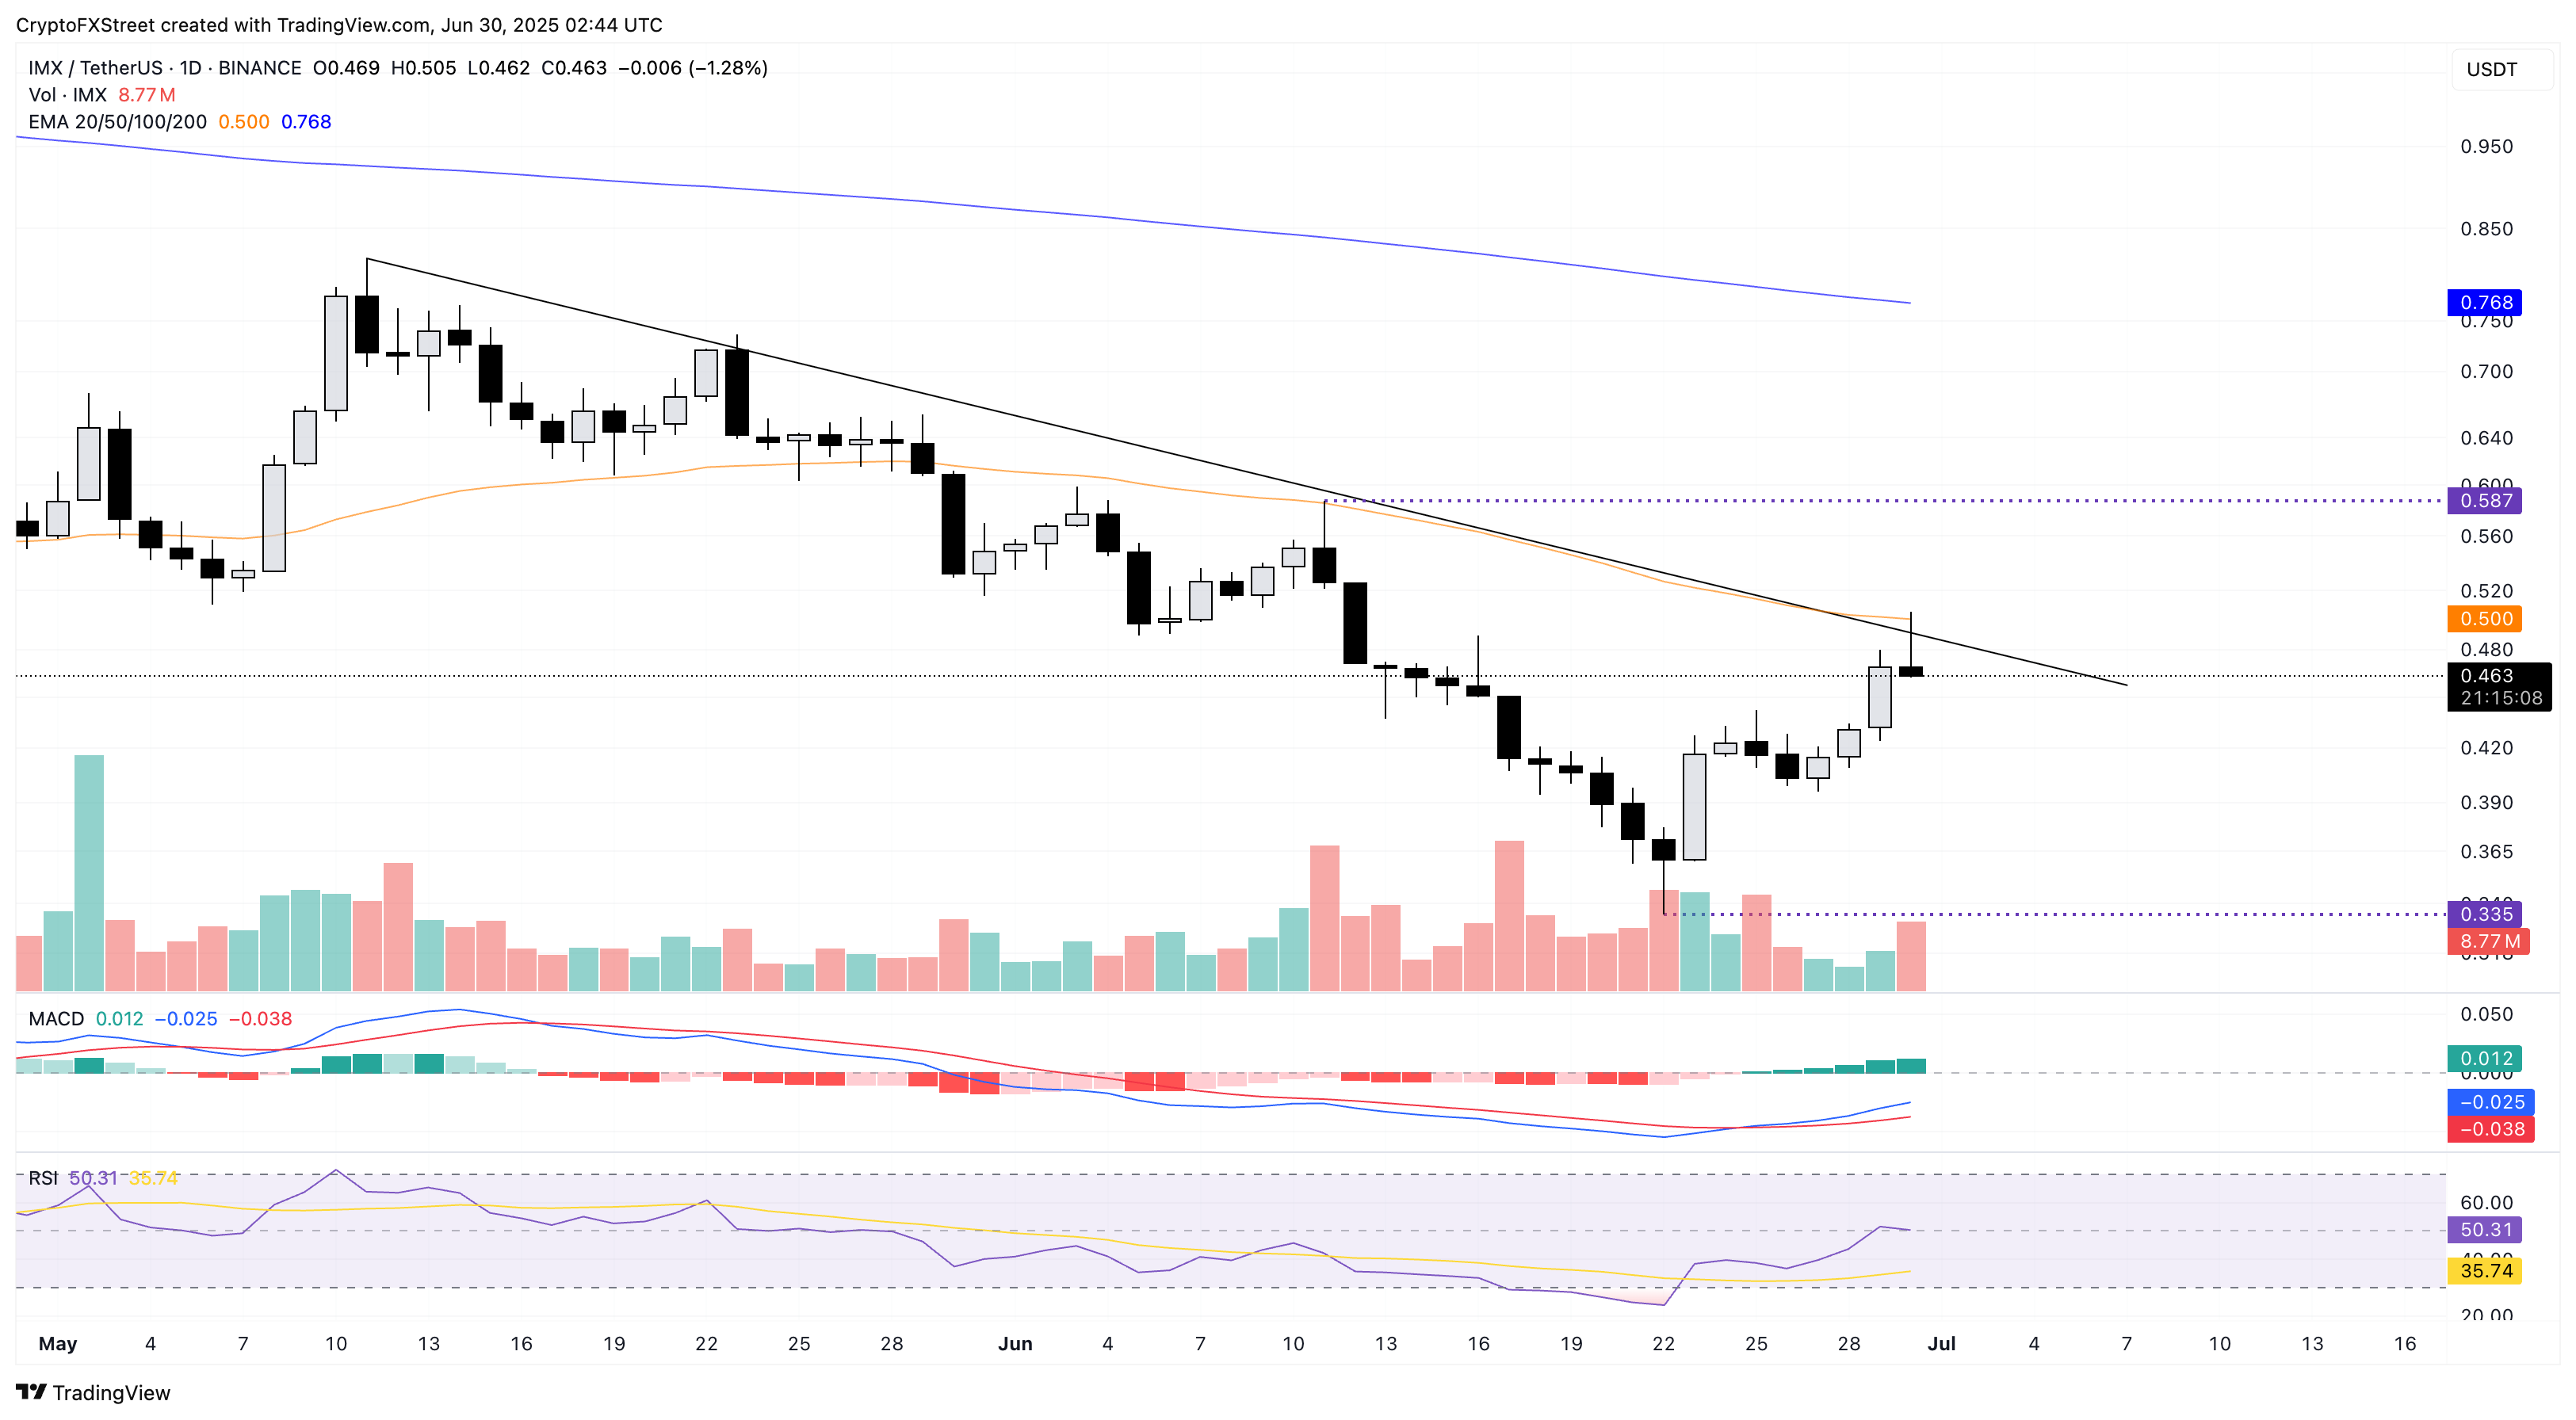
IMX/USDT daily price chart.
A bearish close undermining the Sunday recovery could lead to a decline towards the year-to-date low of $0.33.
