Hyperliquid Defies Market Volatility: Strong $35 Support Floor as DeFi TVL Rockets 80% in Q2 2025

DeFi's sleeping giant awakens with a vengeance.
While traditional finance still debates blockchain's merits, Hyperliquid just flashed its strongest technical signal in months—a rock-solid $35 support level emerging as the DeFi protocol's TVL skyrockets 80% since March. The numbers don't lie: decentralized finance keeps eating Wall Street's lunch.
Price Anchors Amid Chaos
That $35 floor isn't just psychological—it's where algorithmic traders and OTC desks piled bids during last week's flash crash. Meanwhile, yield farmers keep voting with their wallets, pushing total value locked from $1.2B to $2.16B in 90 days. Who needs FDIC insurance when you've got composability?
The Institutionalization Paradox
Here's the dirty secret: half that TVL growth came from crypto-native hedge funds quietly rotating out of 'regulated' products. They want real yield, not your grandfather's 5% 'high-yield' savings account. The irony? These same whales are now the liquidity backbone propping up Hyperliquid's price.
DeFi's flywheel spins faster while traditional finance still tries to patent it. Will $35 hold? If TVL keeps this trajectory, we might just see Hyperliquid retest its ATH before the suits finish their 'blockchain task force' report.
Hyperliquid DeFi TVL growth signals investor confidence
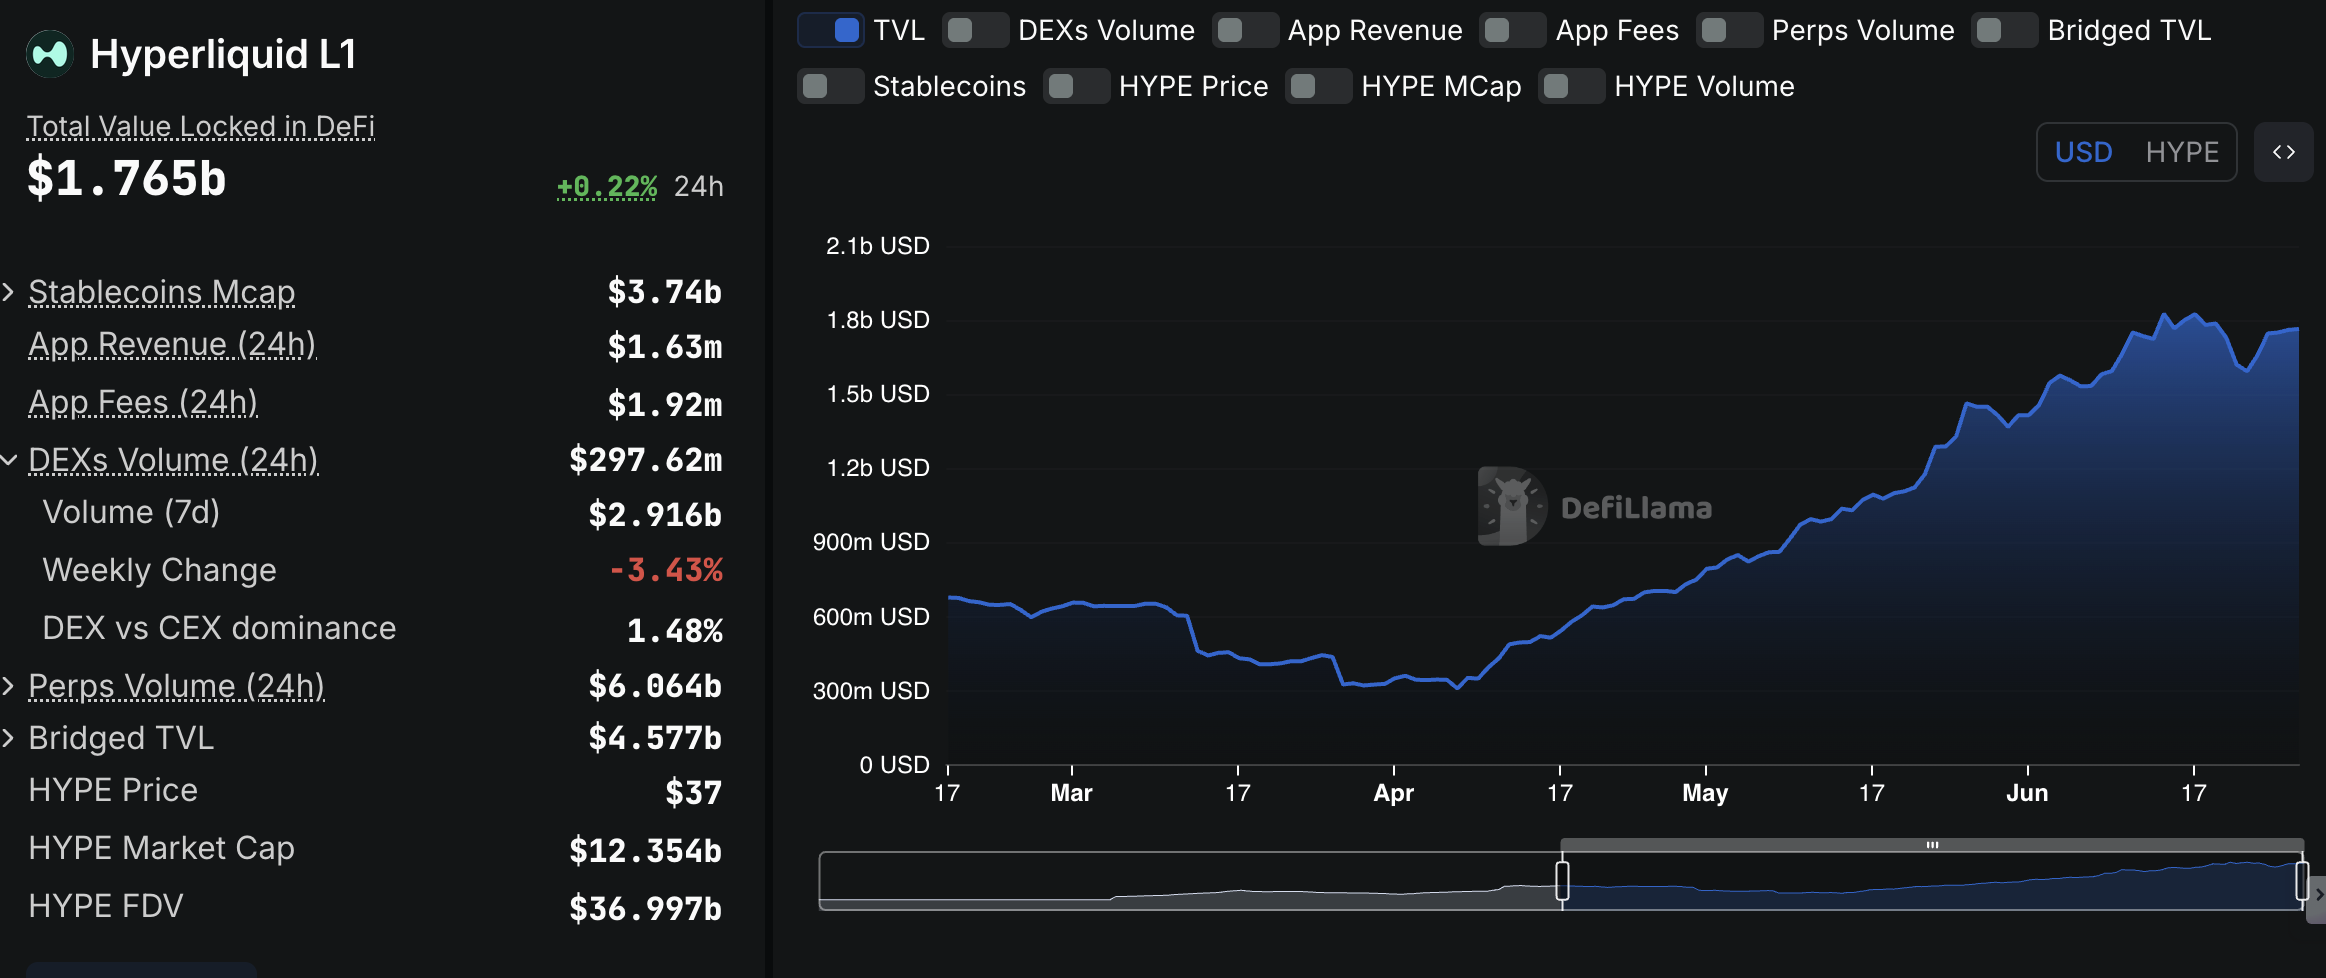
Interest in Hyperliquid has steadily increased over the past three months, buoyed by the HYPE's price rally to all-time highs. According to DeFiLlama, the Decentralized Finance (DeFi) Total Value Locked (TVL), which represents the total value of all coins held in smart contracts linked to protocols on the chain, stood at around $1.77 billion on Friday.
The uptrend over the past three months, since April 1, has led to an 80% increase in the TVL from approximately $353 million. This suggests that user confidence and trust in the token and the ecosystem are growing, evidenced by the surge in deposits and staking.
Hyperliquid DeFi TVL data | Source: DeFiLlama
A higher TVL figure reflects adequate liquidity in the protocol's DeFi platforms, encompassing lending, borrowing, and trading. In general, Hyperliquid boasts a positive sentiment backed by token holders and platform adoption.
At the same time, a higher TVL volume predisposes HYPE to price increases amid reduced sell-side pressure because users lock their holdings in smart contracts.
However, investors may need to temper their expectations based on the downward trend in HYPE futures contracts' Open Interest (OI). CoinGlass data shows that OI averaged $1.66 billion on Friday after peaking at around $1.98 billion on June 17.
Open Interest refers to the US Dollar (USD) of all futures and options contracts that have yet to be settled or closed. A persistent decline indicates that traders are losing interest in HYPE and are unlikely to be betting on price increases in the short term.
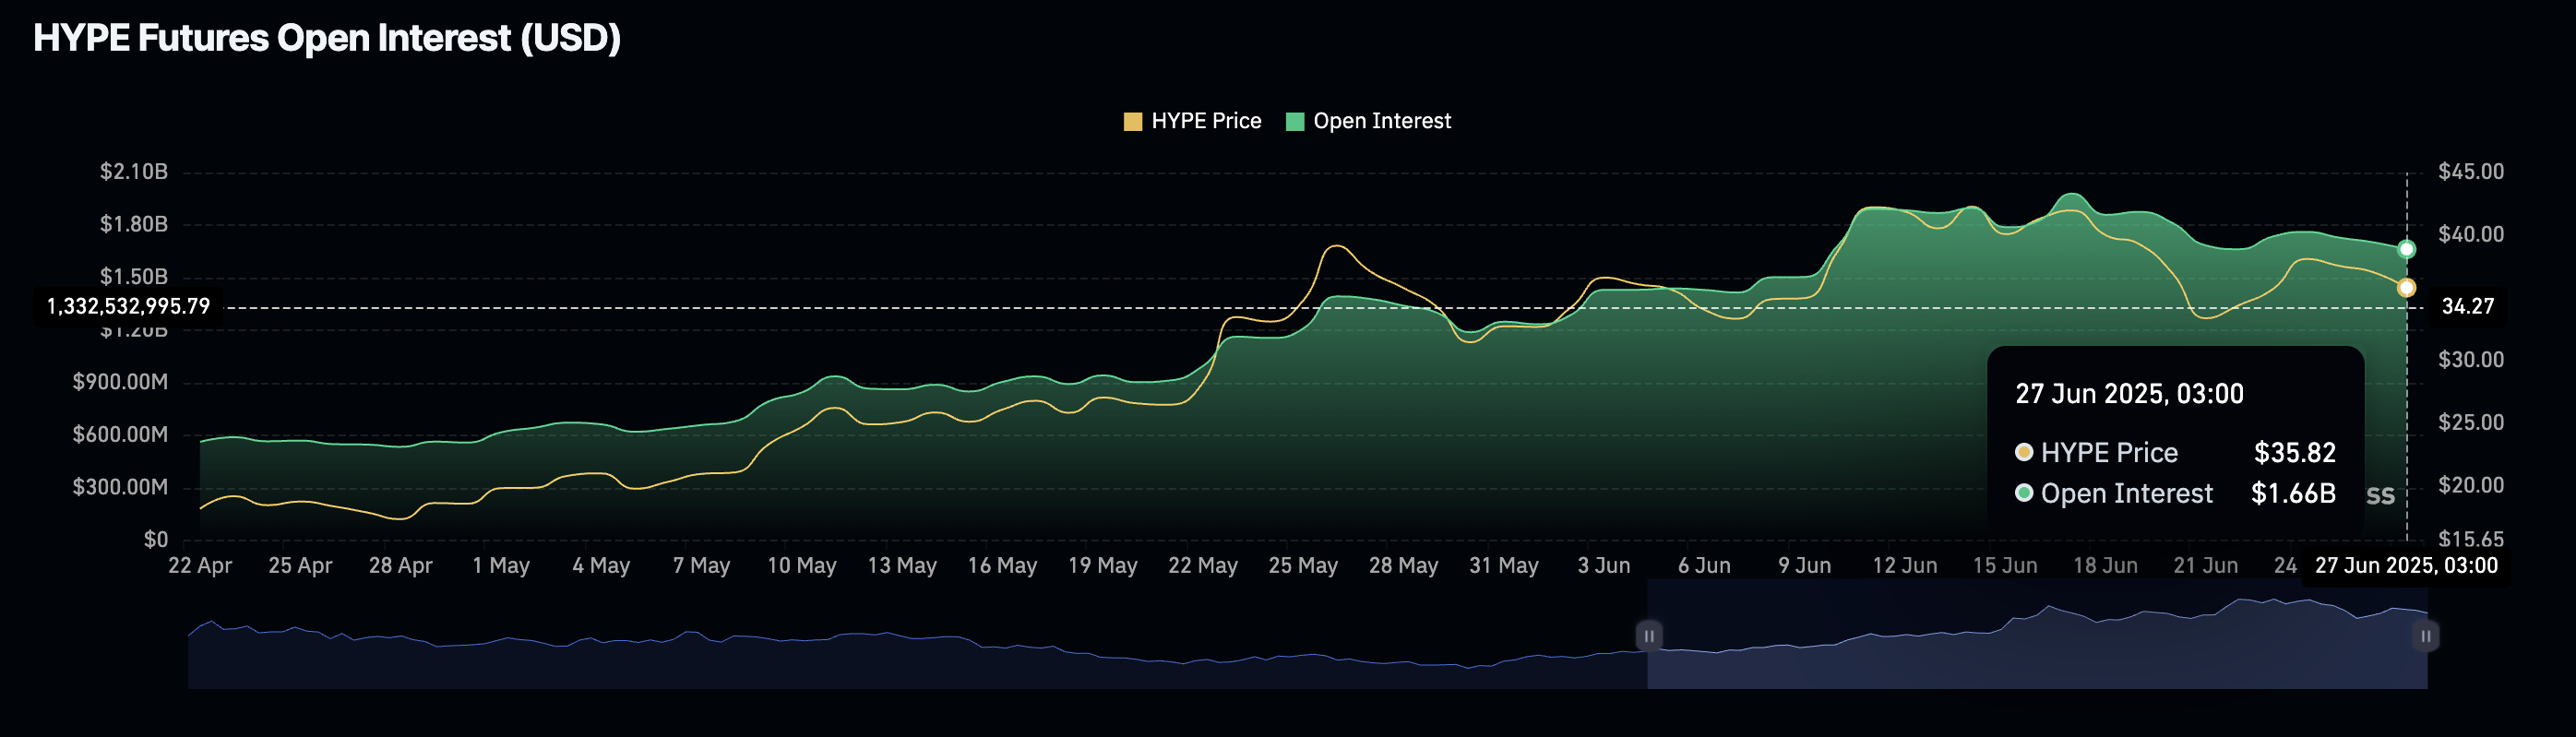
Hyperliquid Open Interest data | Source: CoinGlass
If volume drops in tandem, trading activity will slow down, possibly limiting bullish momentum and leaving Hyperliquid vulnerable to a decline.
Technical outlook: Hyperliquid attempts recovery, but bearish signals persist
Hyperliquid's price is printing a green candle on Friday after securing technical support at around $35.34. A breakout toward the $40.00 key hurdle will likely follow if bulls rise above a confluence resistance at around $37.14, where the 100-period Exponential Moving Average (EMA) and the 50-period EMA converge with the upper boundary of the descending channel on the 4-hour chart.
The Relative Strength Index (RSI) hovers slightly above the midline, indicating mild bullish momentum. Traders should monitor the market for continued movement toward overbought territory to assess the strength of the uptrend.
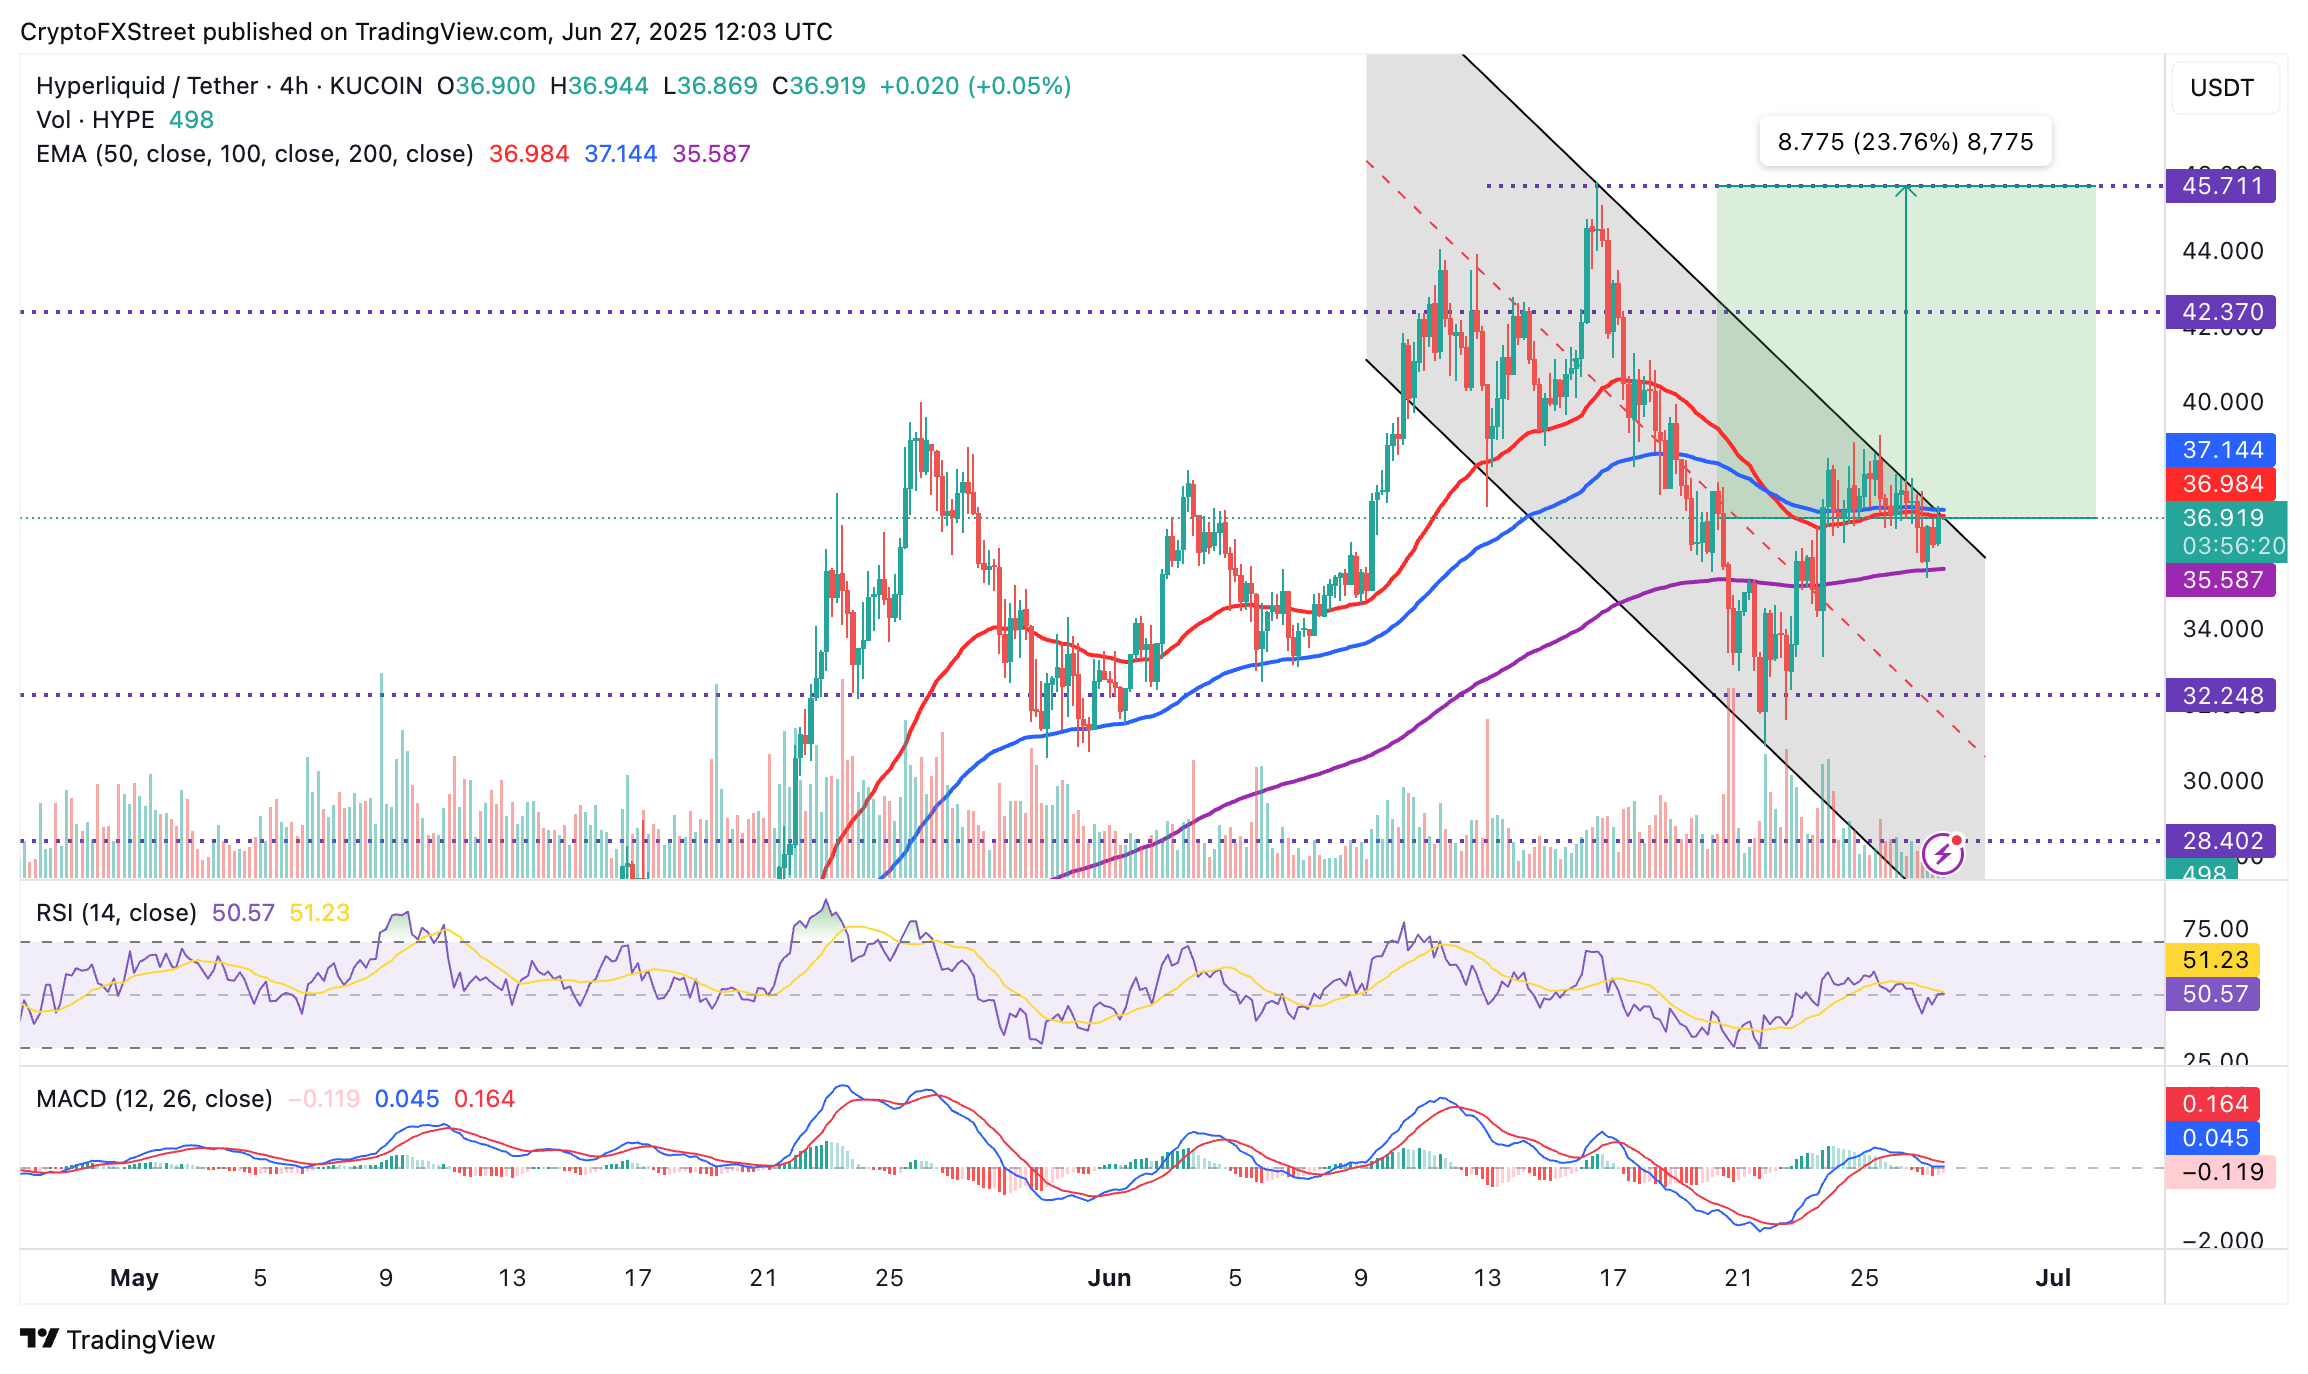
HYPE/USD 4-hour chart
Still, the Moving Average Convergence Divergence (MACD) indicator sustains a sell signal that was flashed on Thursday, which could dilute bullish momentum.
Cryptocurrency metrics FAQs
What is circulating supply?
The developer or creator of each cryptocurrency decides on the total number of tokens that can be minted or issued. Only a certain number of these assets can be minted by mining, staking or other mechanisms. This is defined by the algorithm of the underlying blockchain technology. On the other hand, circulating supply can also be decreased via actions such as burning tokens, or mistakenly sending assets to addresses of other incompatible blockchains.
What is market capitalization?
Market capitalization is the result of multiplying the circulating supply of a certain asset by the asset’s current market value.
What is trading volume?
Trading volume refers to the total number of tokens for a specific asset that has been transacted or exchanged between buyers and sellers within set trading hours, for example, 24 hours. It is used to gauge market sentiment, this metric combines all volumes on centralized exchanges and decentralized exchanges. Increasing trading volume often denotes the demand for a certain asset as more people are buying and selling the cryptocurrency.
What is the funding rate?
Funding rates are a concept designed to encourage traders to take positions and ensure perpetual contract prices match spot markets. It defines a mechanism by exchanges to ensure that future prices and index prices periodic payments regularly converge. When the funding rate is positive, the price of the perpetual contract is higher than the mark price. This means traders who are bullish and have opened long positions pay traders who are in short positions. On the other hand, a negative funding rate means perpetual prices are below the mark price, and hence traders with short positions pay traders who have opened long positions.
