Ripple Price Alert: XRP/BTC Plunges to 7-Month Low—But This Bullish Wedge Screams Breakout

Ripple's XRP just hit a grim milestone against Bitcoin—its lowest level since November 2024. But before the bears pop champagne, the charts whisper a comeback story.
Falling wedge pattern flashes buy signal
Technical traders are circling the XRP/BTC pair like sharks scenting blood. That textbook falling wedge? Historically, it’s a launchpad—not a graveyard. Meanwhile, Bitcoin maximalists are too busy counting their Satoshis to notice the setup.
Volatility ahead—liquidity hunt incoming
Market makers love nothing more than stomping on weak hands before reversing. With XRP’s perpetual funding rates hovering near neutral, the stage is set for a classic liquidity grab. Just don’t tell the 'number go up' crypto bros.
Bottom line: In crypto, even the ugliest charts can moon on pure hopium. Just ask the 'fundamentals don’t matter' crowd—right after they finish explaining why their bags are 'undervalued.'
XRP/BTC pair tumbles amid macroeconomic uncertainty
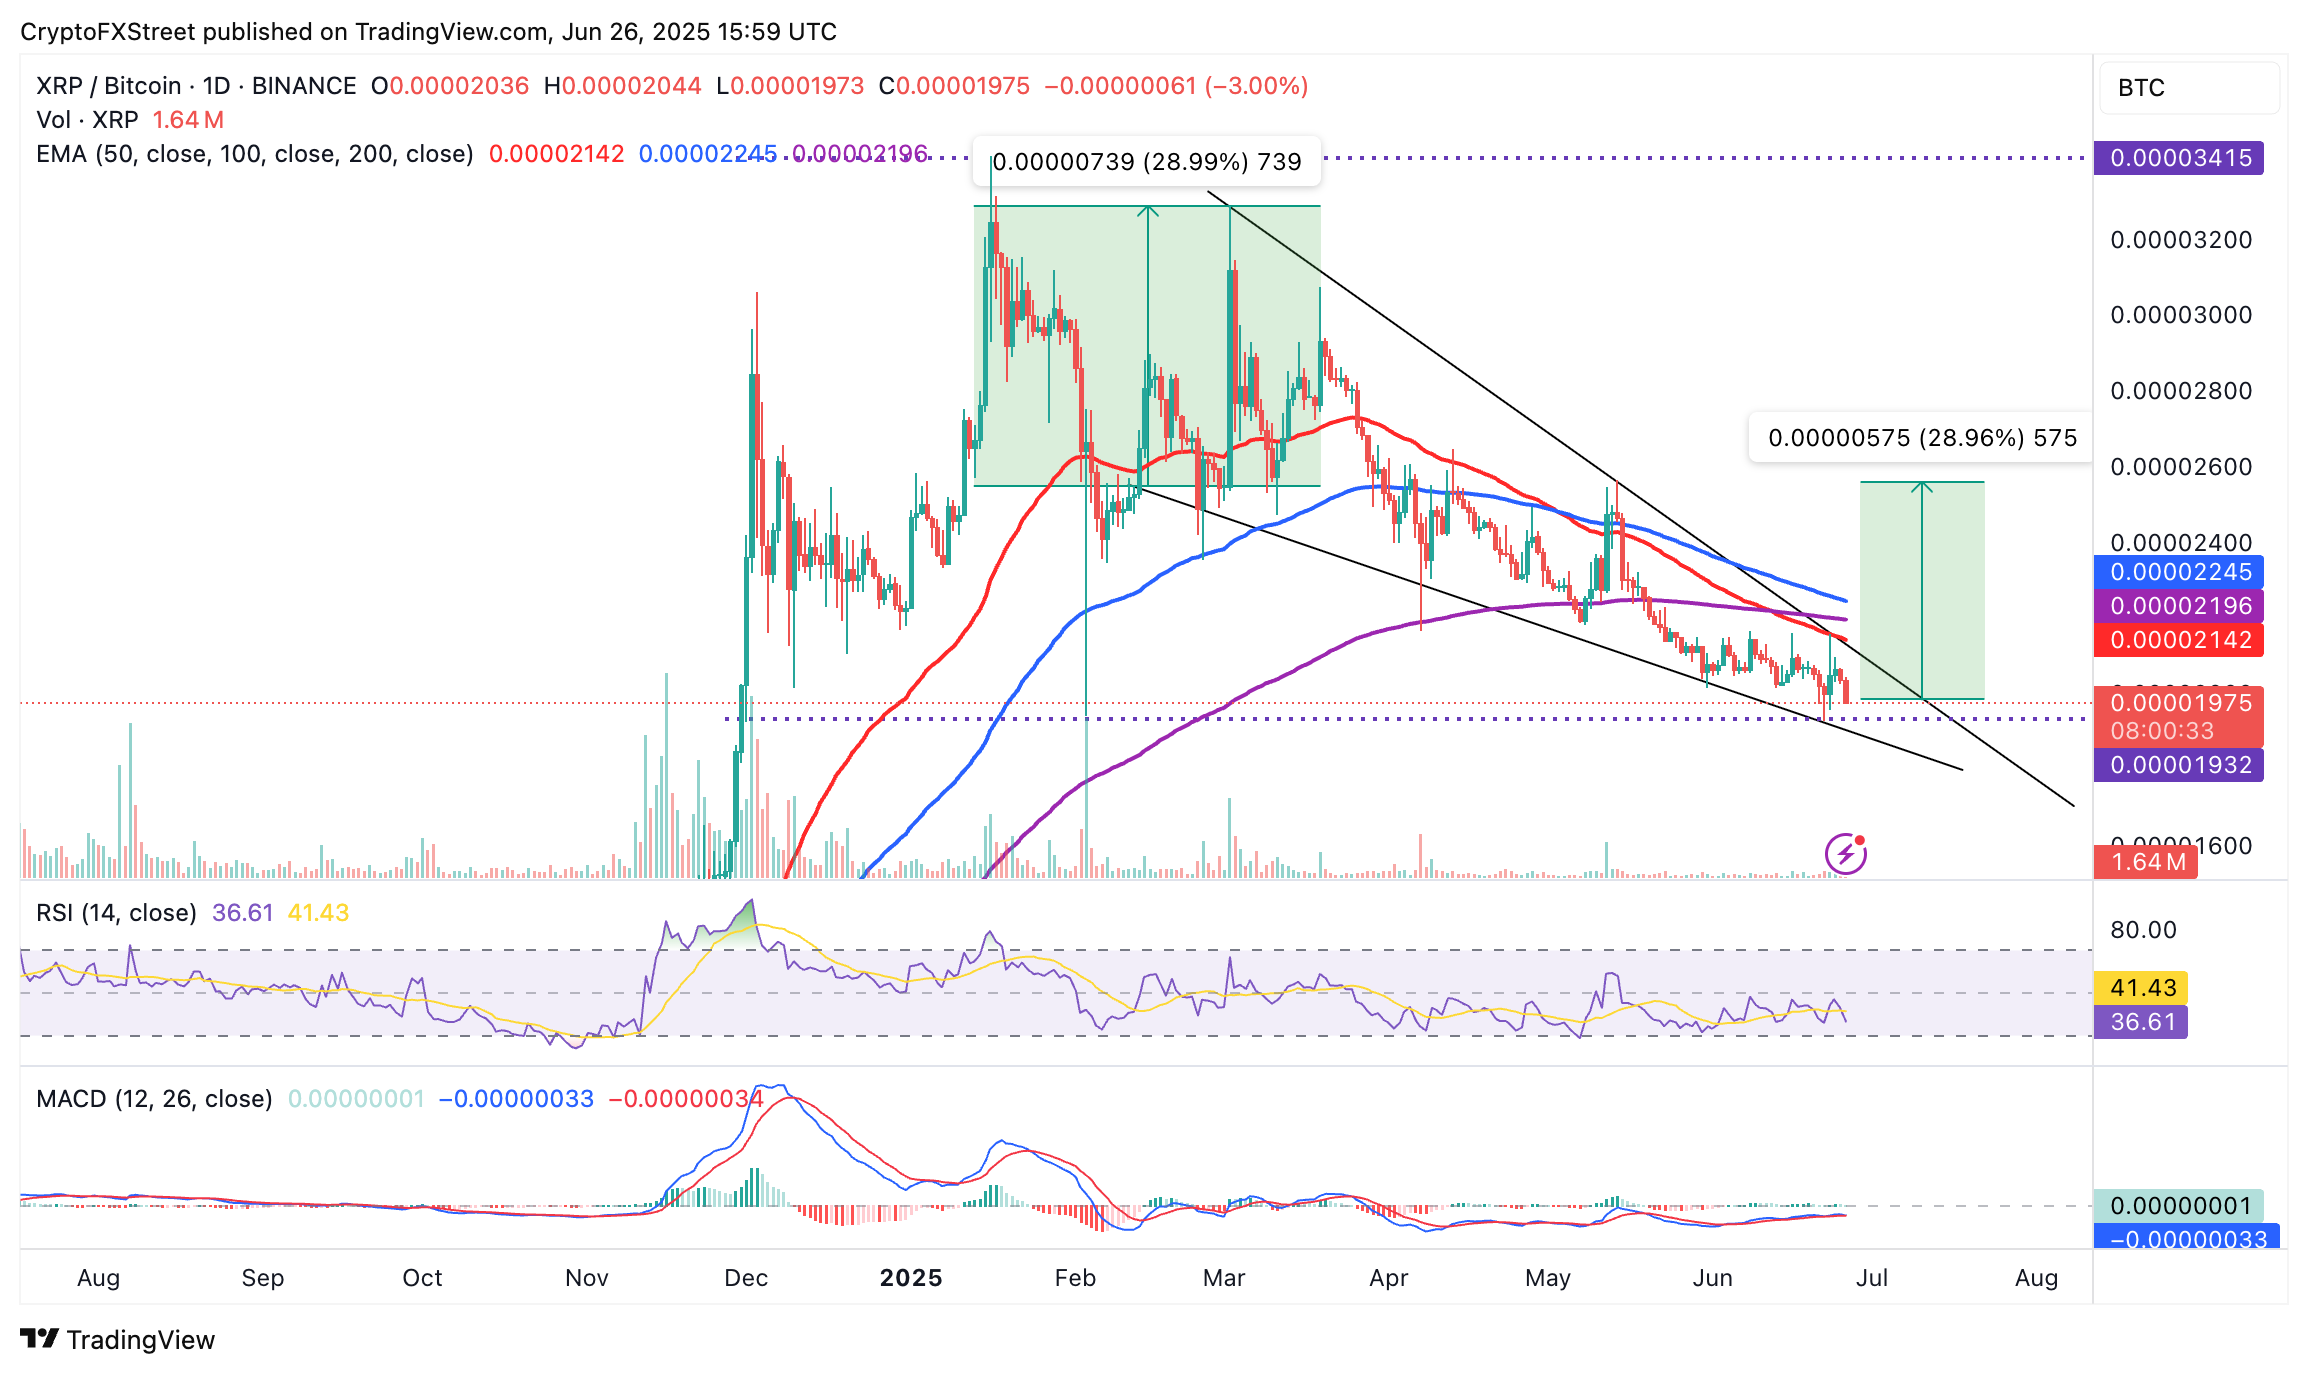
The XRP/BTC pair is offering bearish signals, sliding to 0.00001982 on the daily chart below amid concerns about the independence of the United States (US) Federal Reserve (Fed).
President Donald Trump reiterated his criticism of Fed Chair Jerome Powell during the NATO summit, stating that he looks forward to his replacement. As reported, the US Dollar Index (DXY) edged lower on Thursday, prompting investors to seek protection in select digital assets such as Bitcoin (BTC) and ethereum (ETH).
The XRP/BTC pair shows signs of further weakening, especially with the Relative Strength Index (RSI) falling to 37 and approaching oversold territory.
A death cross pattern formed when the 50-day Exponential Moving Average (EMA) crossed below the 200-day EMA on June 12, confirming a firm bearish grip. Traders could anticipate a rebound from the support level tested at 0.00001900 on Sunday.
XRP/BTC daily chart
Still, bearish expectations should be tempered, particularly due to the presence of a falling wedge pattern on the daily chart. This is a bullish pattern established when the pair consolidates between two converging trendlines, indicating a potential reversal of the downward trend.
Key indicators of the pattern include a reduction in volume and a narrowing range, which signal that selling pressure is waning and buyers are gaining control. Traders WOULD expect a breakout above the upper trendline. An increase in trading volume can validate the pattern, ensuring traders avoid false breakouts.
The XRP/BTC pair is expected to MOVE nearly 29% following the breakout. This target is determined by measuring the height of the pattern at its widest points and extrapolating above the breakout point to 0.00002560.
Such a move in the XRP/BTC pair has the potential to ignite a major rally in the price of XRP, reflecting the surge in November, December and January when the cross-border money transfer token reached $0.34.
Technical outlook: Is an XRP rally in the offing?
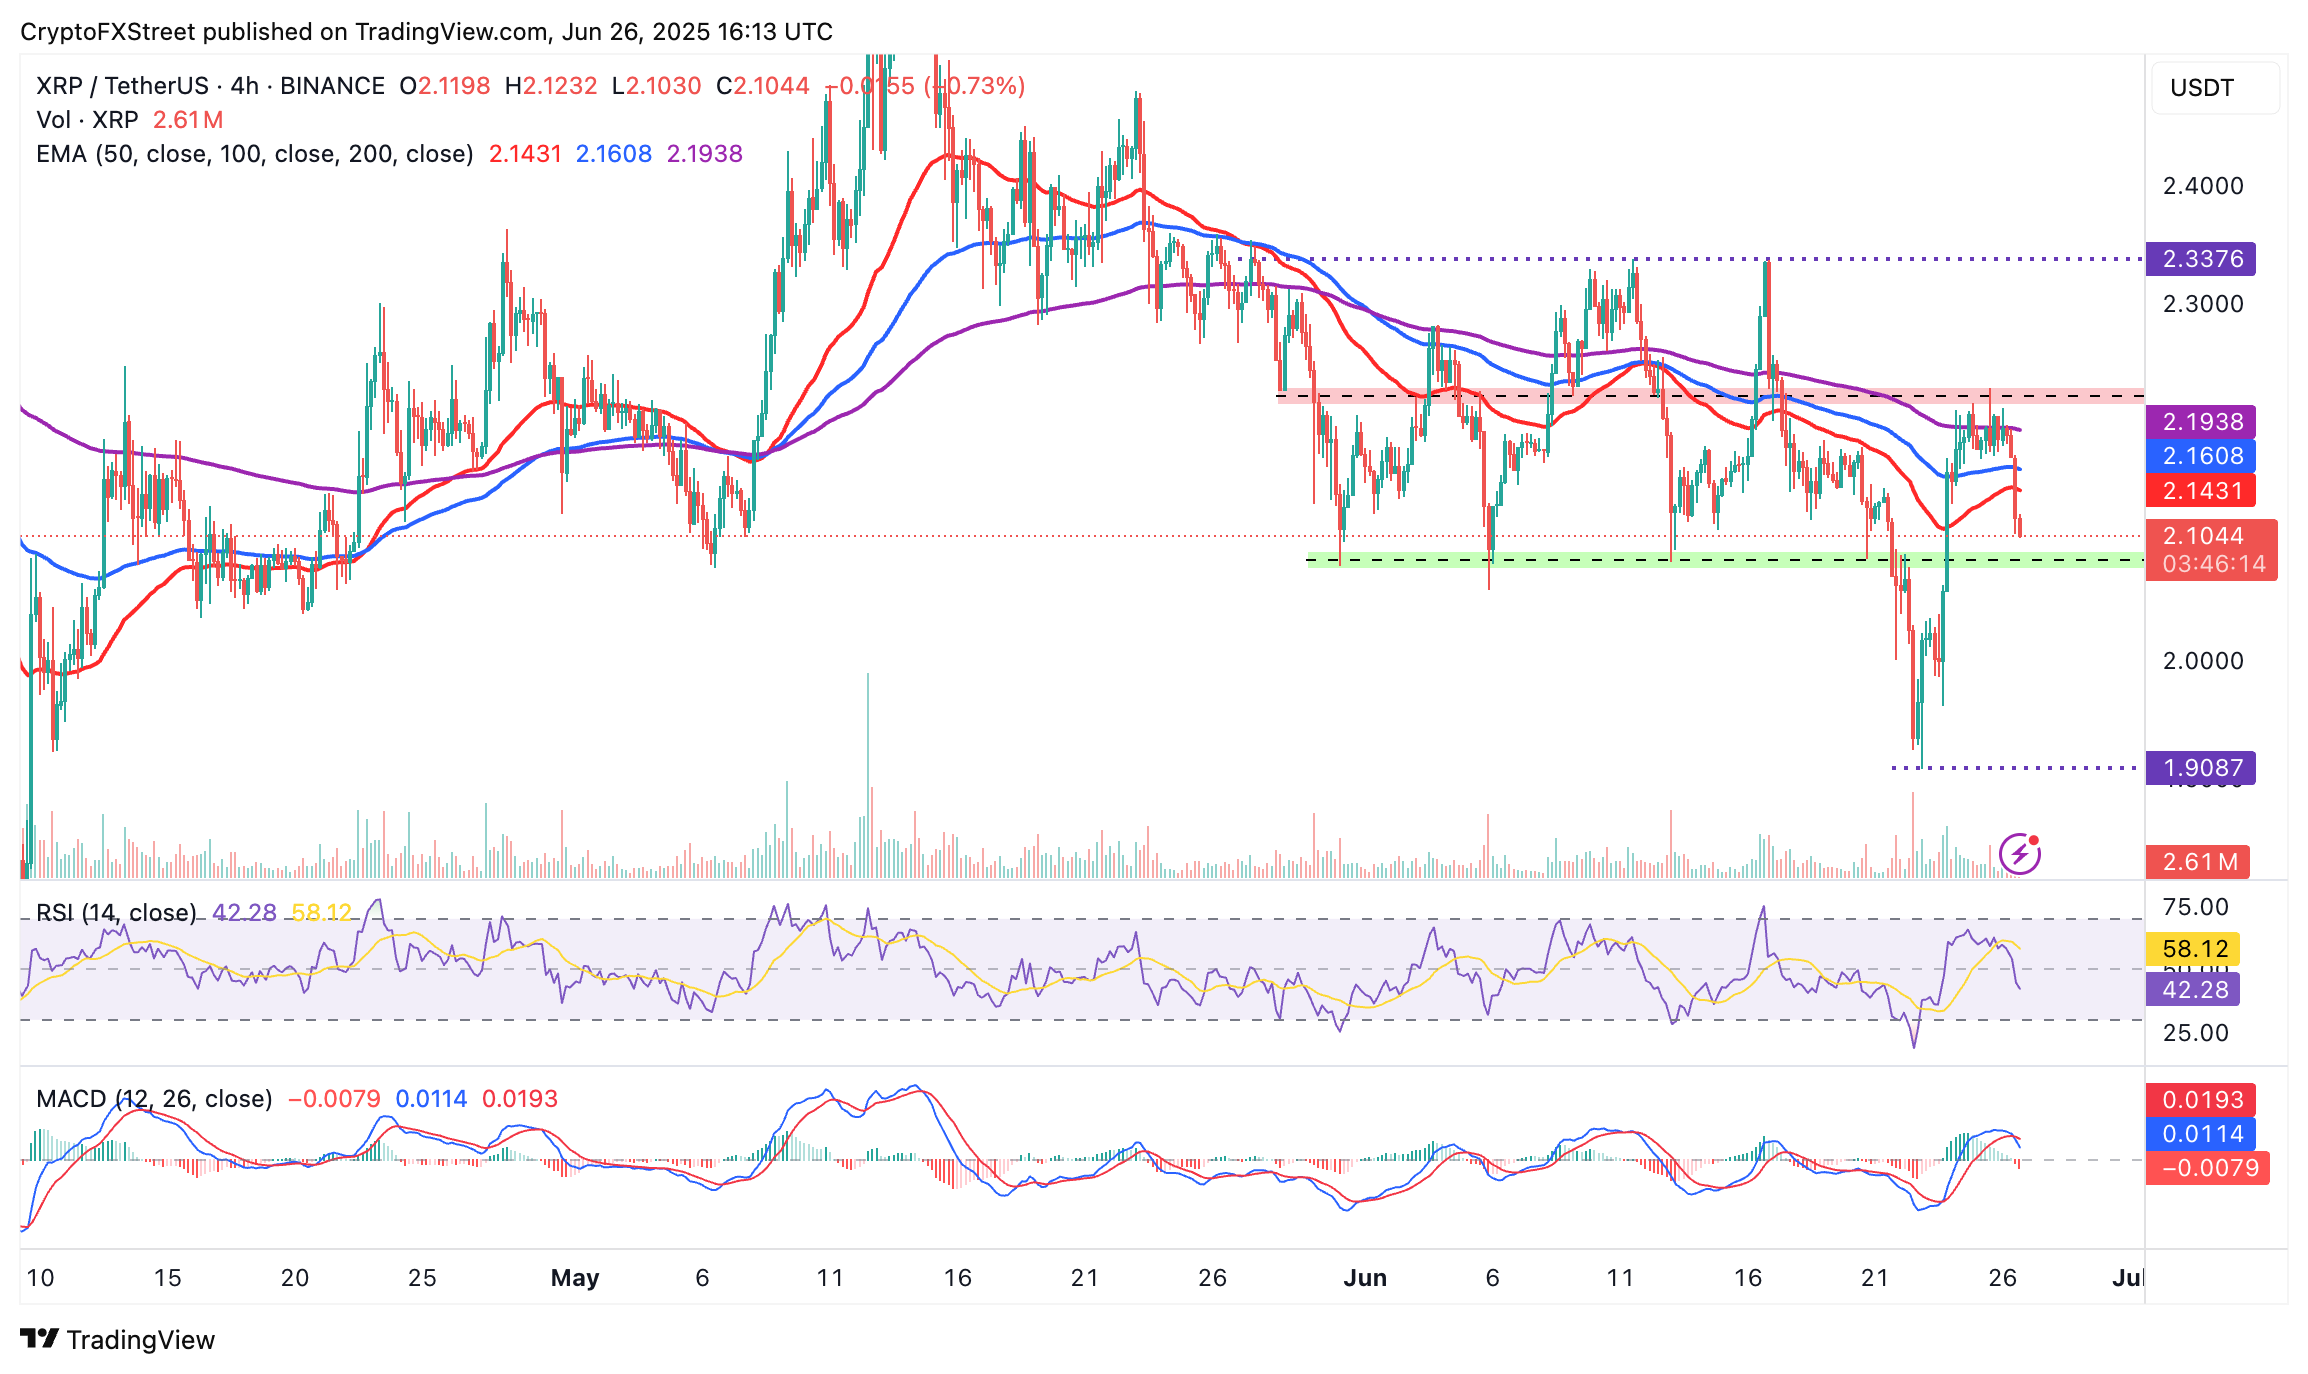
XRP’s price is falling toward support at around $2.09 following a rejection from its weekly top at approximately $2.22. A sell signal confirmed by the Moving Average Convergence Divergence (MACD) indicator on Thursday on the 4-hour chart indicates that sellers have the upper hand.
When the blue MACD line crosses below the red signal line, as the indicator drops toward the zero line, a risk-off sentiment often dominates, adding to the overhead pressure.
The position of the Relative Strength Index (RSI) below the midline suggests that selling pressure is gaining momentum. Should XRP fail to reverse the upward trend, the RSI will approach the oversold region, indicating bearish momentum.
XRP/USDT 4-hour chart
A reversal from the tentative support at $2.09 depends on sentiment in the broader crypto market. However, a flash drop below the $2.00 round-figure support cannot be ruled out just yet. This could be a key reason to have support at $1.90, last tested on Sunday and April’s downside levels at $1.80 and $1.60 in mind going forward.
Cryptocurrency prices FAQs
How do new token launches or listings affect cryptocurrency prices?
Token launches influence demand and adoption among market participants. Listings on crypto exchanges deepen the liquidity for an asset and add new participants to an asset’s network. This is typically bullish for a digital asset.
How do hacks affect cryptocurrency prices?
A hack is an event in which an attacker captures a large volume of the asset from a DeFi bridge or hot wallet of an exchange or any other crypto platform via exploits, bugs or other methods. The exploiter then transfers these tokens out of the exchange platforms to ultimately sell or swap the assets for other cryptocurrencies or stablecoins. Such events often involve an en masse panic triggering a sell-off in the affected assets.
How do macroeconomic releases and events affect cryptocurrency prices?
Macroeconomic events like the US Federal Reserve’s decision on interest rates influence crypto assets mainly through the direct impact they have on the US Dollar. An increase in interest rate typically negatively influences Bitcoin and altcoin prices, and vice versa. If the US Dollar index declines, risk assets and associated leverage for trading gets cheaper, in turn driving crypto prices higher.
How do major crypto upgrades like halvings, hard forks affect cryptocurrency prices?
Halvings are typically considered bullish events as they slash the block reward in half for miners, constricting the supply of the asset. At consistent demand if the supply reduces, the asset’s price climbs.

Log in to Reply
Log in to comment your thoughtsComments
Related Articles
|Square
Get the BTCC app to start your crypto journey
Get started today Scan to join our 100M+ users