🚀 Made in USA Crypto Stars: MOVE, XCN, KAS Set to Soar as Bullish Momentum Builds

American-made cryptos are stealing the spotlight—again. While Wall Street hedgies scramble to explain last quarter's losses, three homegrown tokens are printing gains with relentless momentum.
MOVE, XCN, and KAS aren't just holding their ground—they're gearing up for the next leg up. Here's why traders are flipping bullish on these domestic players.
The Momentum Play: When Algorithms Meet Patriotism
Forget the 'buy American' slogans—these tokens are moving on pure price action. Their charts show the kind of clean breakouts that make technical analysts drool into their triple-shot lattes.
Catalysts Ahead: More Than Just Flag-Waving
Real utility meets market timing. Whether it's MOVE's DeFi integrations or KAS's mining efficiency upgrades, these projects have substance behind the pumps—unlike certain meme coins we won't name (*cough* Doge knockoffs *cough*).
The bottom line? In a market where most 'made in USA' labels get sewn onto Chinese-made goods, these cryptos are the real deal—and they're not done running.
MOVE trend reversal gains traction
MOVE edges higher by 5% at press time on Thursday, extending the weekly gains to almost 60%. The uptrend crosses above the 50-day Exponential Moving Average at $0.1757 and the Supertrend indicator line, triggering the start of a new uptrend.
The recovery in Movement creates a new monthly high, at $0.2000 so far, and targets the $0.2540 resistance level, marked by the high of May 1.
Shifting to momentum indicators, the Moving Average Convergence/Divergence (MACD) indicator shows the MACD and signal line rising towards the zero line. Furthermore, the green histogram bars rising from the zero line indicate a surge in upward momentum.
The Relative Strength Index (RSI) is rising at 64, still below the overbought zone, which suggests bullish momentum could extend further.
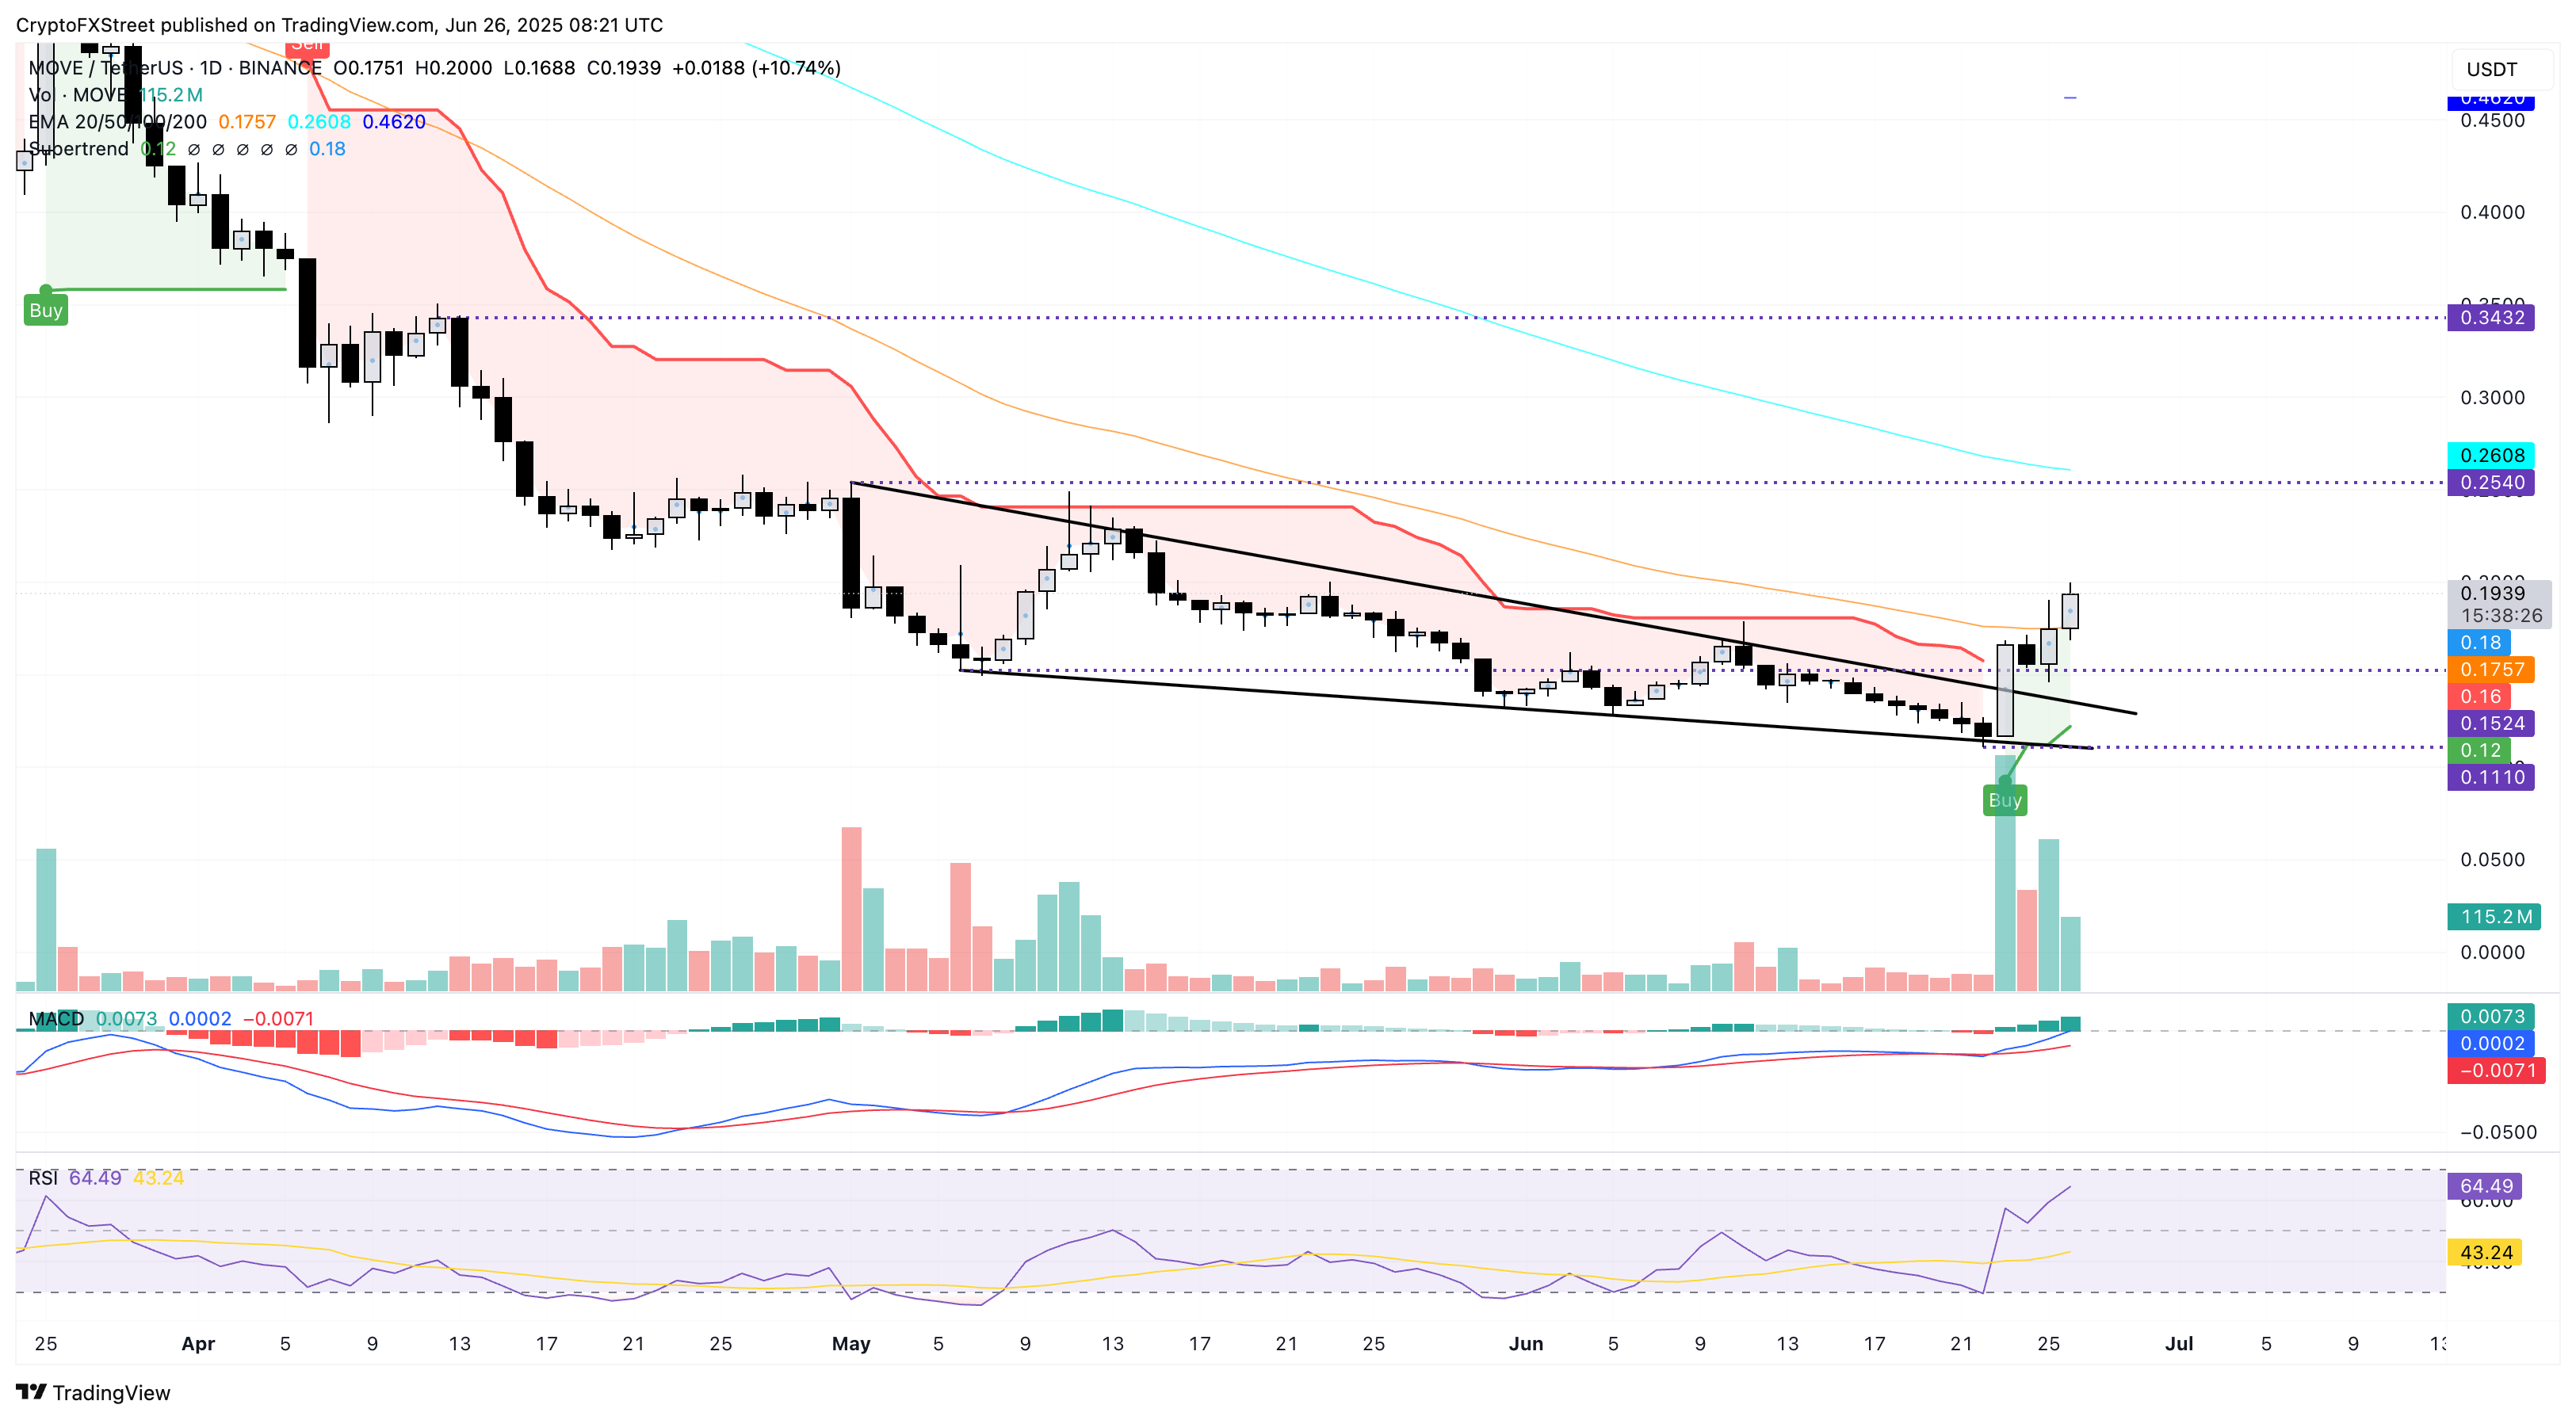
MOVE/USDT daily price chart.
If the "Made in USA" token fails to uphold the momentum, a reversal could test the $0.1524 support, last tested on Wednesday.
Onyxcoin recovery faces opposition at a key resistance trendline
Onyxcoin is trading in the green with a 1.35% surge at the time of writing, printing its fourth consecutive bullish candle. As XCN surpasses the 50-day and 100-day EMAs NEAR $0.01560, it challenges a multi-month resistance trendline formed by the highs on January 26, April 11, May 16 and June 25.
A clean push in daily close above Wednesday’s high at $0.01699 will mark the trendline breakout. Investors could view the breakout as an entry opportunity, targeting the 50% Fibonacci retracement level at $0.01943, which is drawn between the year-to-date high and low at $0.05000 and $0.00755.
The MACD indicator displays a surge in the MACD and signal lines, suggesting a rise in momentum as XCN recovers.
Adding credence to rising momentum, the RSI at 57 has crossed above the halfway line, approaching overbought conditions.
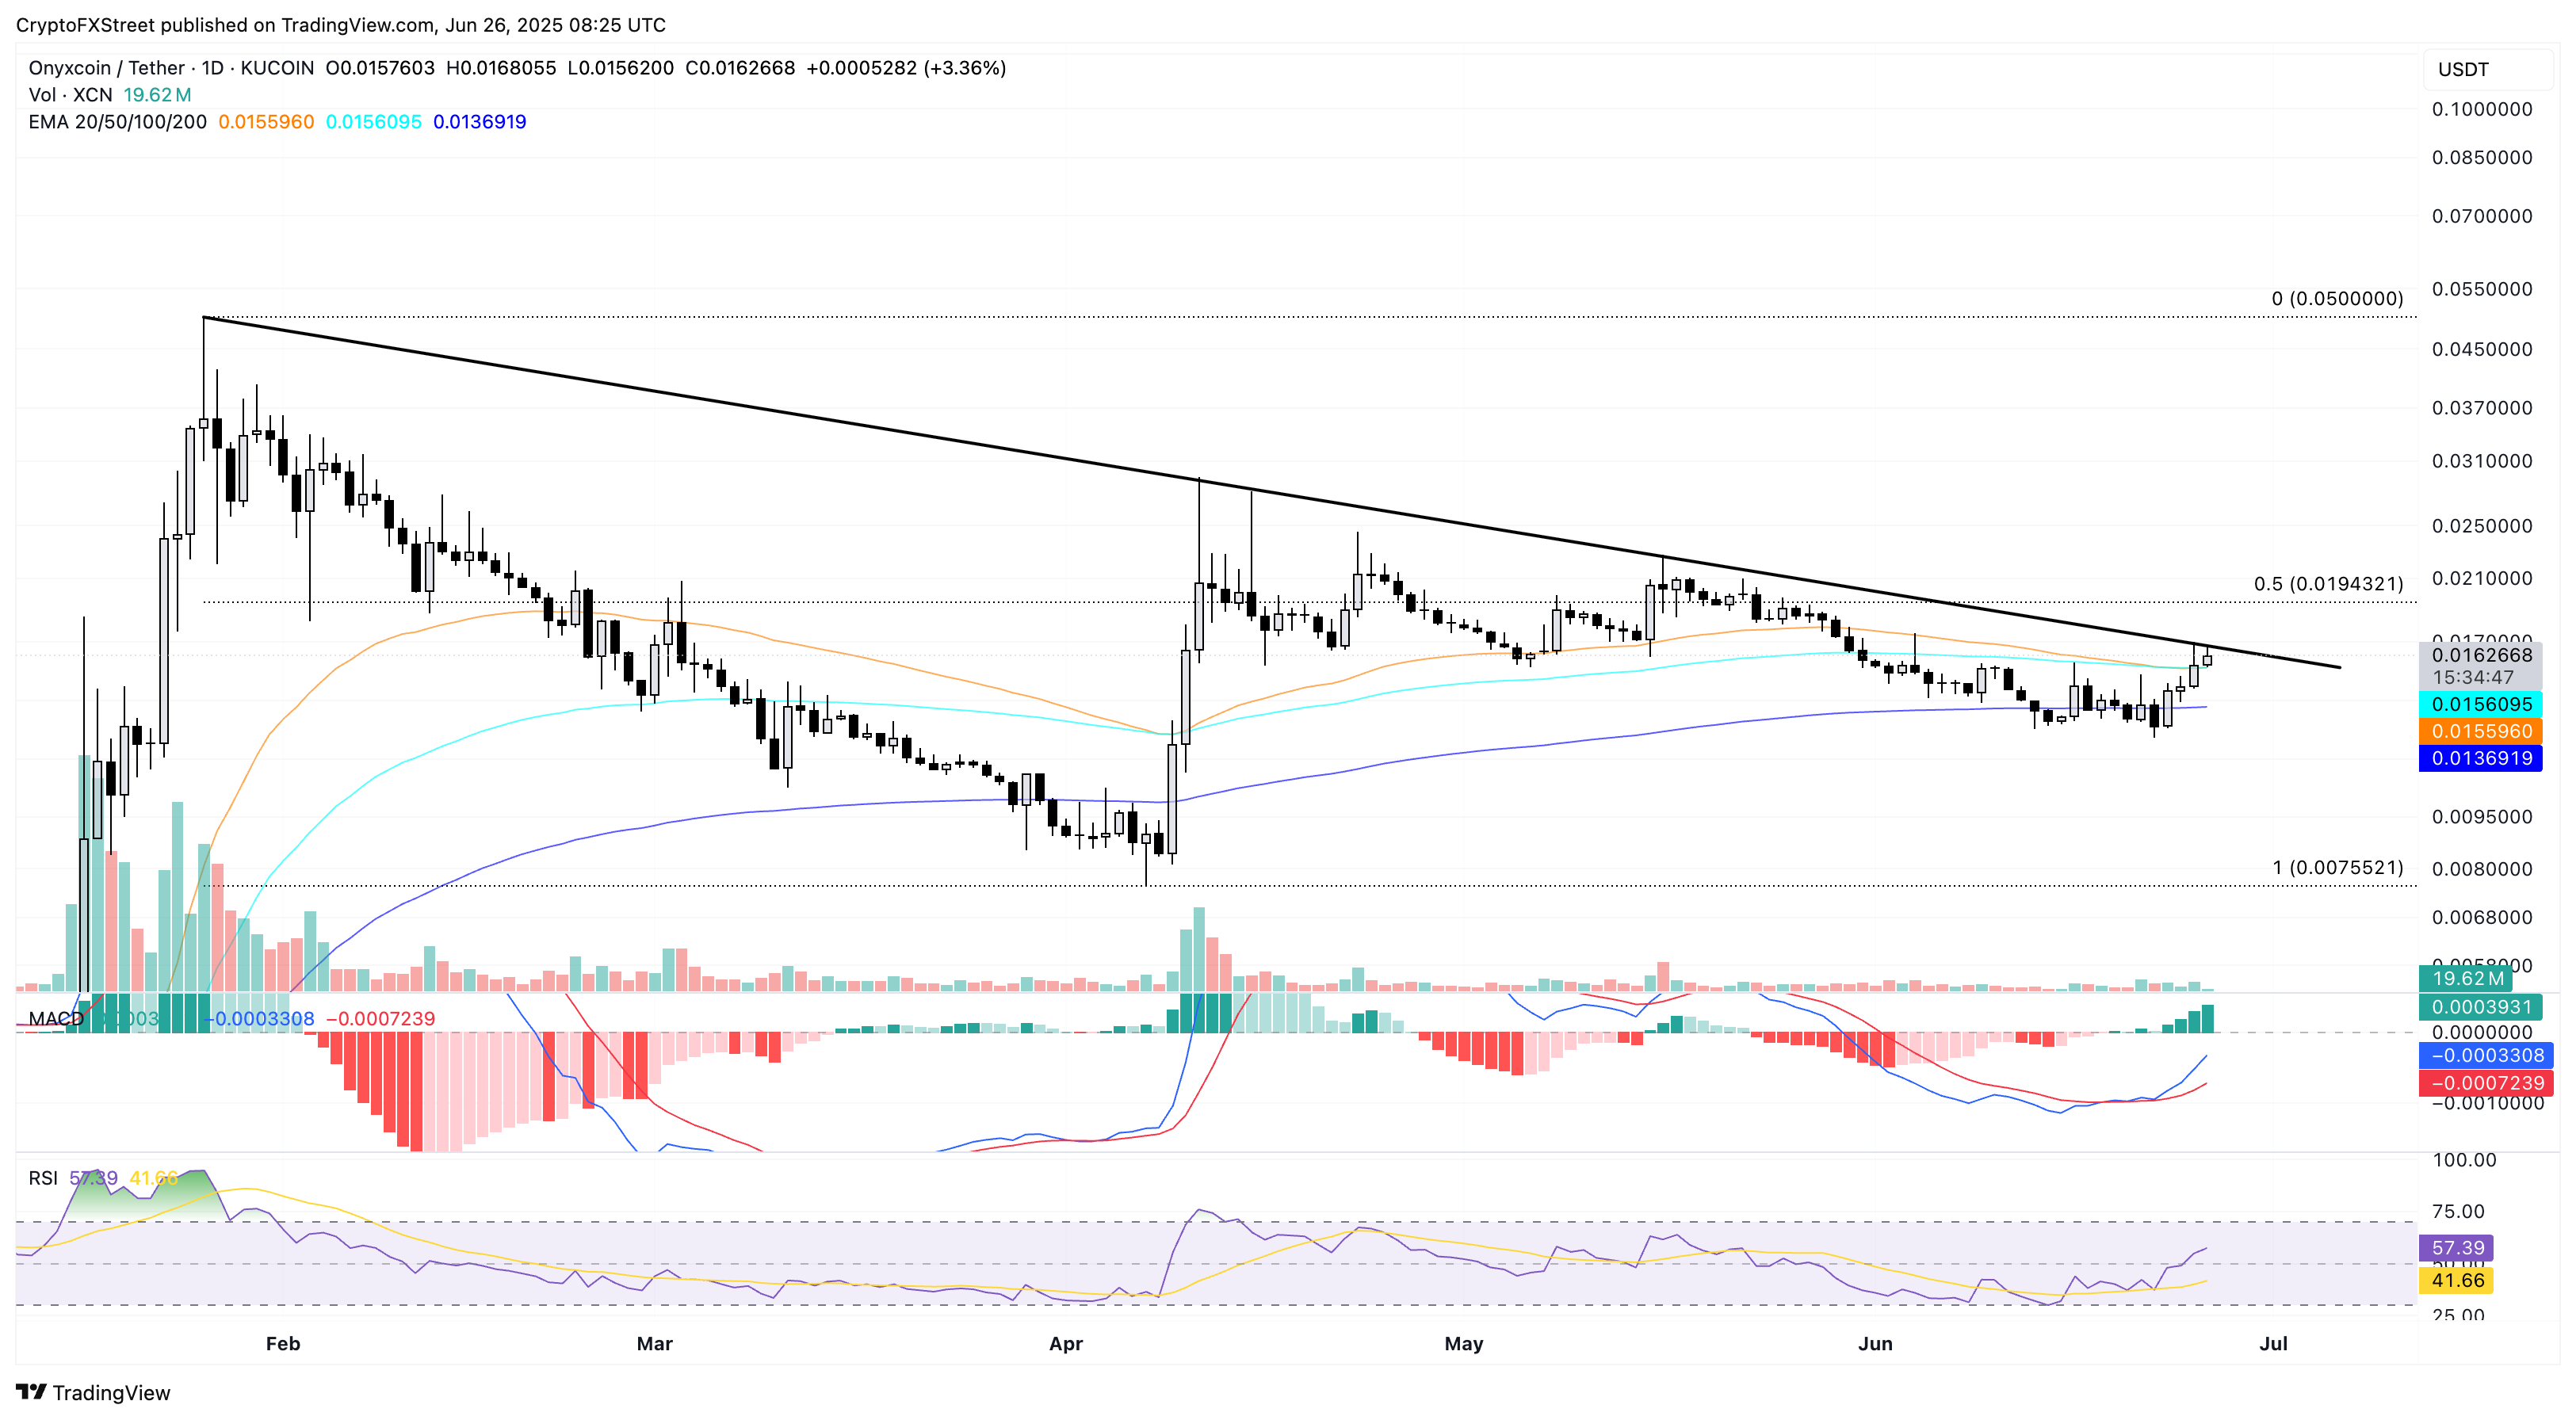
XCN/USDT daily price chart.
However, a potential rebound under the trendline could test the 200-day EMA at $0.01369.
Kaspa eyes further gains as bearish momentum declines
Kaspa heads higher by 1.30% at press time on Thursday, pushing the weekly growth to almost 22%. KAS etched a V-shaped reversal from a local support trendline joined by the daily close on May 31 and June 22.
Adding to this, the recovery surpassed an overhead trendline connected by swing highs on May 12, May 22 and June 11, marking a wedge pattern breakout. The breakout rally targets the June 16 high at $0.08298. A close above this level could target the highest closing in June at $0.09063.
The MACD indicator flashed a buy signal on Tuesday as the MACD line crossed above its signal line. Further up, the RSI is at 49, drawing closer to the midline, which suggests that the bearish momentum is waning.
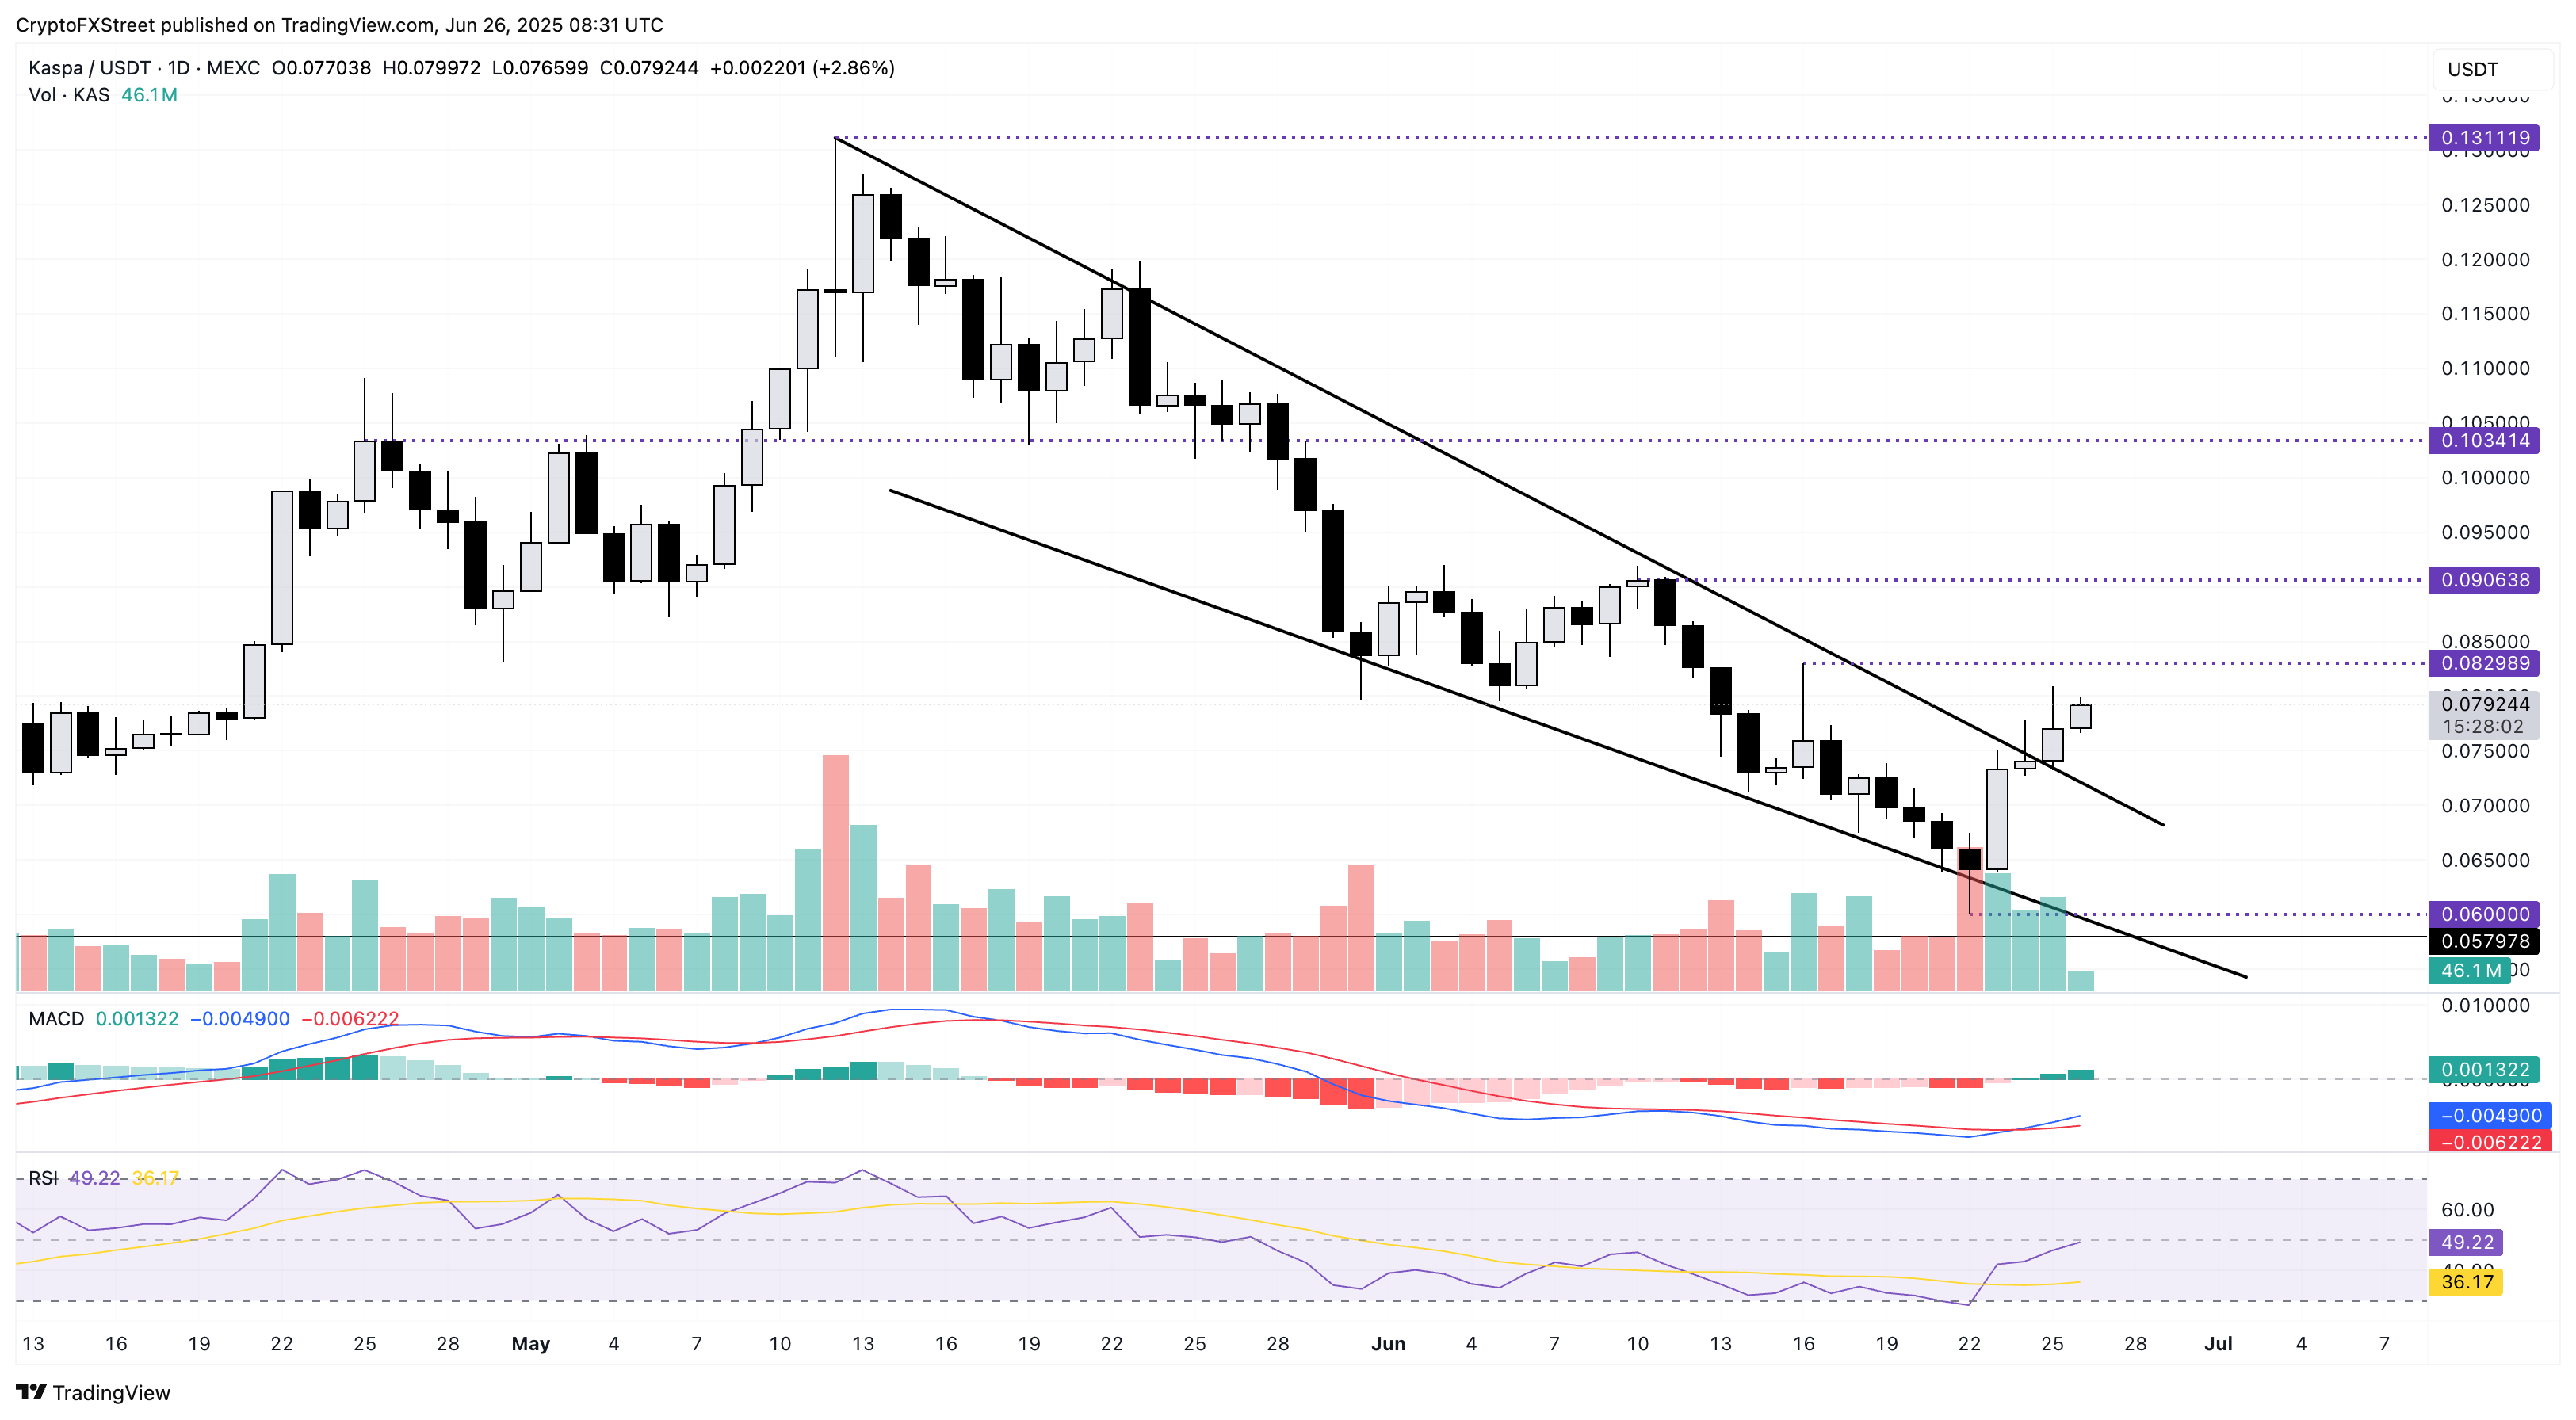
KAS/USDT daily price chart.
However, a daily close below Tuesday’s opening of $0.07405 could test the weekly low at $0.060 round figure.
