Stellar (XLM) Primed for Double-Digit Surge as Derivatives Signal Bullish Stampede

Stellar's derivatives market flashes green as traders pile into bullish bets—could this be the launchpad for a major XLM breakout?
Derivatives data reveals a surge in long positions, with open interest and funding rates pointing to aggressive optimism. The last time these metrics aligned like this, XLM ripped a 40% monthly gain.
Why the frenzy? Smart money's betting Stellar's low transaction costs and institutional partnerships will steal market share during the next altseason. That, or everyone's just chasing the 37th crypto by market cap because... well, this is crypto.
Technical setup shows XLM coiled like a spring above key support. A clean break above $0.35 could trigger algorithmic buying cascades—liquidity pools above current levels look thinner than a DeFi project's security audit.
Of course, in a market where 'fundamentals' means whatever narrative pumps your bags, even the SEC might struggle to explain why a payments token needs 50% weekly swings. But hey—when the leverage flows, nobody asks questions until the margin calls hit.
Stellar eyes breakout as derivatives signal bullish momentum
Stellar’s Coinglass long-to-short ratio reads 1.11 on Thursday, the highest level in over a month. This ratio, above one, reflects bullish sentiment in the markets, as more traders are betting on the XLM price to rise.
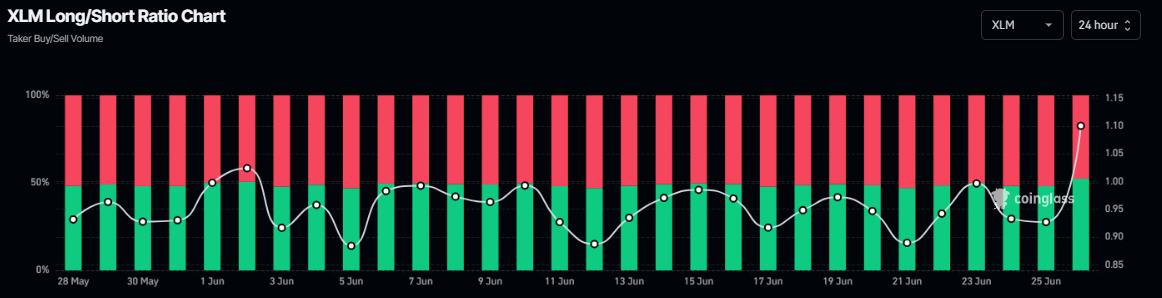
XLM long-to-short ratio chart. Source: Coinglass
Another bullish sign for XLM is that its funding rates data turned positive on Thursday. CoinGlass’s OI-Weighted Funding Rate data shows that the number of traders betting that the price of XLM coin will slide further is lower than that anticipating a price increase. Generally, a positive rate (longs pay shorts) indicates bullish sentiment, while negative numbers (shorts pay longs) indicate bearishness.
The metric has flipped to a positive rate and reads 0.0007% on Wednesday, indicating that longs are paying shorts. Generally, as shown in the chart below, when funding rates have flipped from negative to positive and have remained positive, the XLM price has rallied sharply.
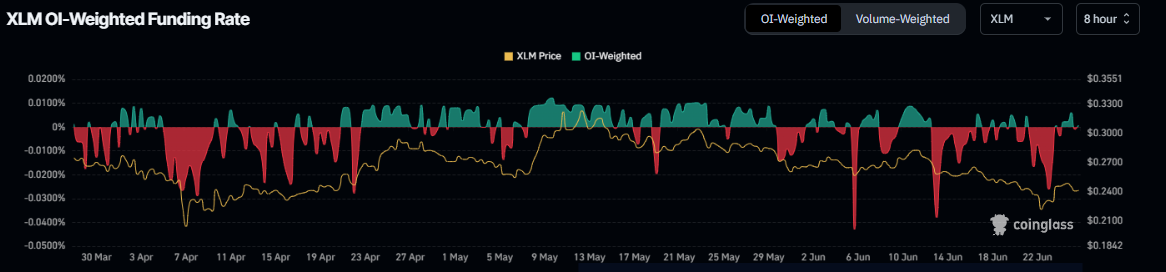
Stellar’s OI-Weighted Funding Rate chart. Source: Coinglass
Stellar Price Forecast: XLM on the verge of a breakout
Stellar price closed below the daily support at $0.253 last week and declined by 11.52%, subsequently retesting the weekly support on Sunday. However, at the start of this week, it recovered 8.6% until Tuesday but faced a slight correction the next day. At the time of writing on Thursday, it hovers around $0.241.
If XLM recovers, breaks, and closes above the daily resistance at $0.253, it could extend the rally by 12% from the daily level to retest its high of $0.285.
The Relative Strength Index (RSI) reads 40 after recovering from its overbought conditions this week, indicating fading bearish momentum. However, for the bullish momentum to be sustained, the RSI must move above its neutral level of 50 to initiate a recovery rally. The Moving Average Convergence Divergence (MACD) is hinting at a bullish crossover (the MACD line is close to crossing above the signal line), which, if completed, WOULD give a buy signal.
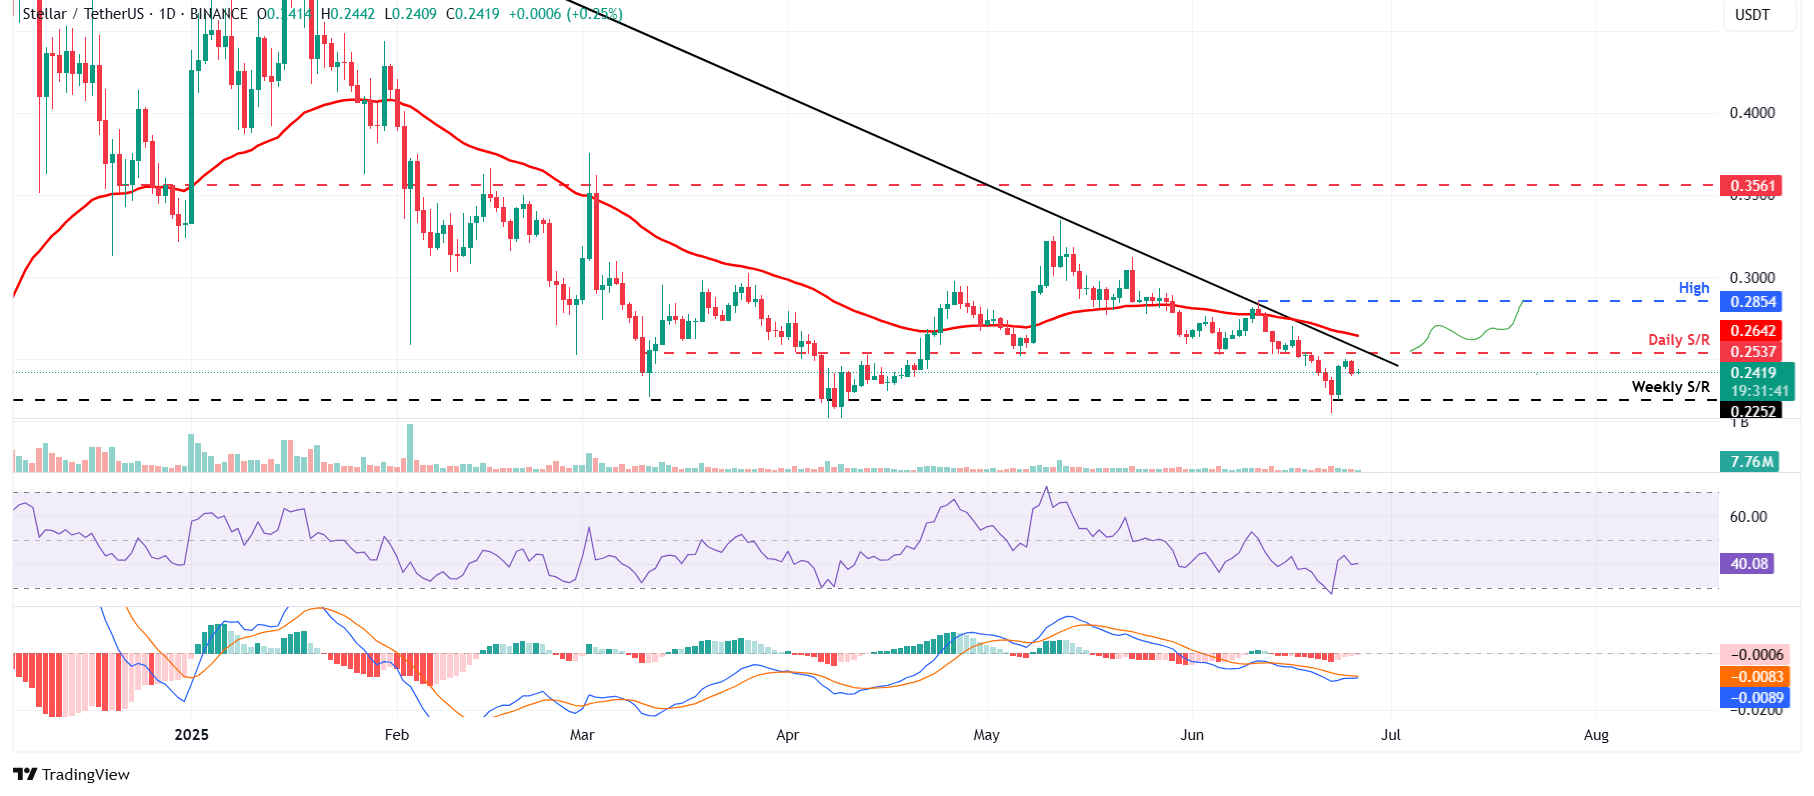
XLM/USDT daily chart
However, if XLM faces a correction, it could extend the decline to retest its weekly support at $0.225.
