🚀 SEI, SYRUP, APT Surge: ’Made in America’ Crypto Rally Defies Market Gravity

Forget Wall Street’s blue chips—today’s action is in homegrown crypto tokens. SEI, SYRUP, and APT are smoking the competition as traders pile into US-centric projects. Here’s why the smart money’s betting local.
The Patriot Portfolio Pump
No need for offshore gambles when domestic tokens are delivering double-digit fireworks. SEI’s infrastructure play, SYRUP’s DeFi sugar rush, and APT’s institutional cred are drawing blood from lagging majors. Even the SEC’s lawyers can’t kill this momentum.
FOMO Meets Fundamentals
Behind the hype? Real adoption. US-based devs are shipping code faster than Congress prints money—with actual utility to show for it. The ‘Buy American’ crypto crowd isn’t just waving flags; they’re cashing checks.
Caveat Emptor
Let’s not pretend this isn’t partly a tax-dodging, regulation-arbitrage play. But when the gains are this juicy, even your CFA-holding uncle might peek from behind his Bloomberg Terminal. Just remember: what moons fast can crater faster—especially when the Fed starts snooping around.
SEI outpaces the broader market, targets $0.3642
SEI trades in the green by over 5% at press time on Wednesday, hitting a two-month high with its third consecutive daily green candle. The Made in America token outpaces the broader market recovery, with an almost 65% jump so far this week.
With a daily close above $0.2923, the March high, SEI eyes further gains to the $0.3642 level, marked by the January 14 close.
The Moving Average Convergence/Divergence (MACD) indicator shows the MACD and signal line trending higher above the zero line. Coupled with the expanding green histogram bars, the indicator flashes a buy signal.
The Relative Strength Index (RSI) indicates a significant surge in buying pressure as it reaches overbought conditions at 78. However, investors must remain cautious as reversals are more likely to occur in overbought conditions.
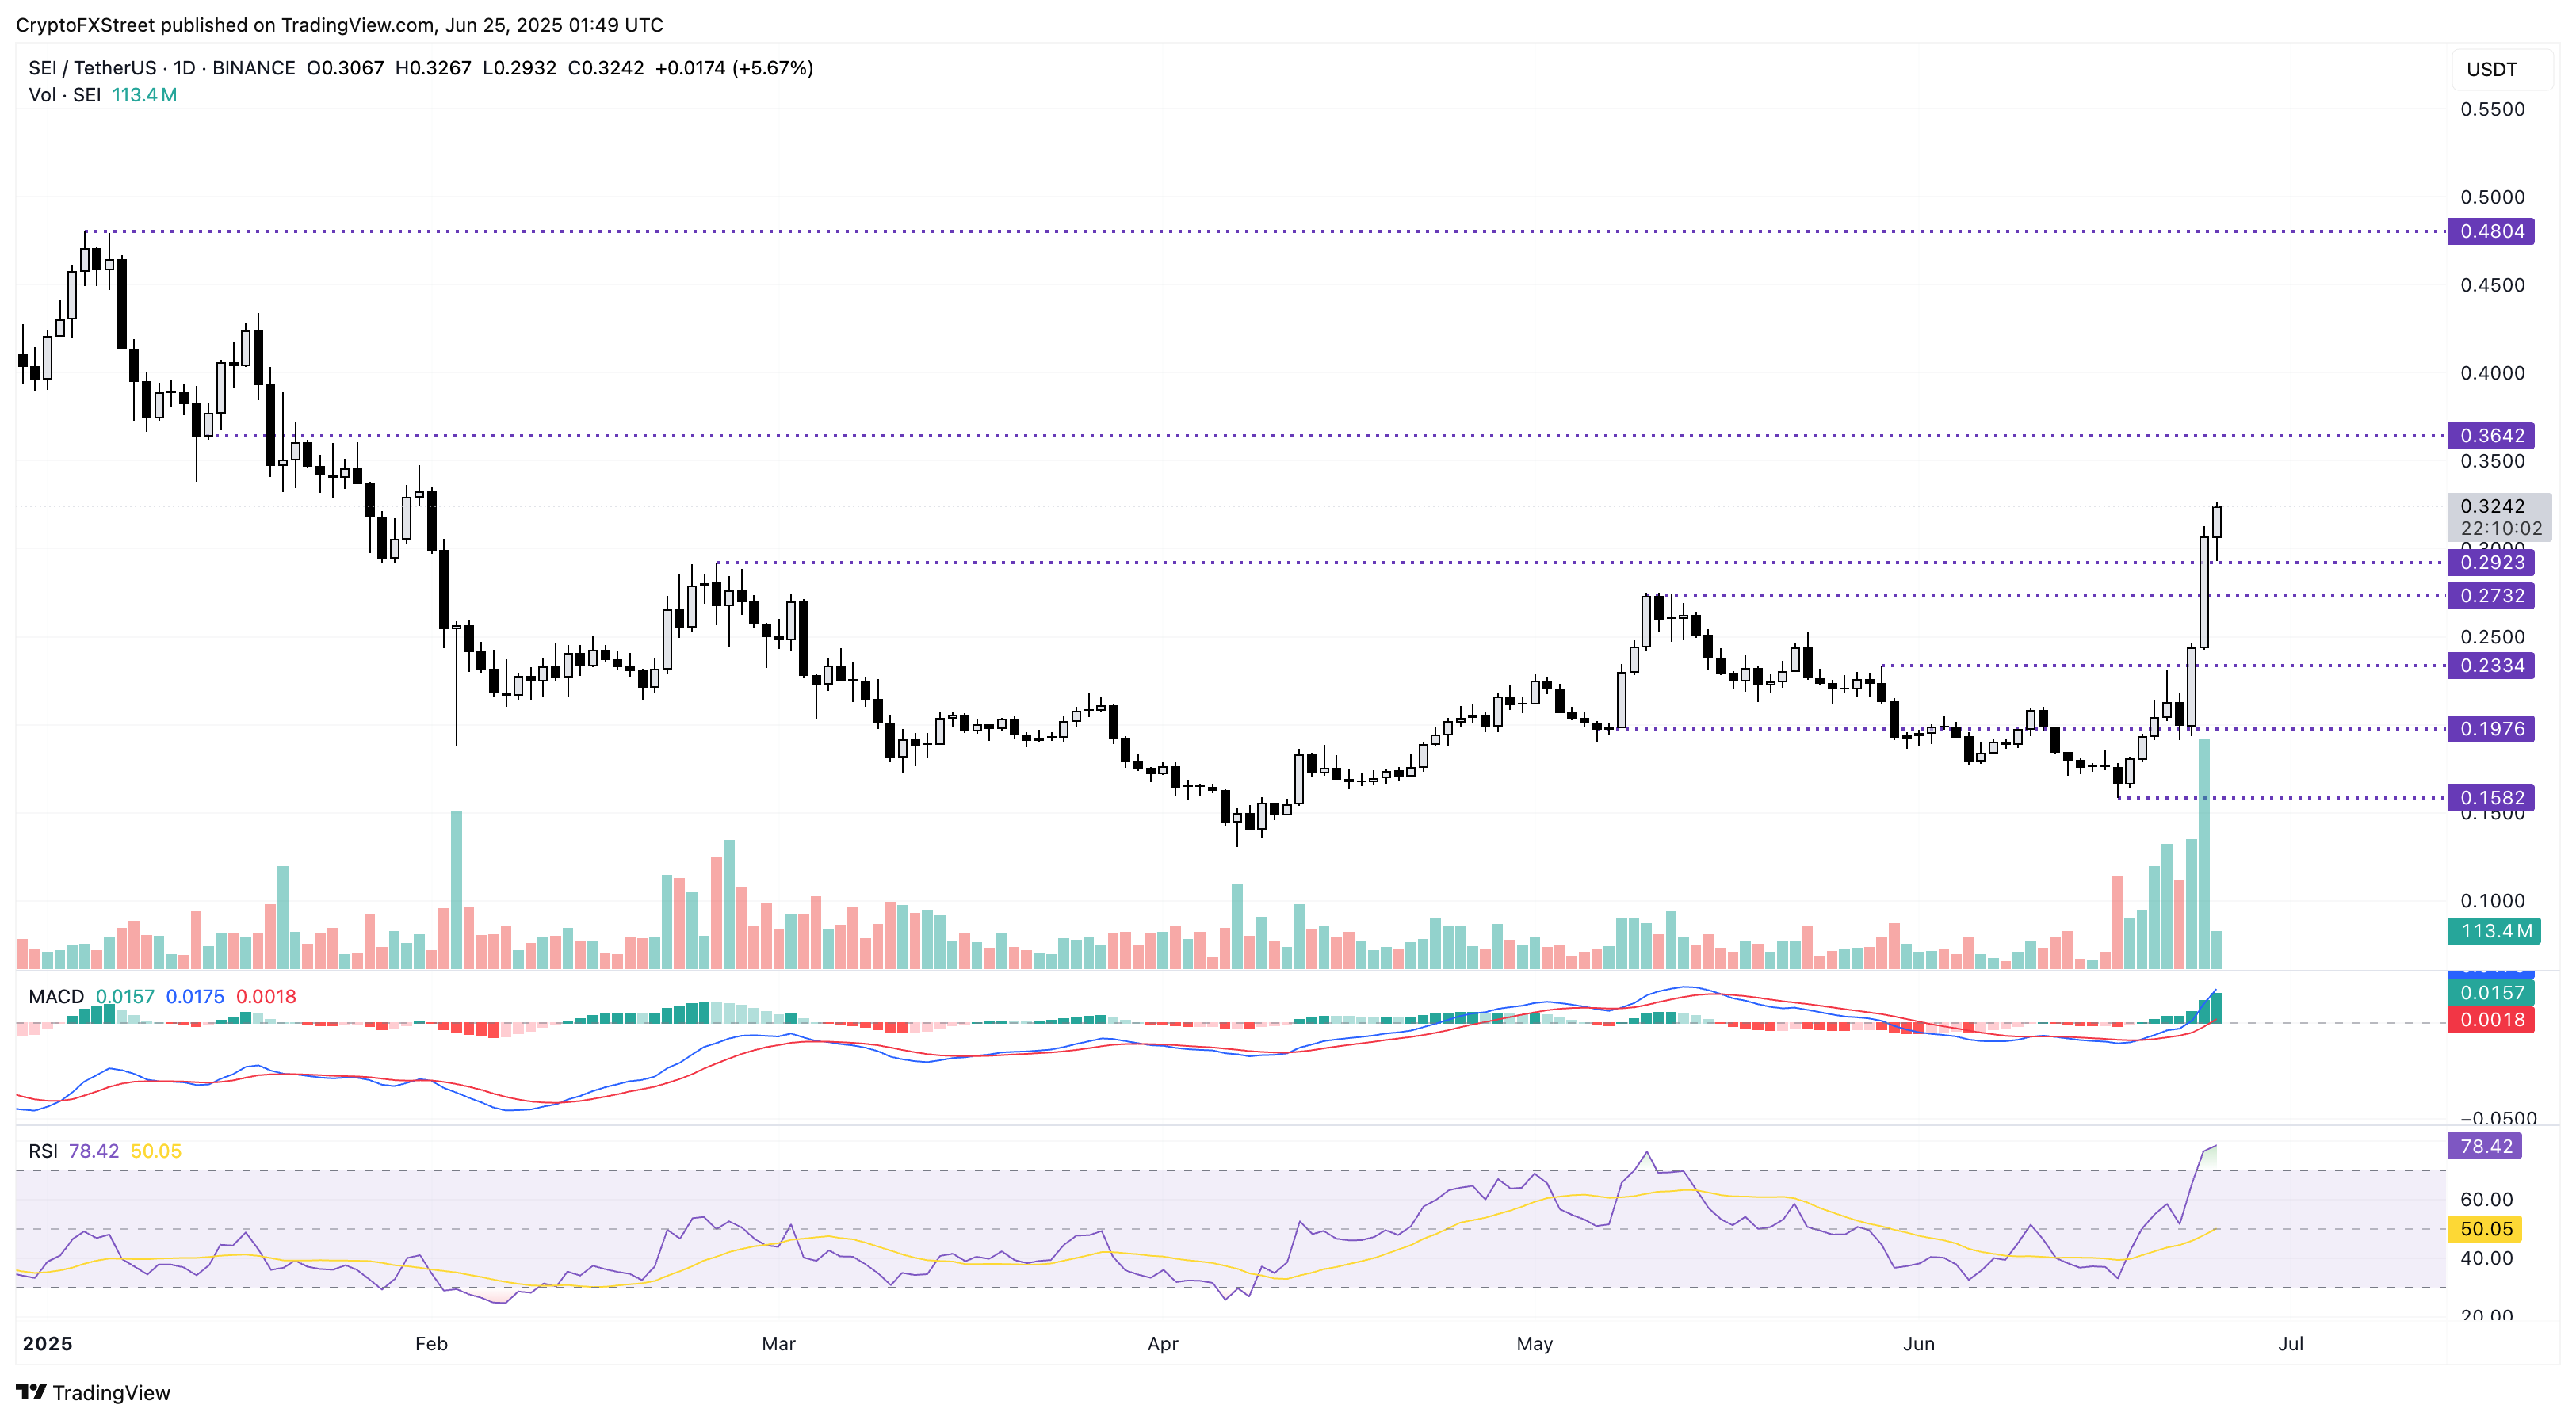
SEI/USDT daily price chart.
If a reversal in Sei closes below $0.2923, it could further decline towards $0.2732 support level marked by the highest price in May.
SYRUP hits all-time high, eyes $0.80
SYRUP records a new all-time high of $0.60, with an over 6% surge at press time on Wednesday. With three consecutive bullish candles, the SYRUP token has surpassed the overhead trendline formed by the swing highs on May 25, June 11, and June 16.
A potential closing above the trendline will mark a rising channel breakout formed by a parallel support connected by May 7, May 31, and June 22. As per the Pivot Points Standard indicator, the breakout rally could target the R2 level at $0.63, followed by R3 at $0.80.
The MACD indicator flashes a buy signal as the MACD line crosses above the signal line, triggering the rise of green histogram bars from the zero line.
The RSI approaches the overbought boundary, indicating a surge in buying pressure.
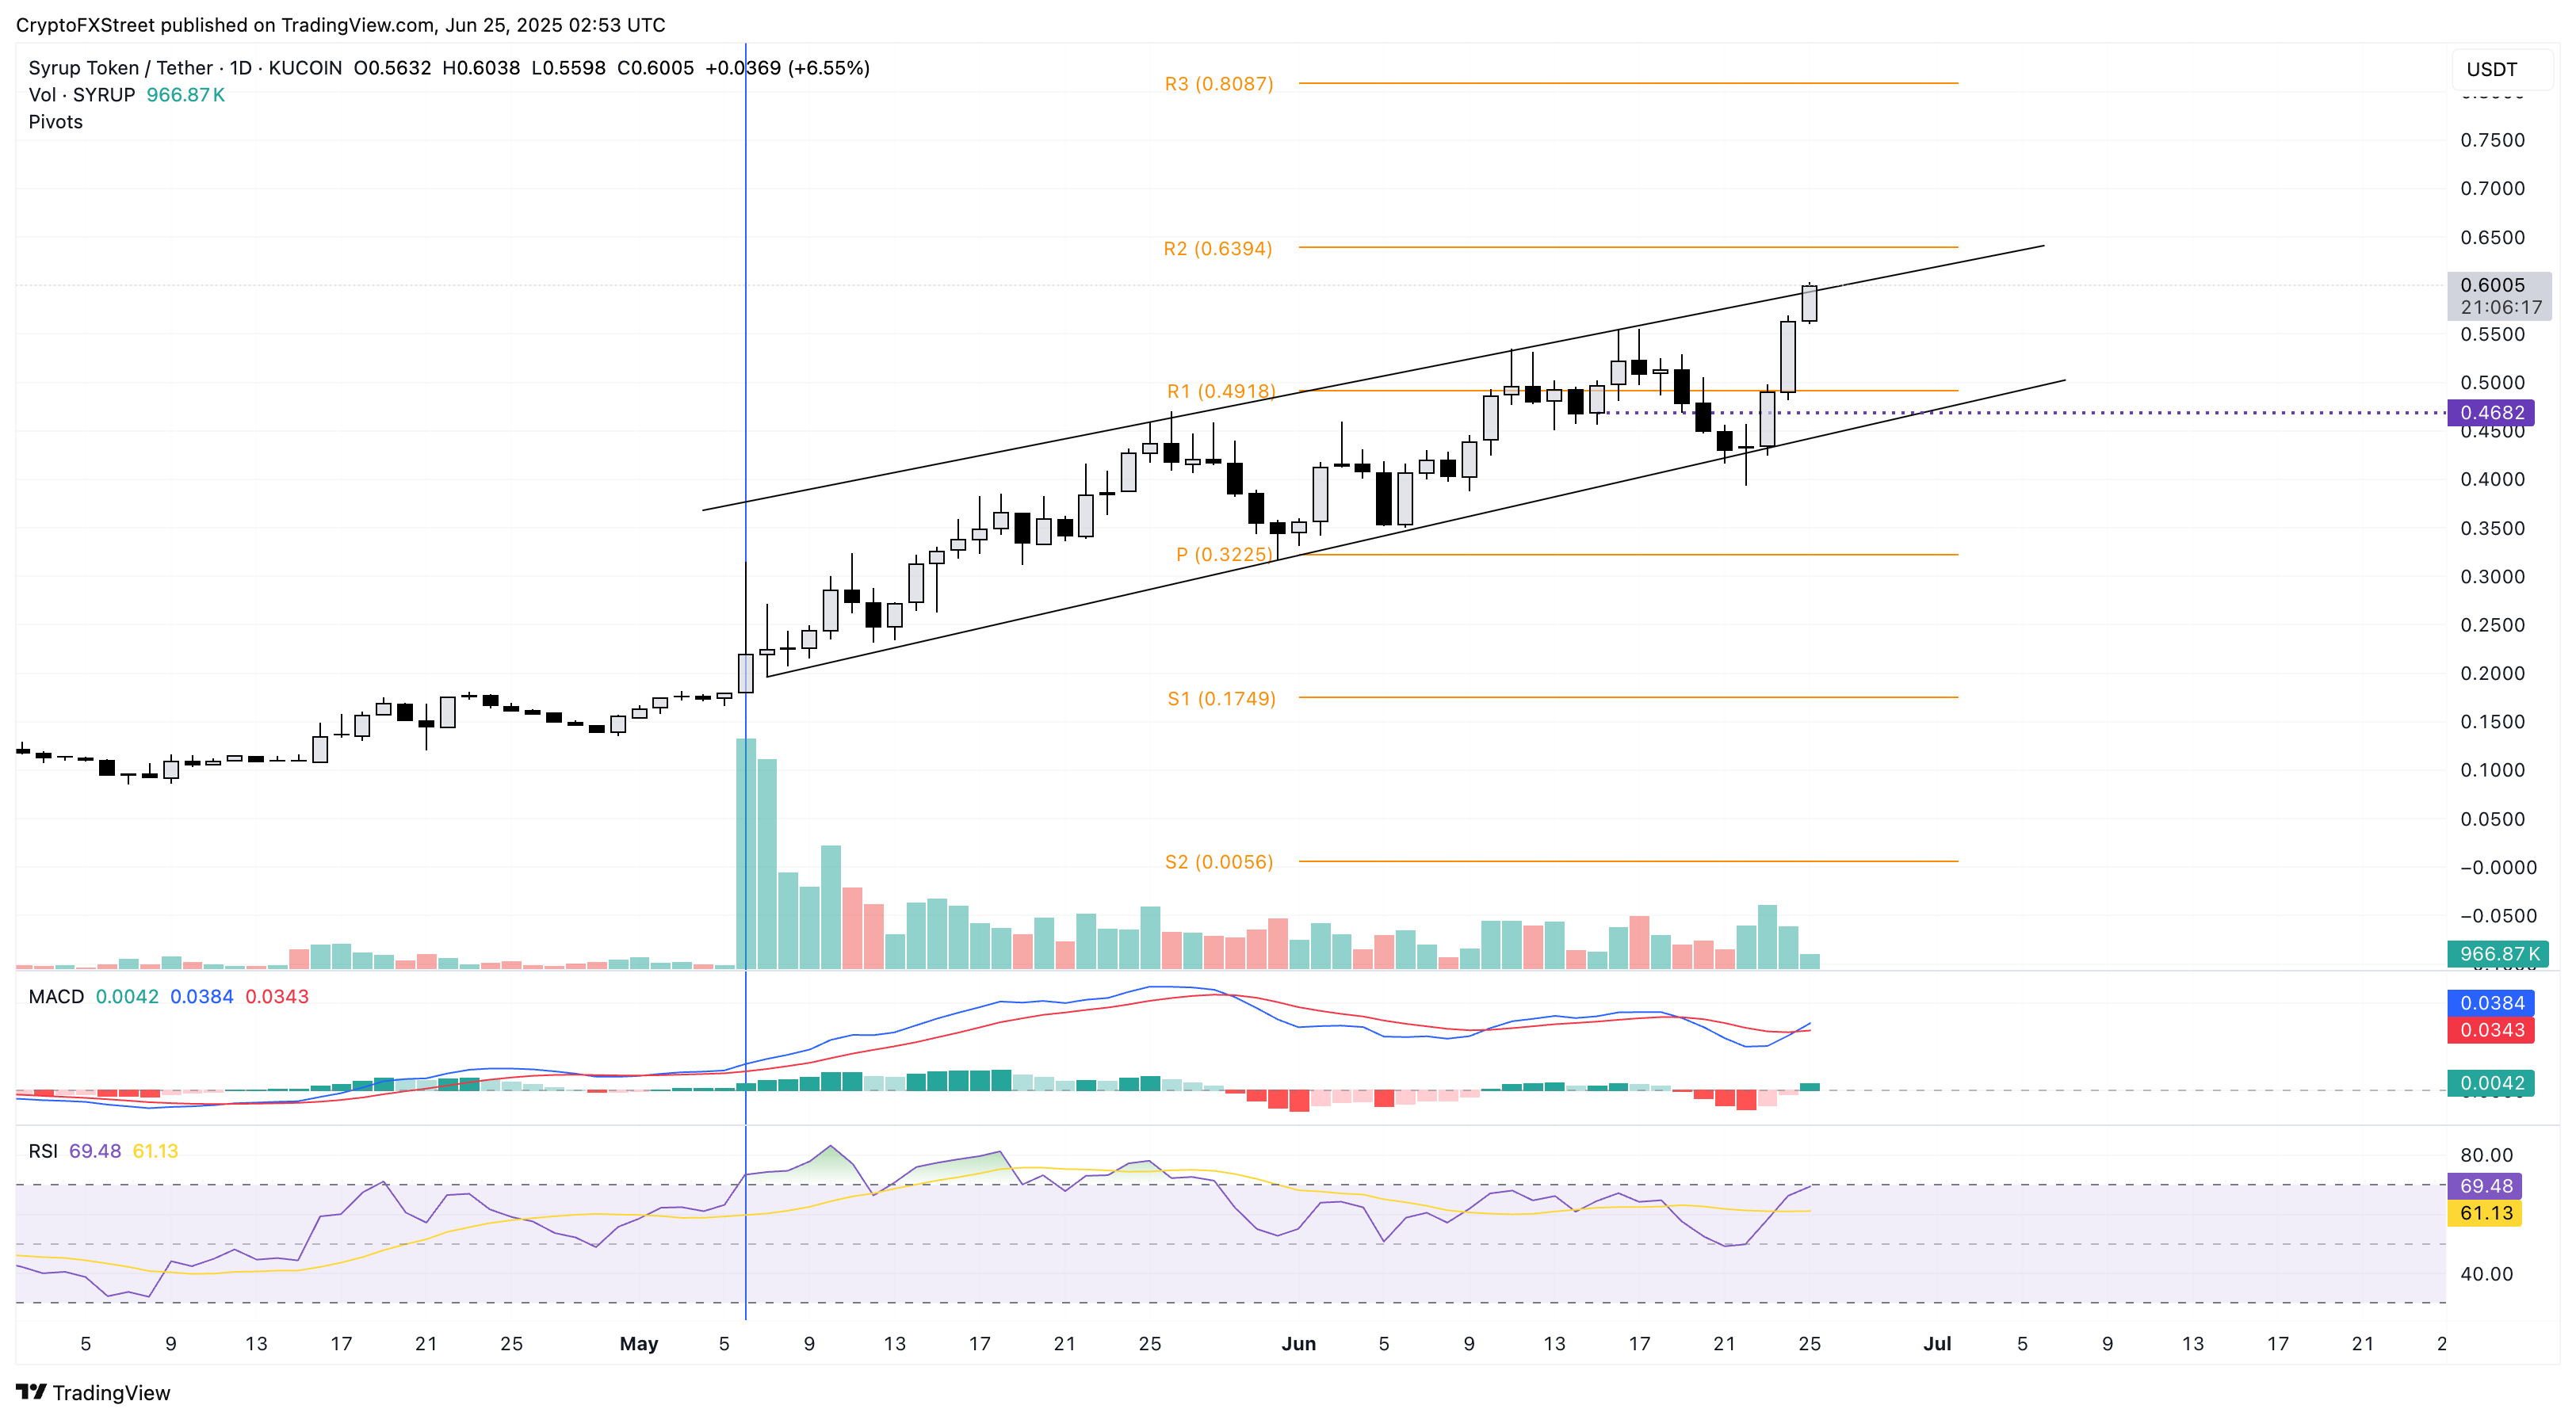
SYRUP/USDT daily price chart.
However, a closing below the trendline under $0.60 could reinforce a pullback within the channel towards the R1 level at $0.49.
Aptos recovery gains traction within a channel
Aptos edges lower by 1% at press time on Wednesday, a breather following the 28% surge on the previous two days. The rising demand for Made in America tokens propels APT from a support trendline formed by the bottoms on February 3, April 6, and June 22.
Price action forms a falling channel pattern with an overhead parallel trendline extrapolated from March 2 and May 13. The short-term recovery in Aptos this week aims at the overhead trendline near $5.72.
The MACD indicator shows the MACD line crossing above its signal line, generally considered a buy signal for investors. Supporting the bullish thesis, the RSI indicates a rise in buying pressure as it takes a V-shaped reversal from the oversold boundary line.
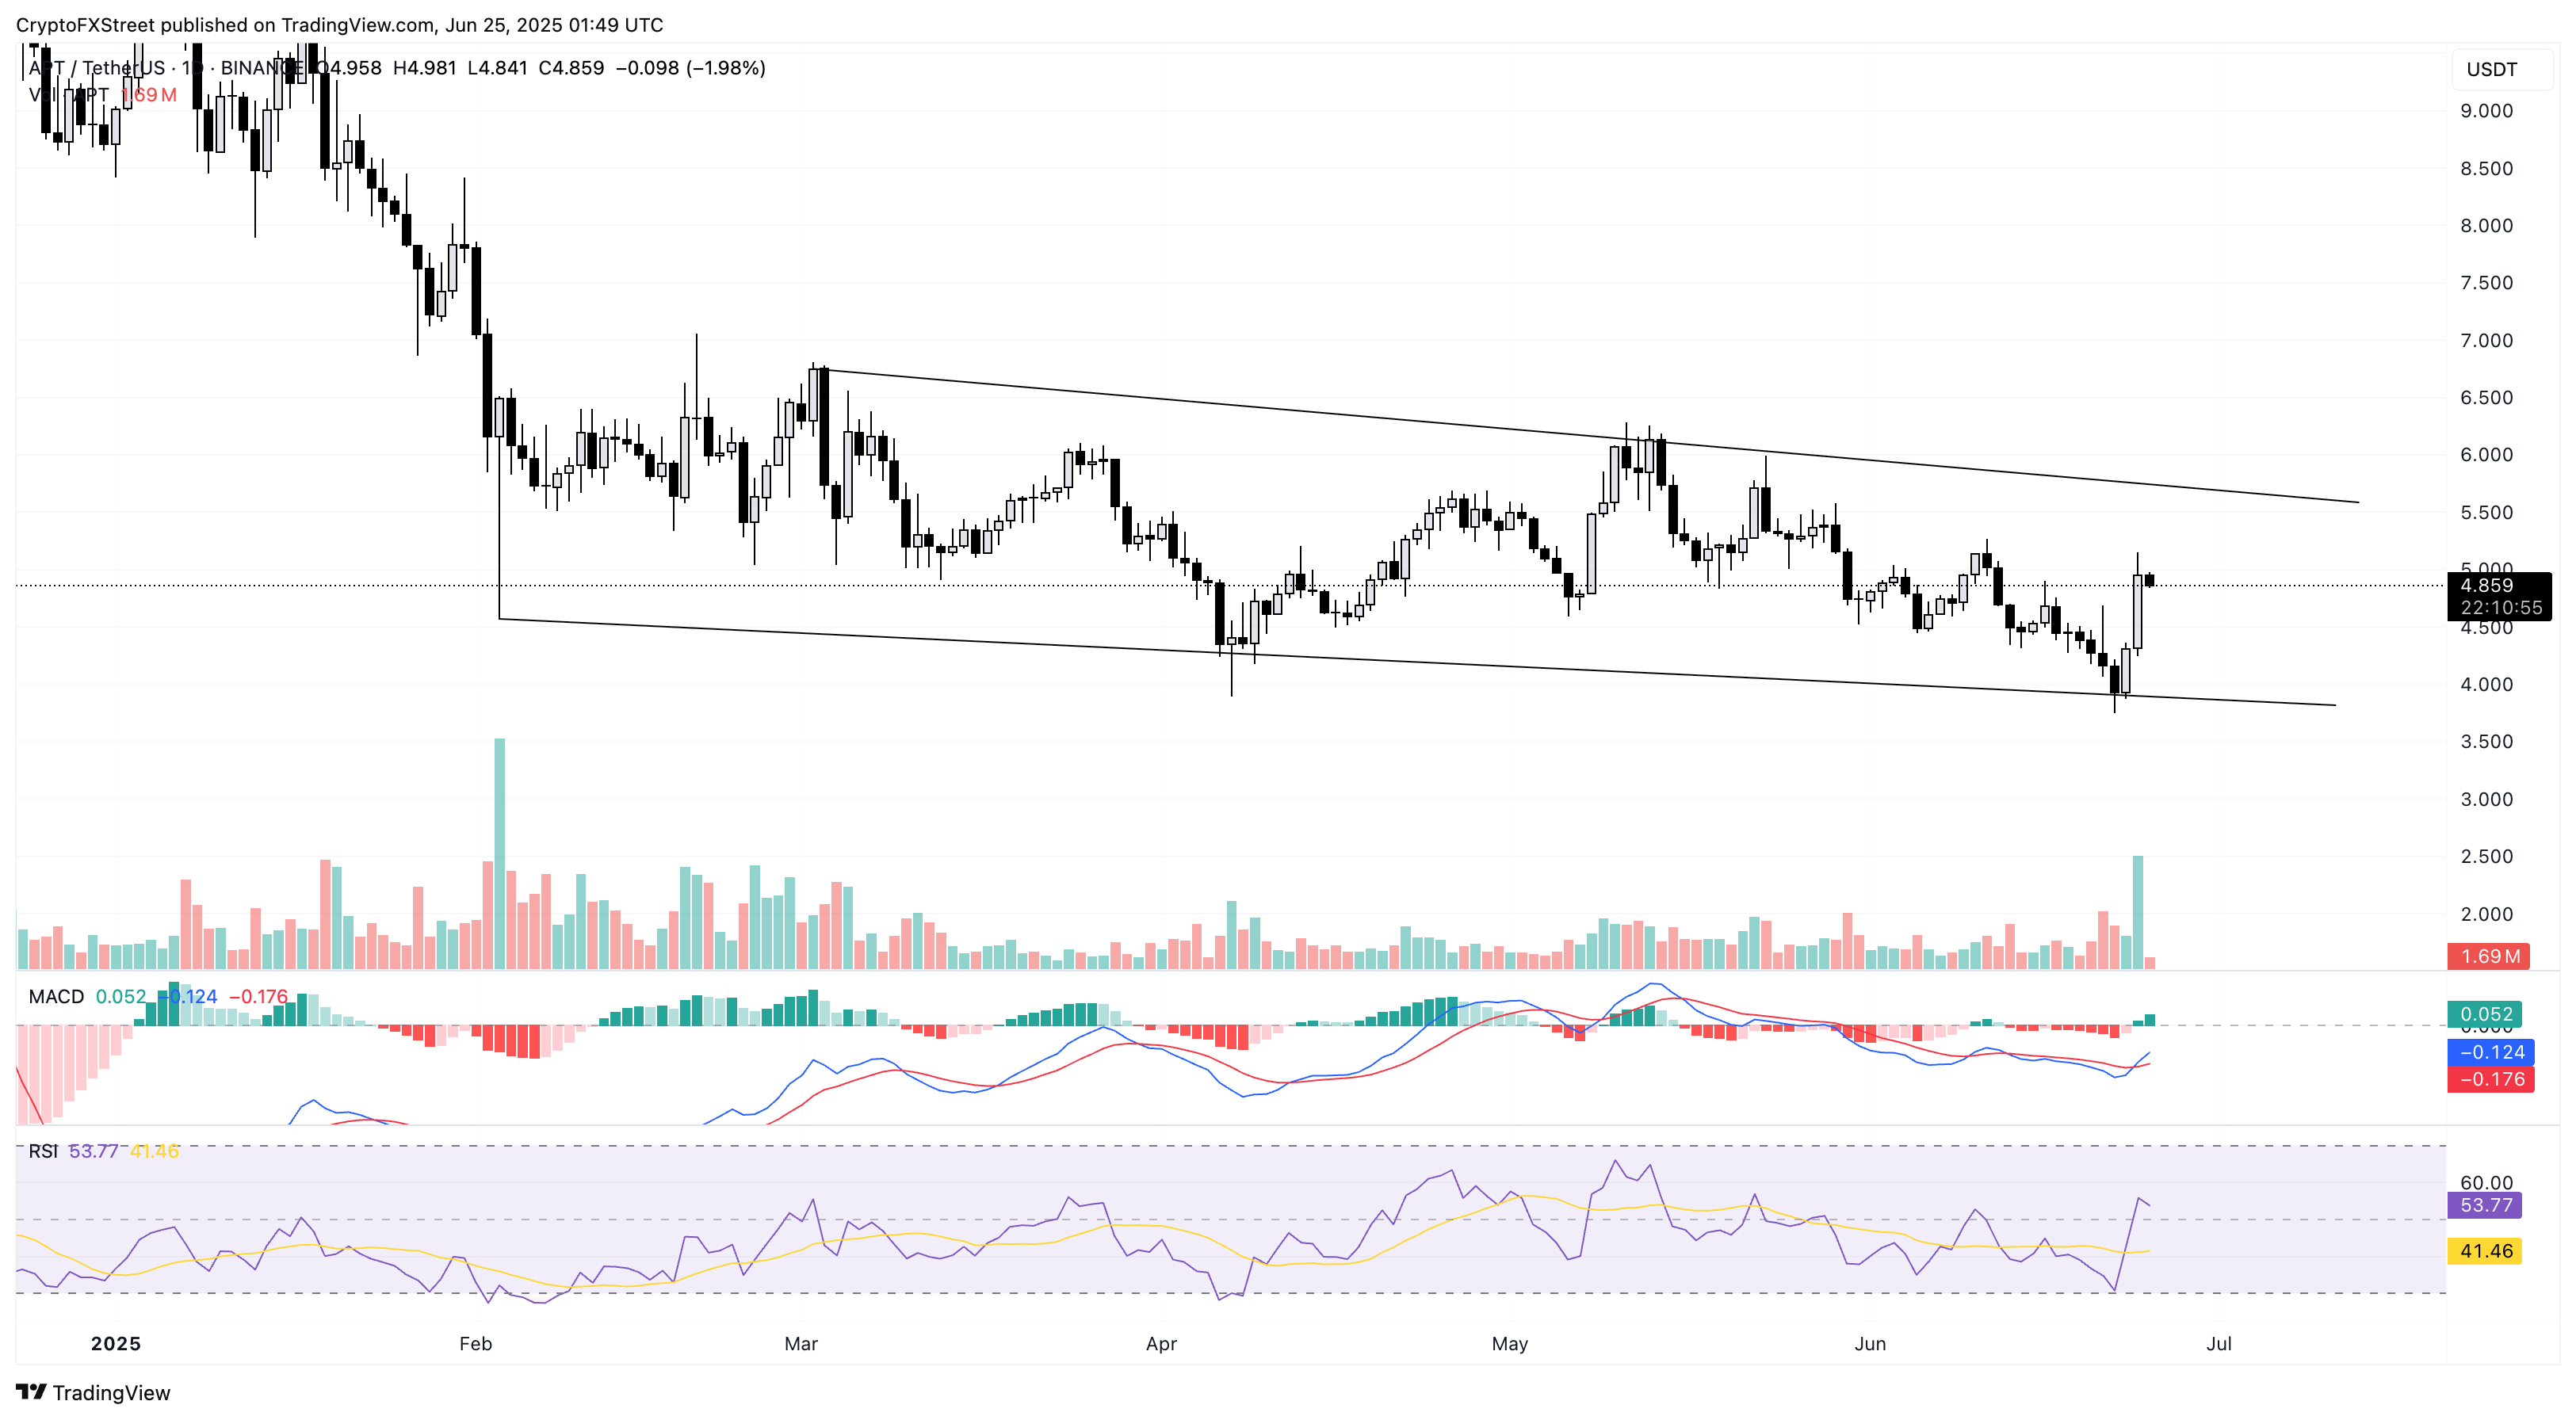
APT/USDT daily price chart.
On the flip side, a reversal could retest the lower boundary line NEAR the weekly low at $3.87.
