FET Nears Breakout: Whales Bet Big as AI Token Shakes Off Bearish Channel

AI's favorite crypto is flashing bullish signals—just as the big players start accumulating again.
FET claws its way toward a critical technical breakout, defying its recent downtrend. The token's resilience comes as on-chain data shows renewed confidence from deep-pocketed investors.
Whales are circling—and they're not here for the whitepaper vaporware. While retail traders panic-sell, the smart money's building positions in what could be crypto's most promising AI play.
Technical indicators suggest the falling channel pattern—that pesky bearish trend since the last rally—might finally break. If FET holds above key support levels, we could see a rerun of its explosive Q1 performance.
Of course, in crypto-land, 'fundamentals' often mean 'which influencer shilled it last.' But for once, there might actually be substance behind the hype—assuming you still believe in that sort of thing after the last three 'AI crypto revolutions.'
FET whales turn confident
Santiment data shows that the total holding of investors with 10 million to 100 million FET tokens has risen to 681 million from the year-to-date low of 663 million on May 27. The acquisition of roughly 18 million FET tokens suggests an increased confidence among large investors.
In contrast, the total holding of investors with more than 100 million FET tokens has fallen to 1.16 billion tokens, from 1.15 billion tokens since May 27. Taken together, the net FLOW of large investors records 8 million FET tokens, suggesting an overall boost in confidence.
%20%5B11-1750745133264.35.28,%2024%20Jun,%202025%5D.png)
FET supply distribution. Source: Santiment
FET nears channel breakout, targets the 200-day EMA
FET edges higher by 3% at press time on Tuesday, building on the 17% rise seen on Monday. The AI token recovery targets the sideways-trending 50-day and 100-day Exponential Moving Averages (EMAs) at $0.72.
The dynamic resistances align with the overhead trendline formed by shorter highs on May 23, May 29, and June 11. On the other hand, a parallel support trendline formed by the lows of May 31 and June 22 completes a falling channel.
A potential daily closing above the 100-day EMA, moving close to the overhead trendline, WOULD mark the channel breakout. In this scenario, FET could extend the bullish breakout rally towards the 200-day EMA at $0.85, followed by the $1.04 resistance level, aligning with the highest closing price in February.
The Moving Average Convergence/Divergence (MACD) indicator shows that the MACD line is about to cross above the signal line. Typically, such a crossover indicates a trend reversal, aligning with the channel breakout thesis.
The Relative Strength Index (RSI) points upwards and reaches the halfway level of 50, a quick turnaround from almost the oversold boundary line, signaling a boost in bullish momentum.
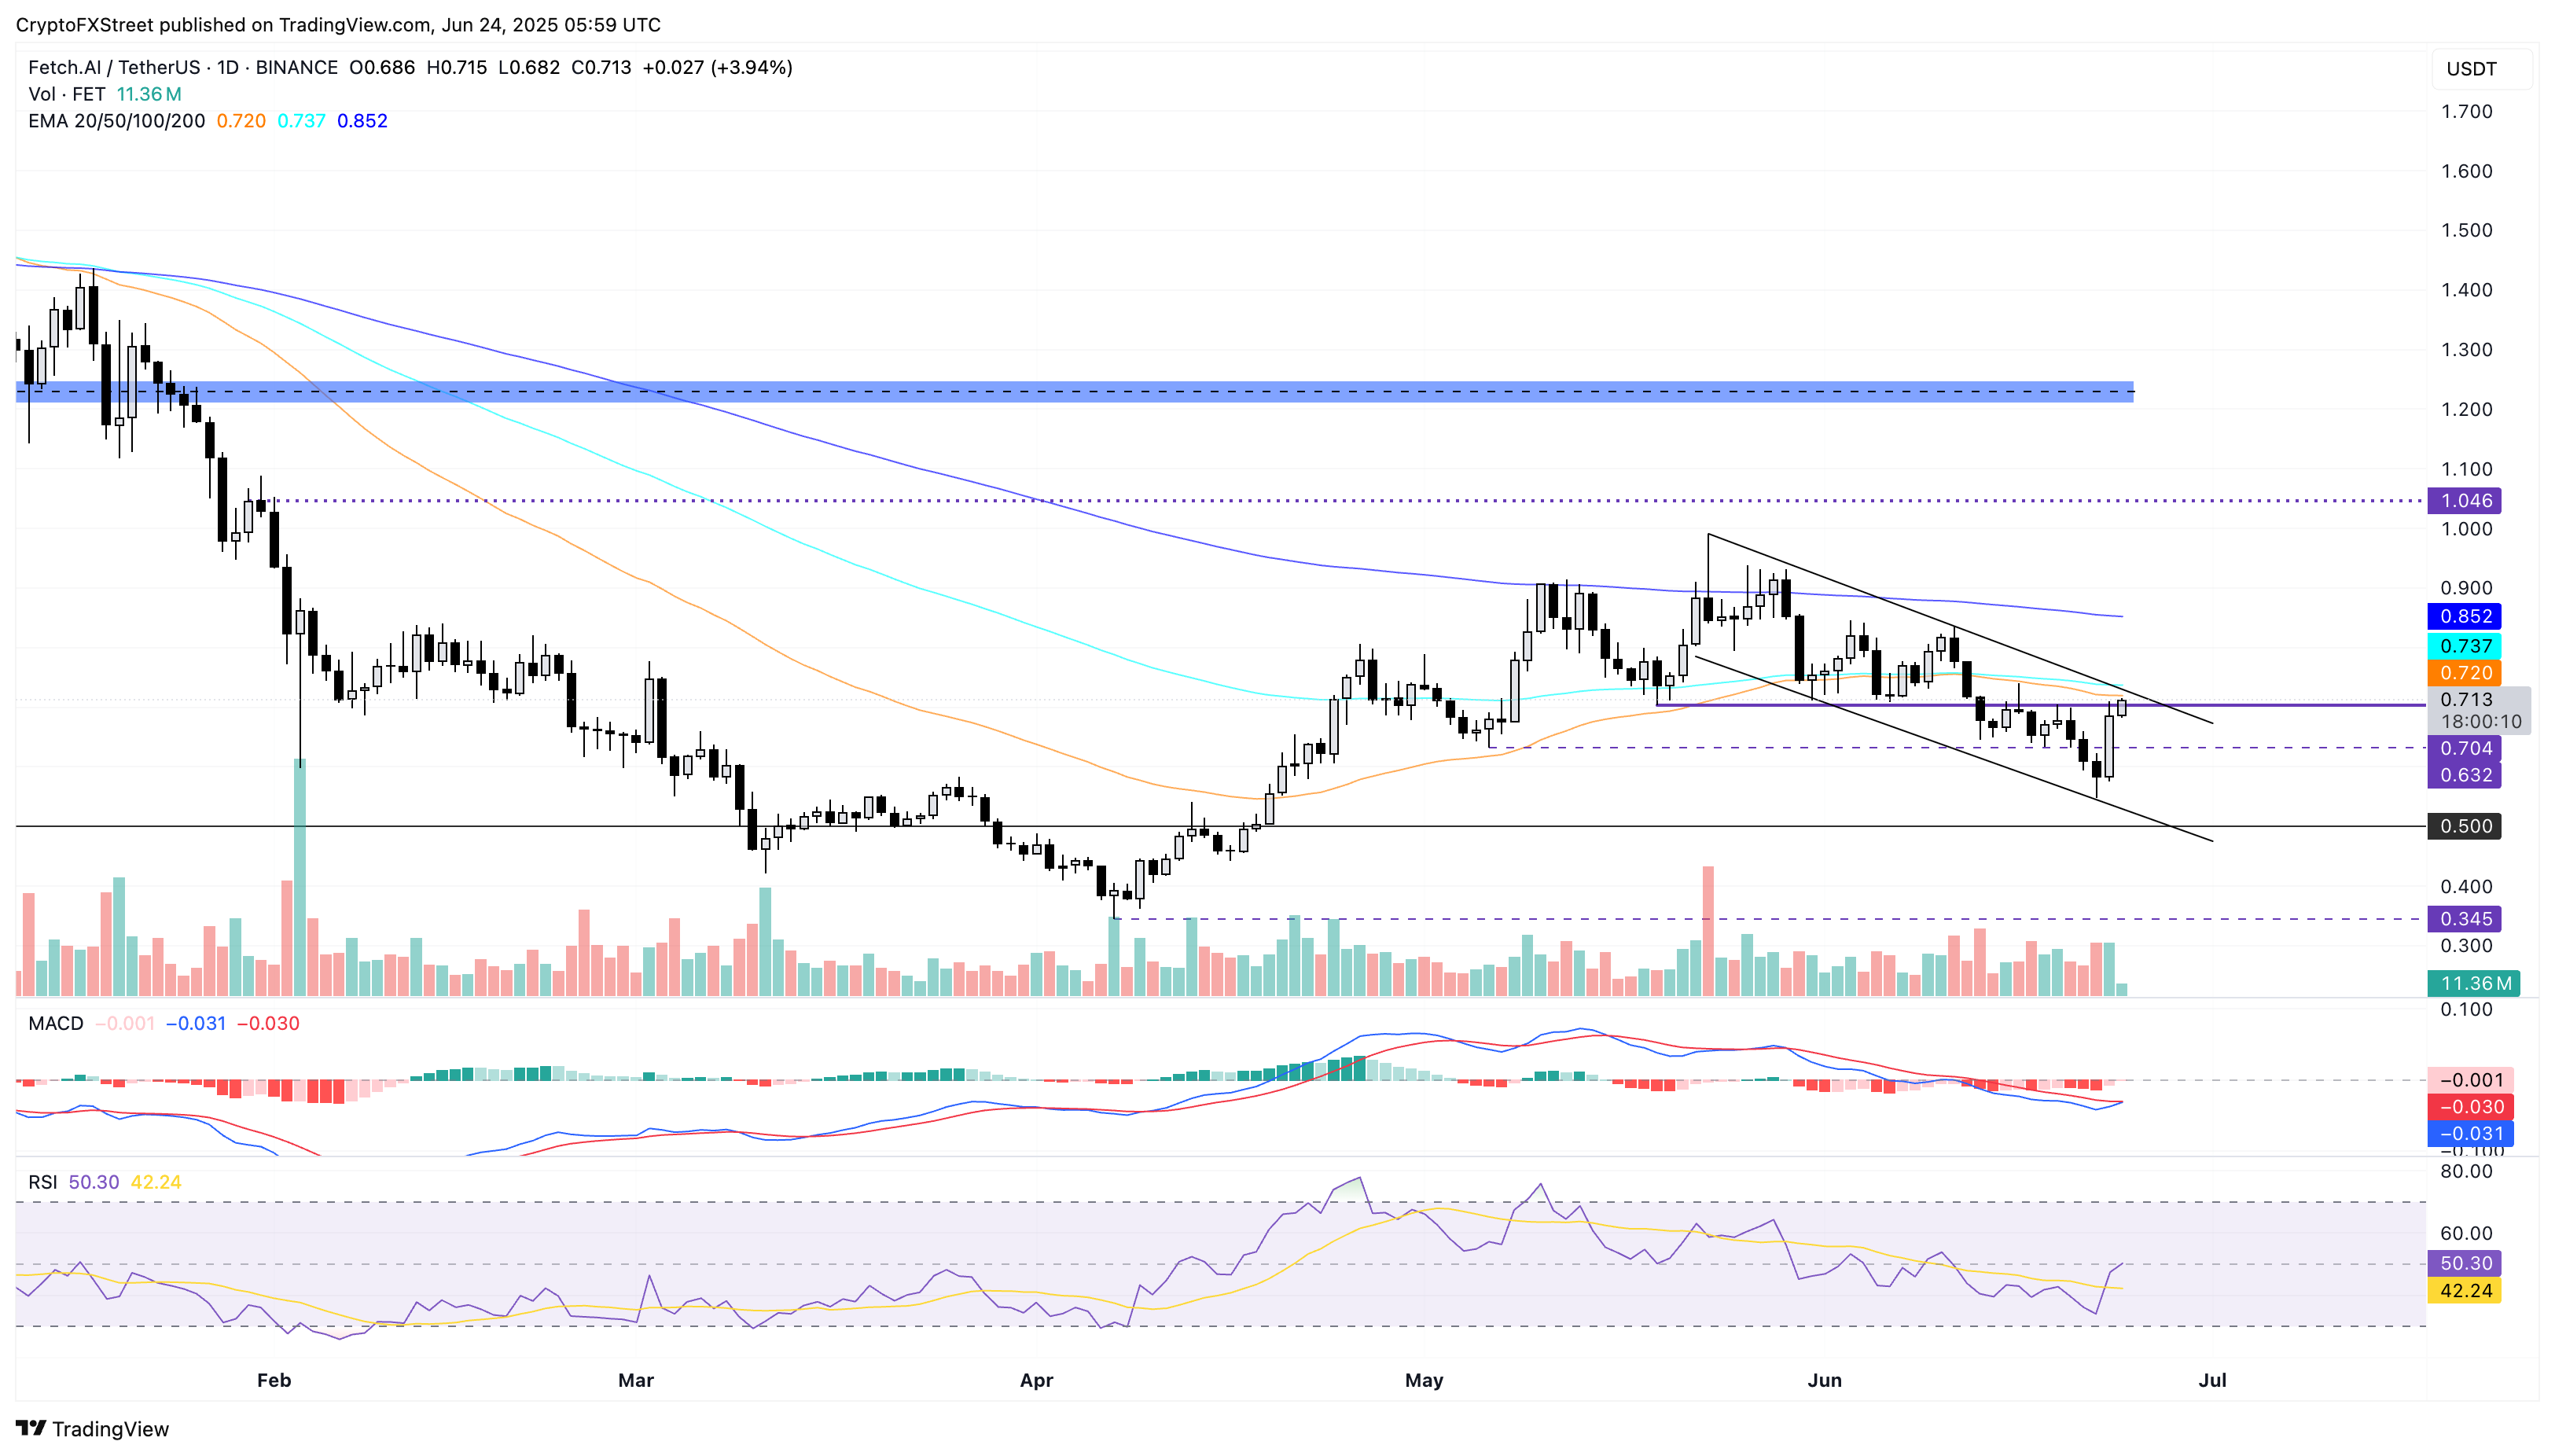
FET/USDT daily price chart.
A failure to surpass the overhead trendline could lead to another pullback within the channel, with the immediate support at the weekly low of $0.548.

Log in to Reply
Log in to comment your thoughtsComments
Related Articles
|Square
Get the BTCC app to start your crypto journey
Get started today Scan to join our 100M+ users