Solana Bounces Back: SOL Stages Comeback After 2-Month Low Amid US-Iran Tensions

Solana's native token SOL defies geopolitical tremors with a swift recovery—proving crypto markets still dance to their own chaotic rhythm.
When traditional markets flinch, crypto flexes. SOL's rebound from its lowest point since April shows traders treating macro shocks as mere speed bumps—even as Wall Street analysts hyperventilate over risk assets.
The rally comes despite escalating Middle East tensions, with SOL bulls treating the dip like a Black Friday sale. Meanwhile, Bitcoin maximalists grumble about 'altcoin casino season' while quietly checking their portfolios.
Finance jab: If SOL's volatility makes you queasy, maybe stick with Treasury bonds—where your money loses value predictably.
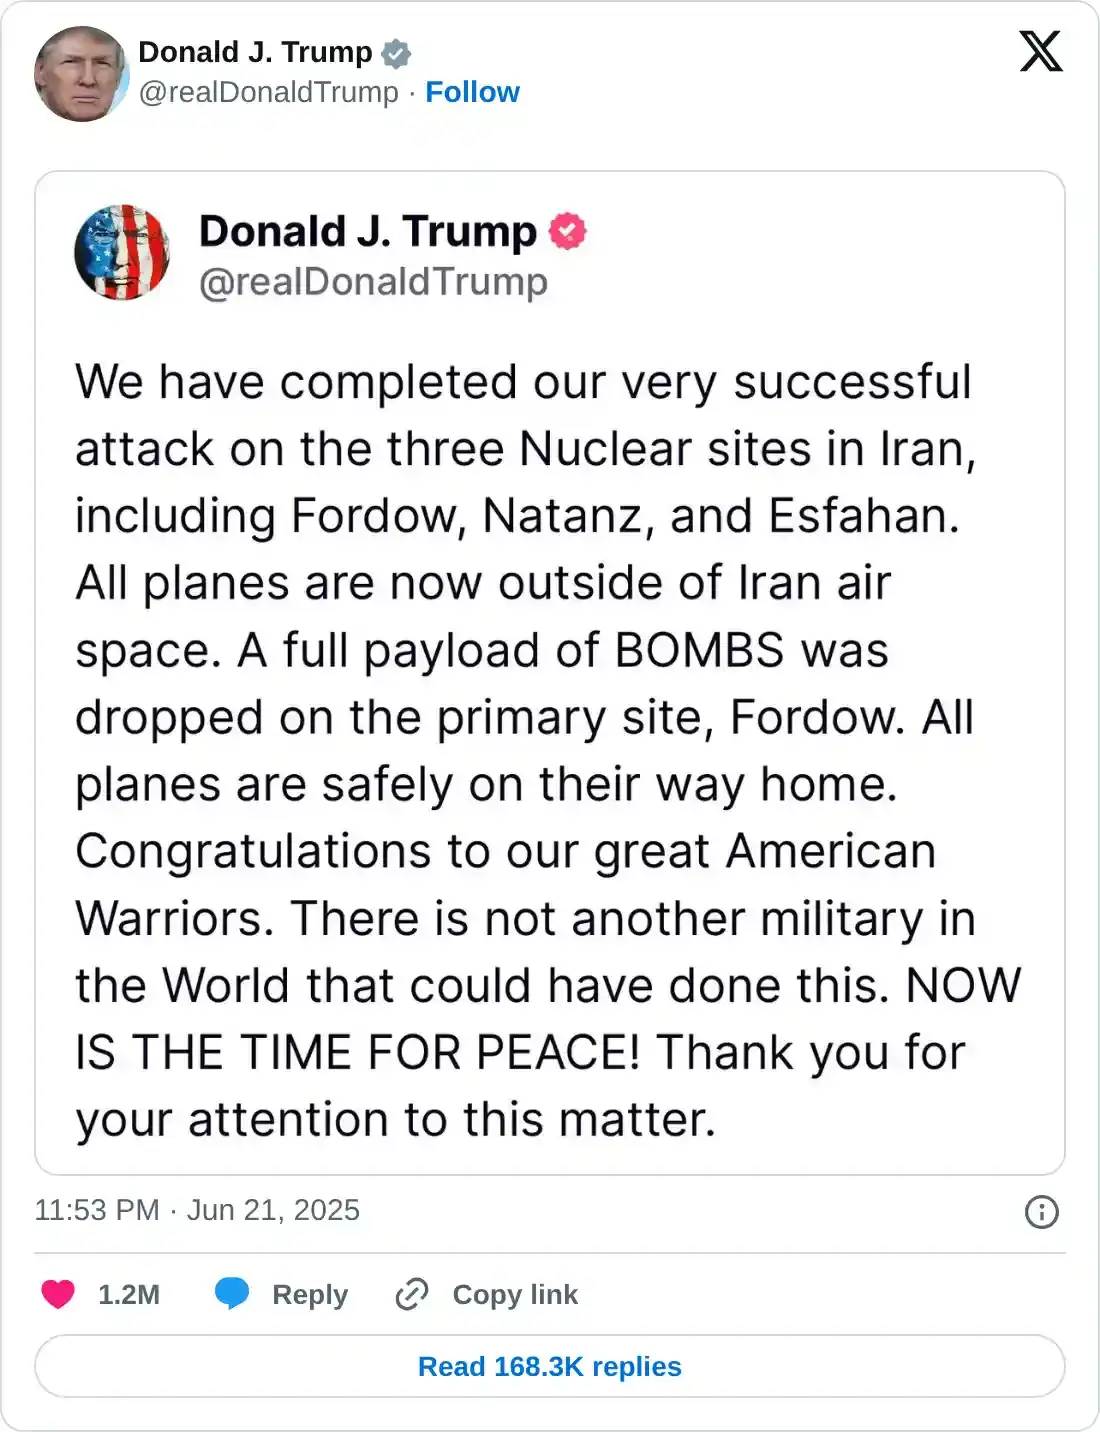
Solana price dips as investor caution rises amid Trump’s strikes on Iran’s nuclear facilities
Solana price dipped nearly 14% last week, reaching levels not seen since mid-April. The rising tension in the Middle East primarily triggered this correction. The war between Iran and Israel has been ongoing for more than a week and took a new turn late Saturday as the news came in that the US attacked Iran’s three nuclear sites.
The US strike on Iran has caused global risk sentiment to remain fragile, with Bitcoin reaching a low of $98,200 on Sunday, followed by Solana hitting a low of $126.
Iran's response to the US attack could be another event of concern this week, which raises the risk of spillover and a broader conflict in the Middle East and could trigger deeper losses in risky assets such as Solana.
Solana Price Forecast: SOL reaches levels not seen since mid-April
Solana price faced rejection around the 200-day Exponential Moving Average (EMA) and closed below its daily support at $160 on June 12, declining 5.20% over the next two days. SOL recovered slightly but was again rejected by the daily level of $160 at the start of last week and declined by 14% until Sunday, reaching a low of $126. At the time of writing on Monday, it recovers slightly, trading around $134.
If SOL declines and closes below the 61.80% Fibonacci retracement (drawn at the April 7 low of $95.26 to a May 23 high of $187.73) at $130.58 on a daily basis. It could extend the decline to retest its next daily support at $118.10.
The Relative Strength Index (RSI) indicator reads 35 on the daily chart, nearing oversold conditions and indicating strong bearish momentum. Moreover, the Moving Average Convergence Divergence (MACD) showed a bearish crossover last week. It also displays rising red histogram bars below its neutral level, indicating bearish strength and suggesting the continuation of a downward trend.
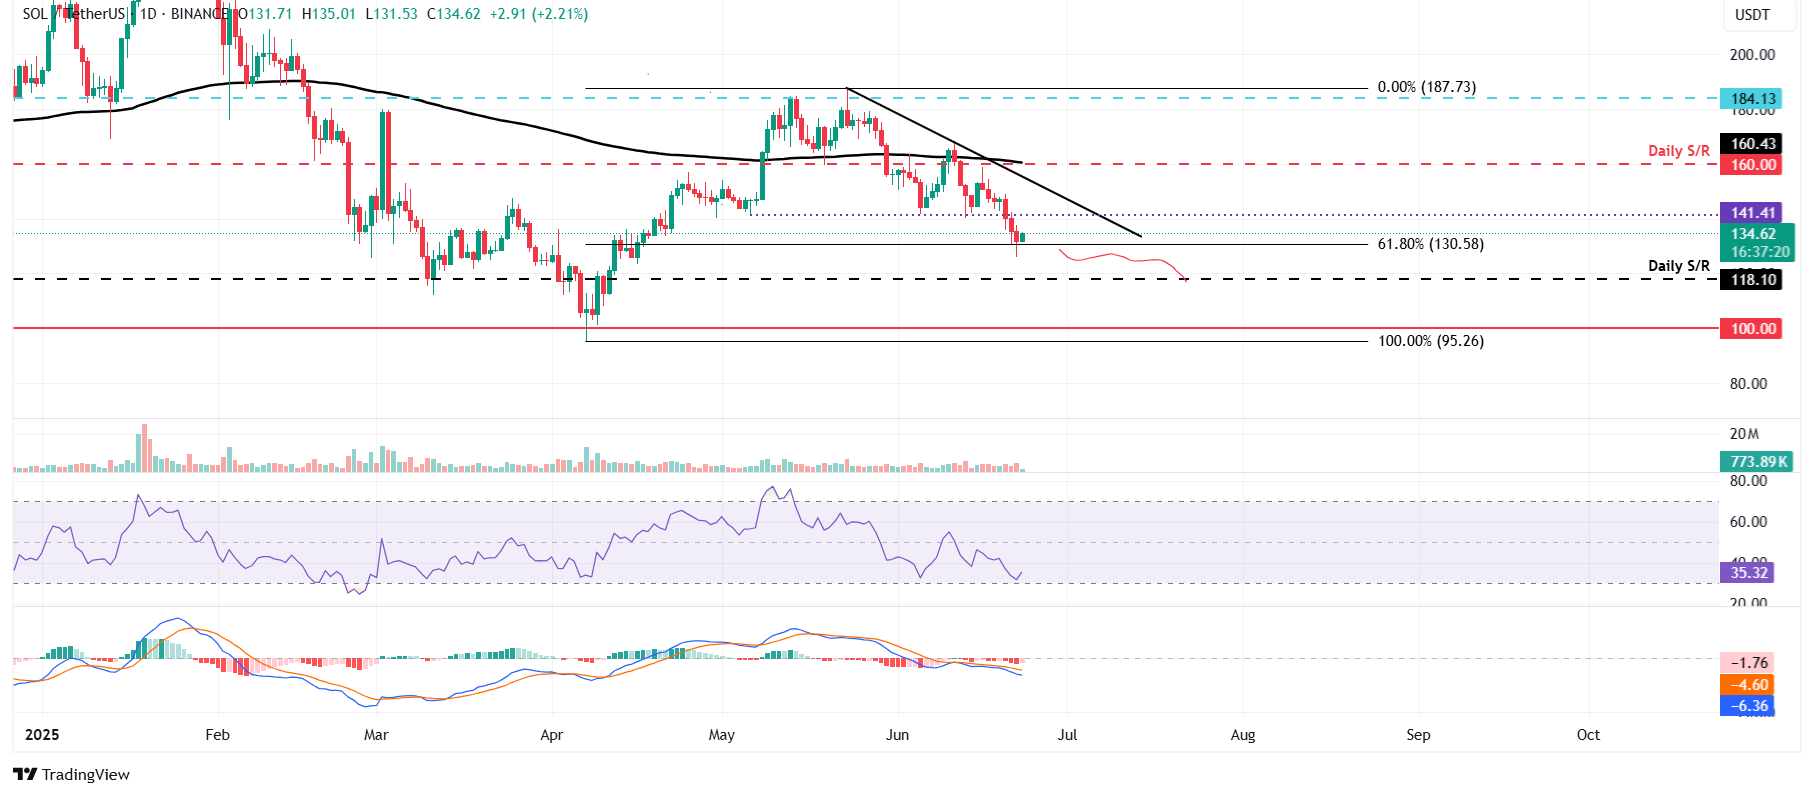
SOL/USDT daily chart
However, if SOL recovers, it could extend the recovery toward its next resistance level at $141.41.
