Solana (SOL) Primed for Rebound: Bear Exhaustion Hits at $140 – Time to Buy?

Solana's bleeding might finally be stopping. After weeks of relentless selling pressure, SOL shows tentative signs of stabilization above the $140 level—a critical psychological floor that's separating panic from potential.
The bounce playbook
Traders are watching for two confirmation signals: a higher low forming on the daily chart, and a decisive breach of the descending trendline that's been capping relief rallies since May. If SOL flips $160, the shorts could get squeezed hard.
Why this isn't just hopium
Network metrics tell a different story than price action. Developer activity remains top-3 among smart contract platforms, and meme coin degenerates—sorry, 'retail innovators'—keep flooding SOL-based DEXs with their life savings.
Wall Street's favorite crypto is waking up. Just don't tell the SEC.
Solana derivatives reveal bullish bias
CoinGlass’ data shows the solana Open Interest reaching a new high for this week of $6.67 billion on Friday. A surge in OI relates to an increased inflow in the derivatives market, reflecting potential buying activity and an increase in optimism.
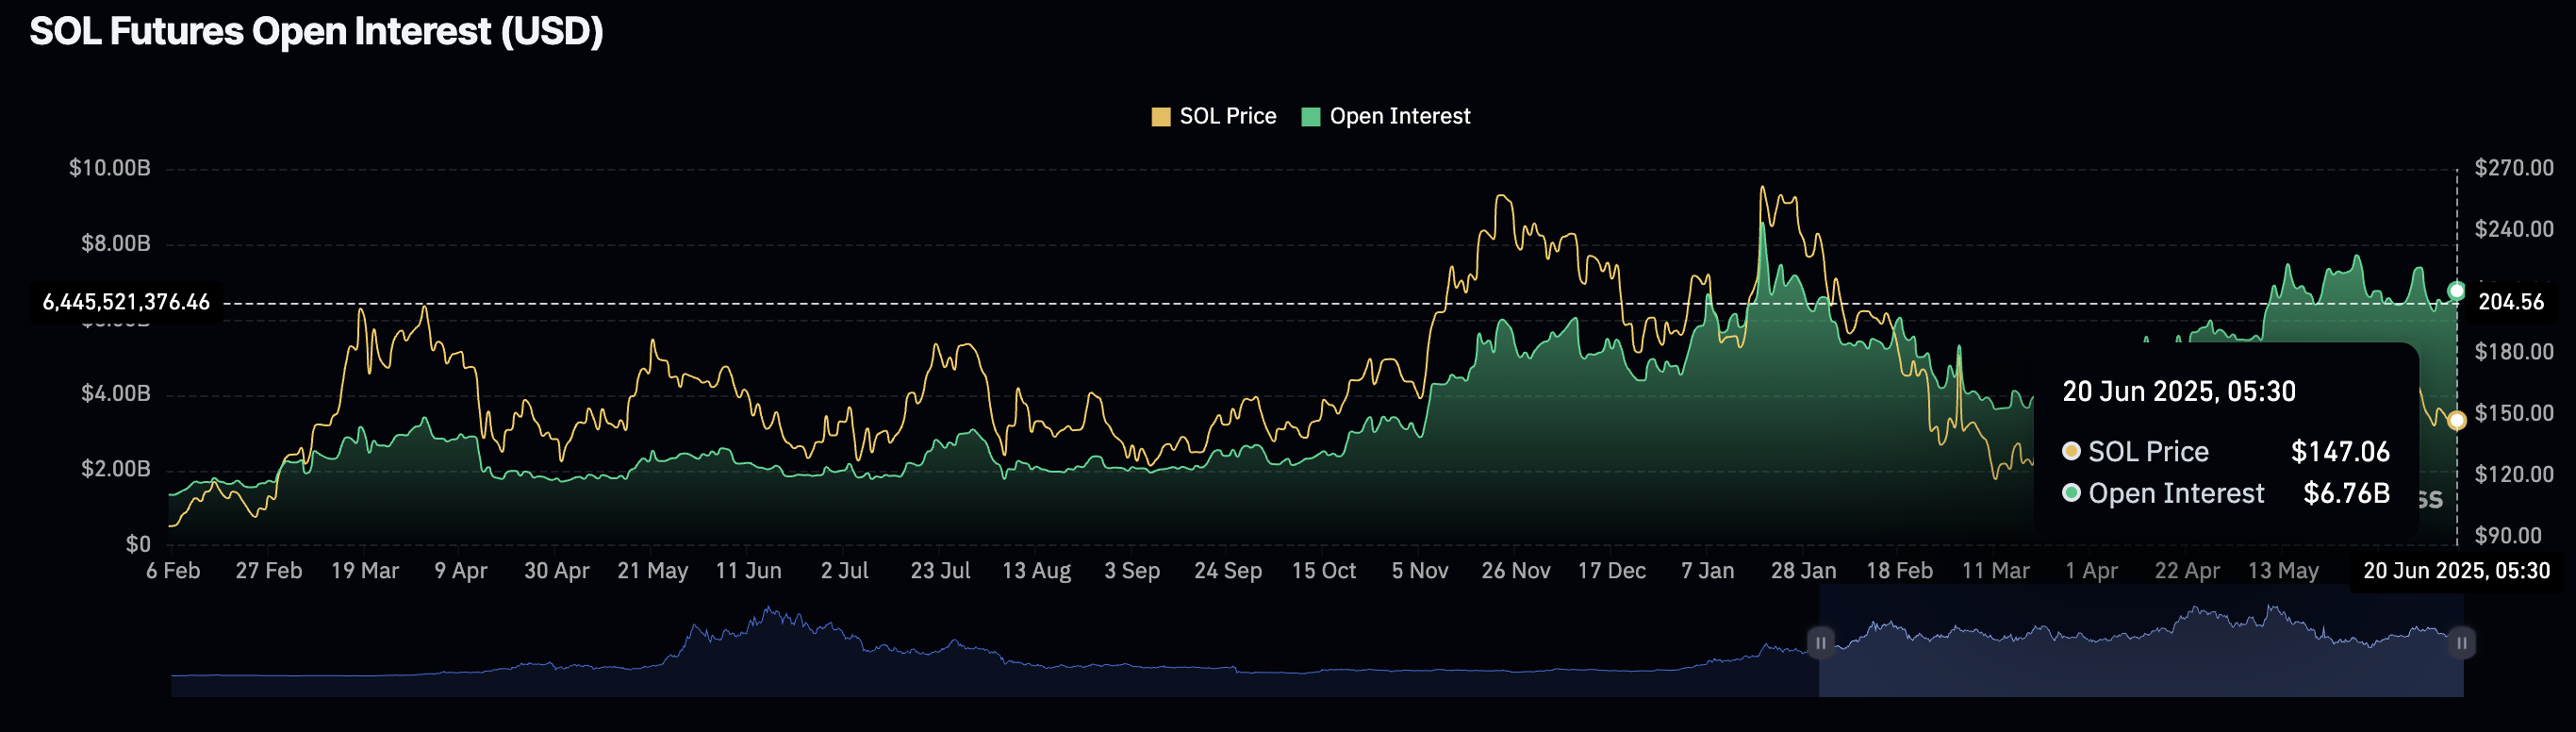
SOL Open Interest. Source: Coinglass
The OI-weighted funding rate at 0.0042% in the eight-hour timeframe backs the heightened bullish activity thesis. Typically, Leveraged positions lead to an imbalance between spot and swap prices. To align these prices, buyers pay a premium to bears when funding rates are positive, and vice versa.
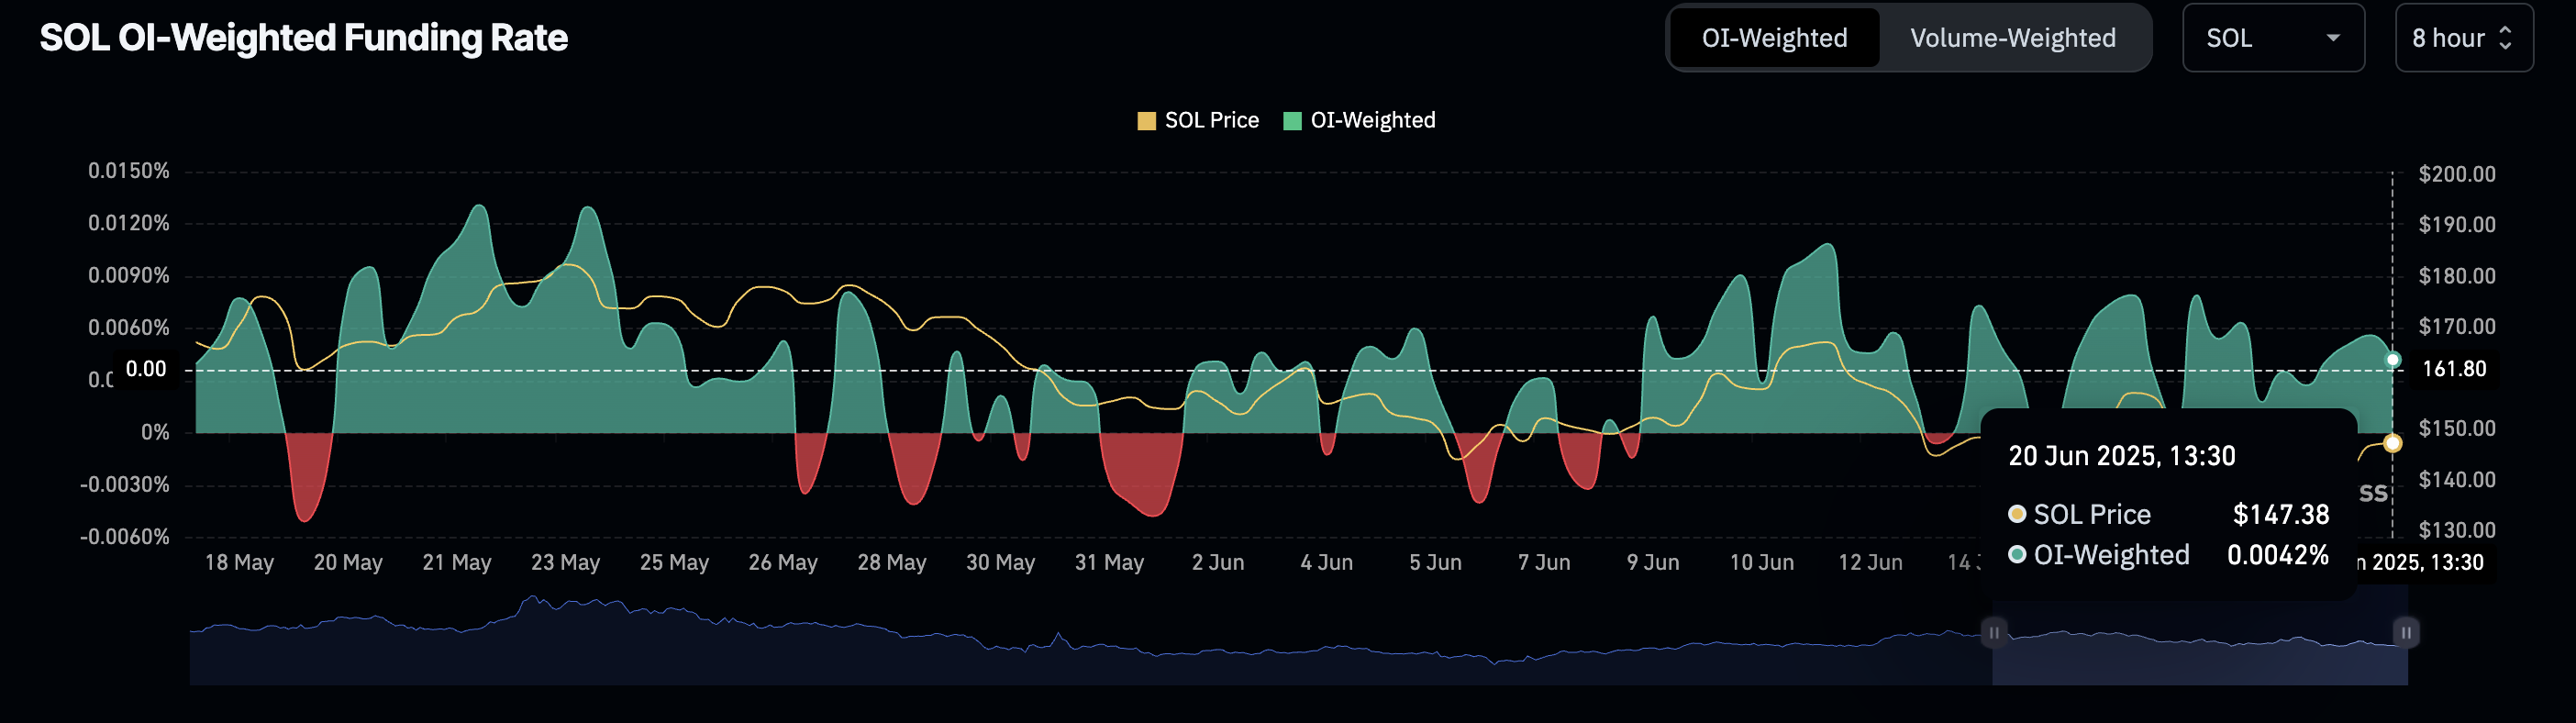
SOL OI-weighted funding rate. Source: Coinglass
The Taker buy/sell volume indicates that longs account for 56.42% of the taker volume in the one-hour timeframe. In comparison, shorts account for 43.58%, resulting in a long/short ratio of 1.2946, suggesting a bullish bias among Solana traders in the short term.
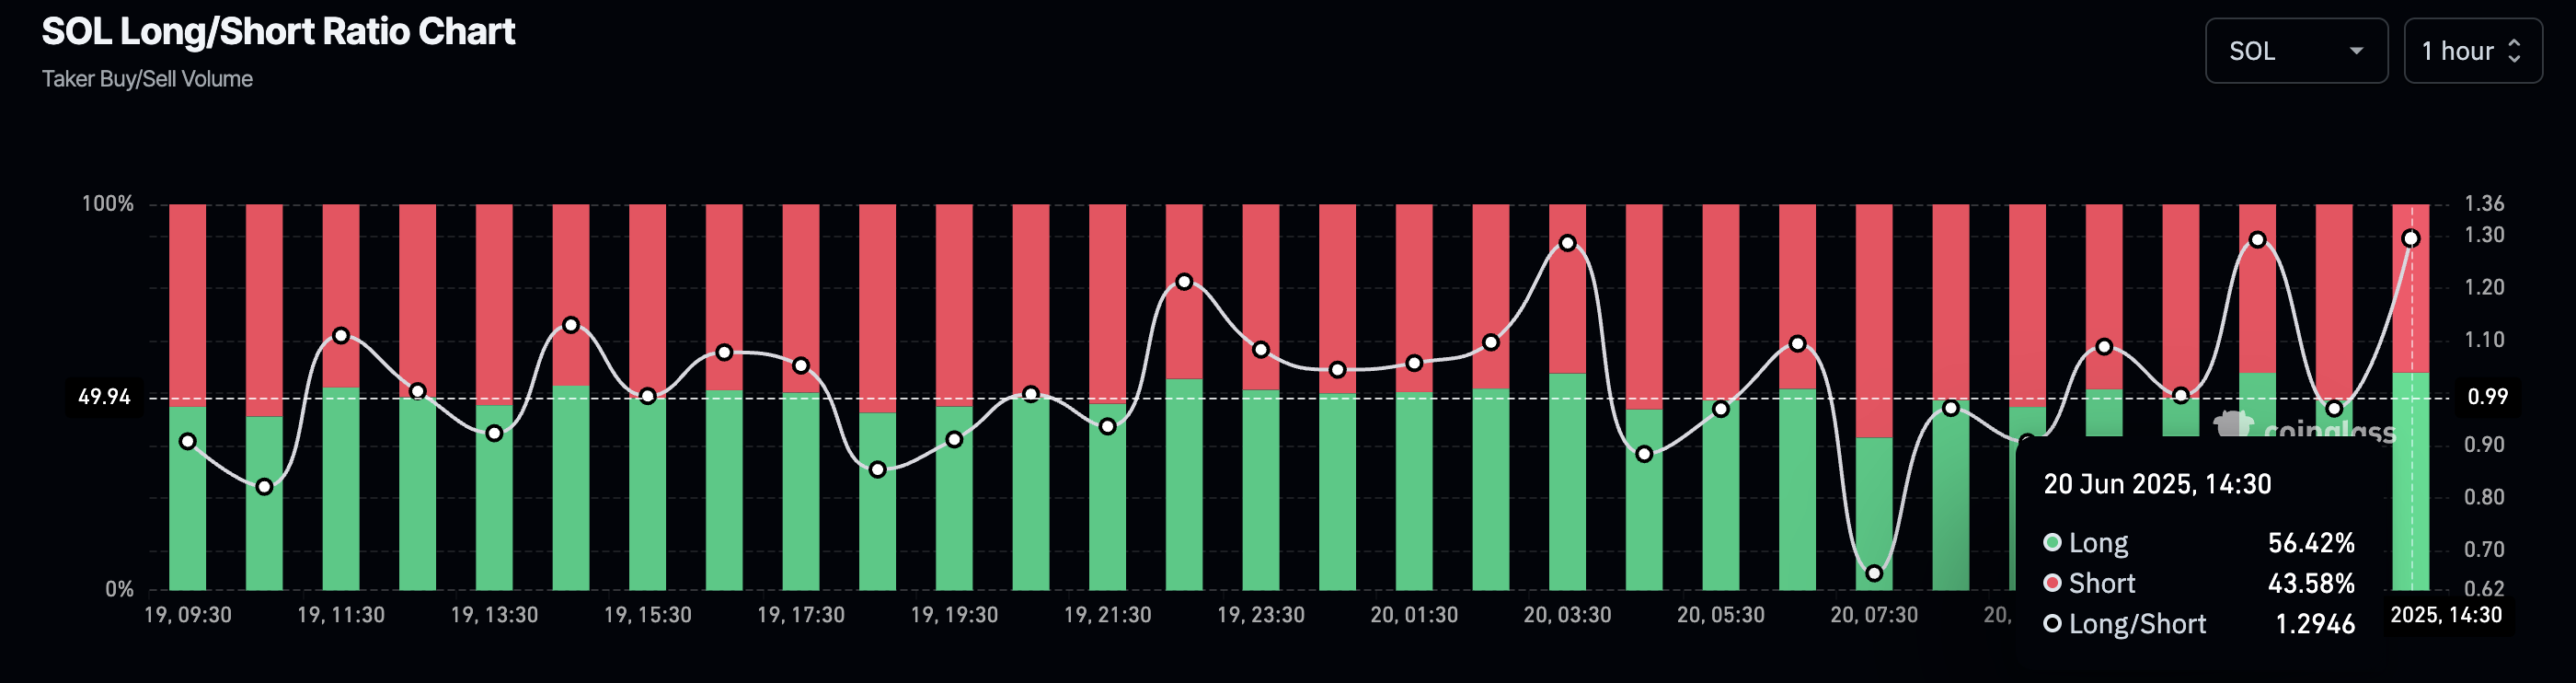
SOL long/short ratio. Source: Coinglass
Solana eyes trend reversal towards the 200-day EMA
Solana ticks higher by under 1% at press time on Friday as it prepares a potential early reversal from the $140 demand zone, which aligns with the 23.6% Fibonacci retracement level at $142, drawn from the all-time high of $295 to the year-to-date low of $95.
The declining trend from the weekly high of $158 reached on Monday loses bearish momentum as price action forms multiple long-tail candles above $142. Typically, long-tail candles indicate a potential trend reversal, as demand at lower levels successfully absorbs incoming supply.
A bounce back in Solana could target the 200-day Exponential Moving Average (EMA) at $161 before hitting the resistance trendline formed by the peaks on January 18, May 13, May 22, and June 11, currently at $164. Extended Solana’s recovery could target the 50% Fibonacci retracement at $195 after a decisive closing above the trendline.
The momentum indicators support upside chances as the Moving Average Convergence/Divergence (MACD) indicator nears a bullish crossover with its signal line on the daily chart. A potential crossover alongside the fresh wave of green histograms from the zero line could indicate the next bullish wave in Solana.
The Relative Strength Index (RSI) at 43 continues to FORM higher lows compared to previous bottoms formed at $142. This marks a bullish divergence, typically regarded as a buy signal for investors.
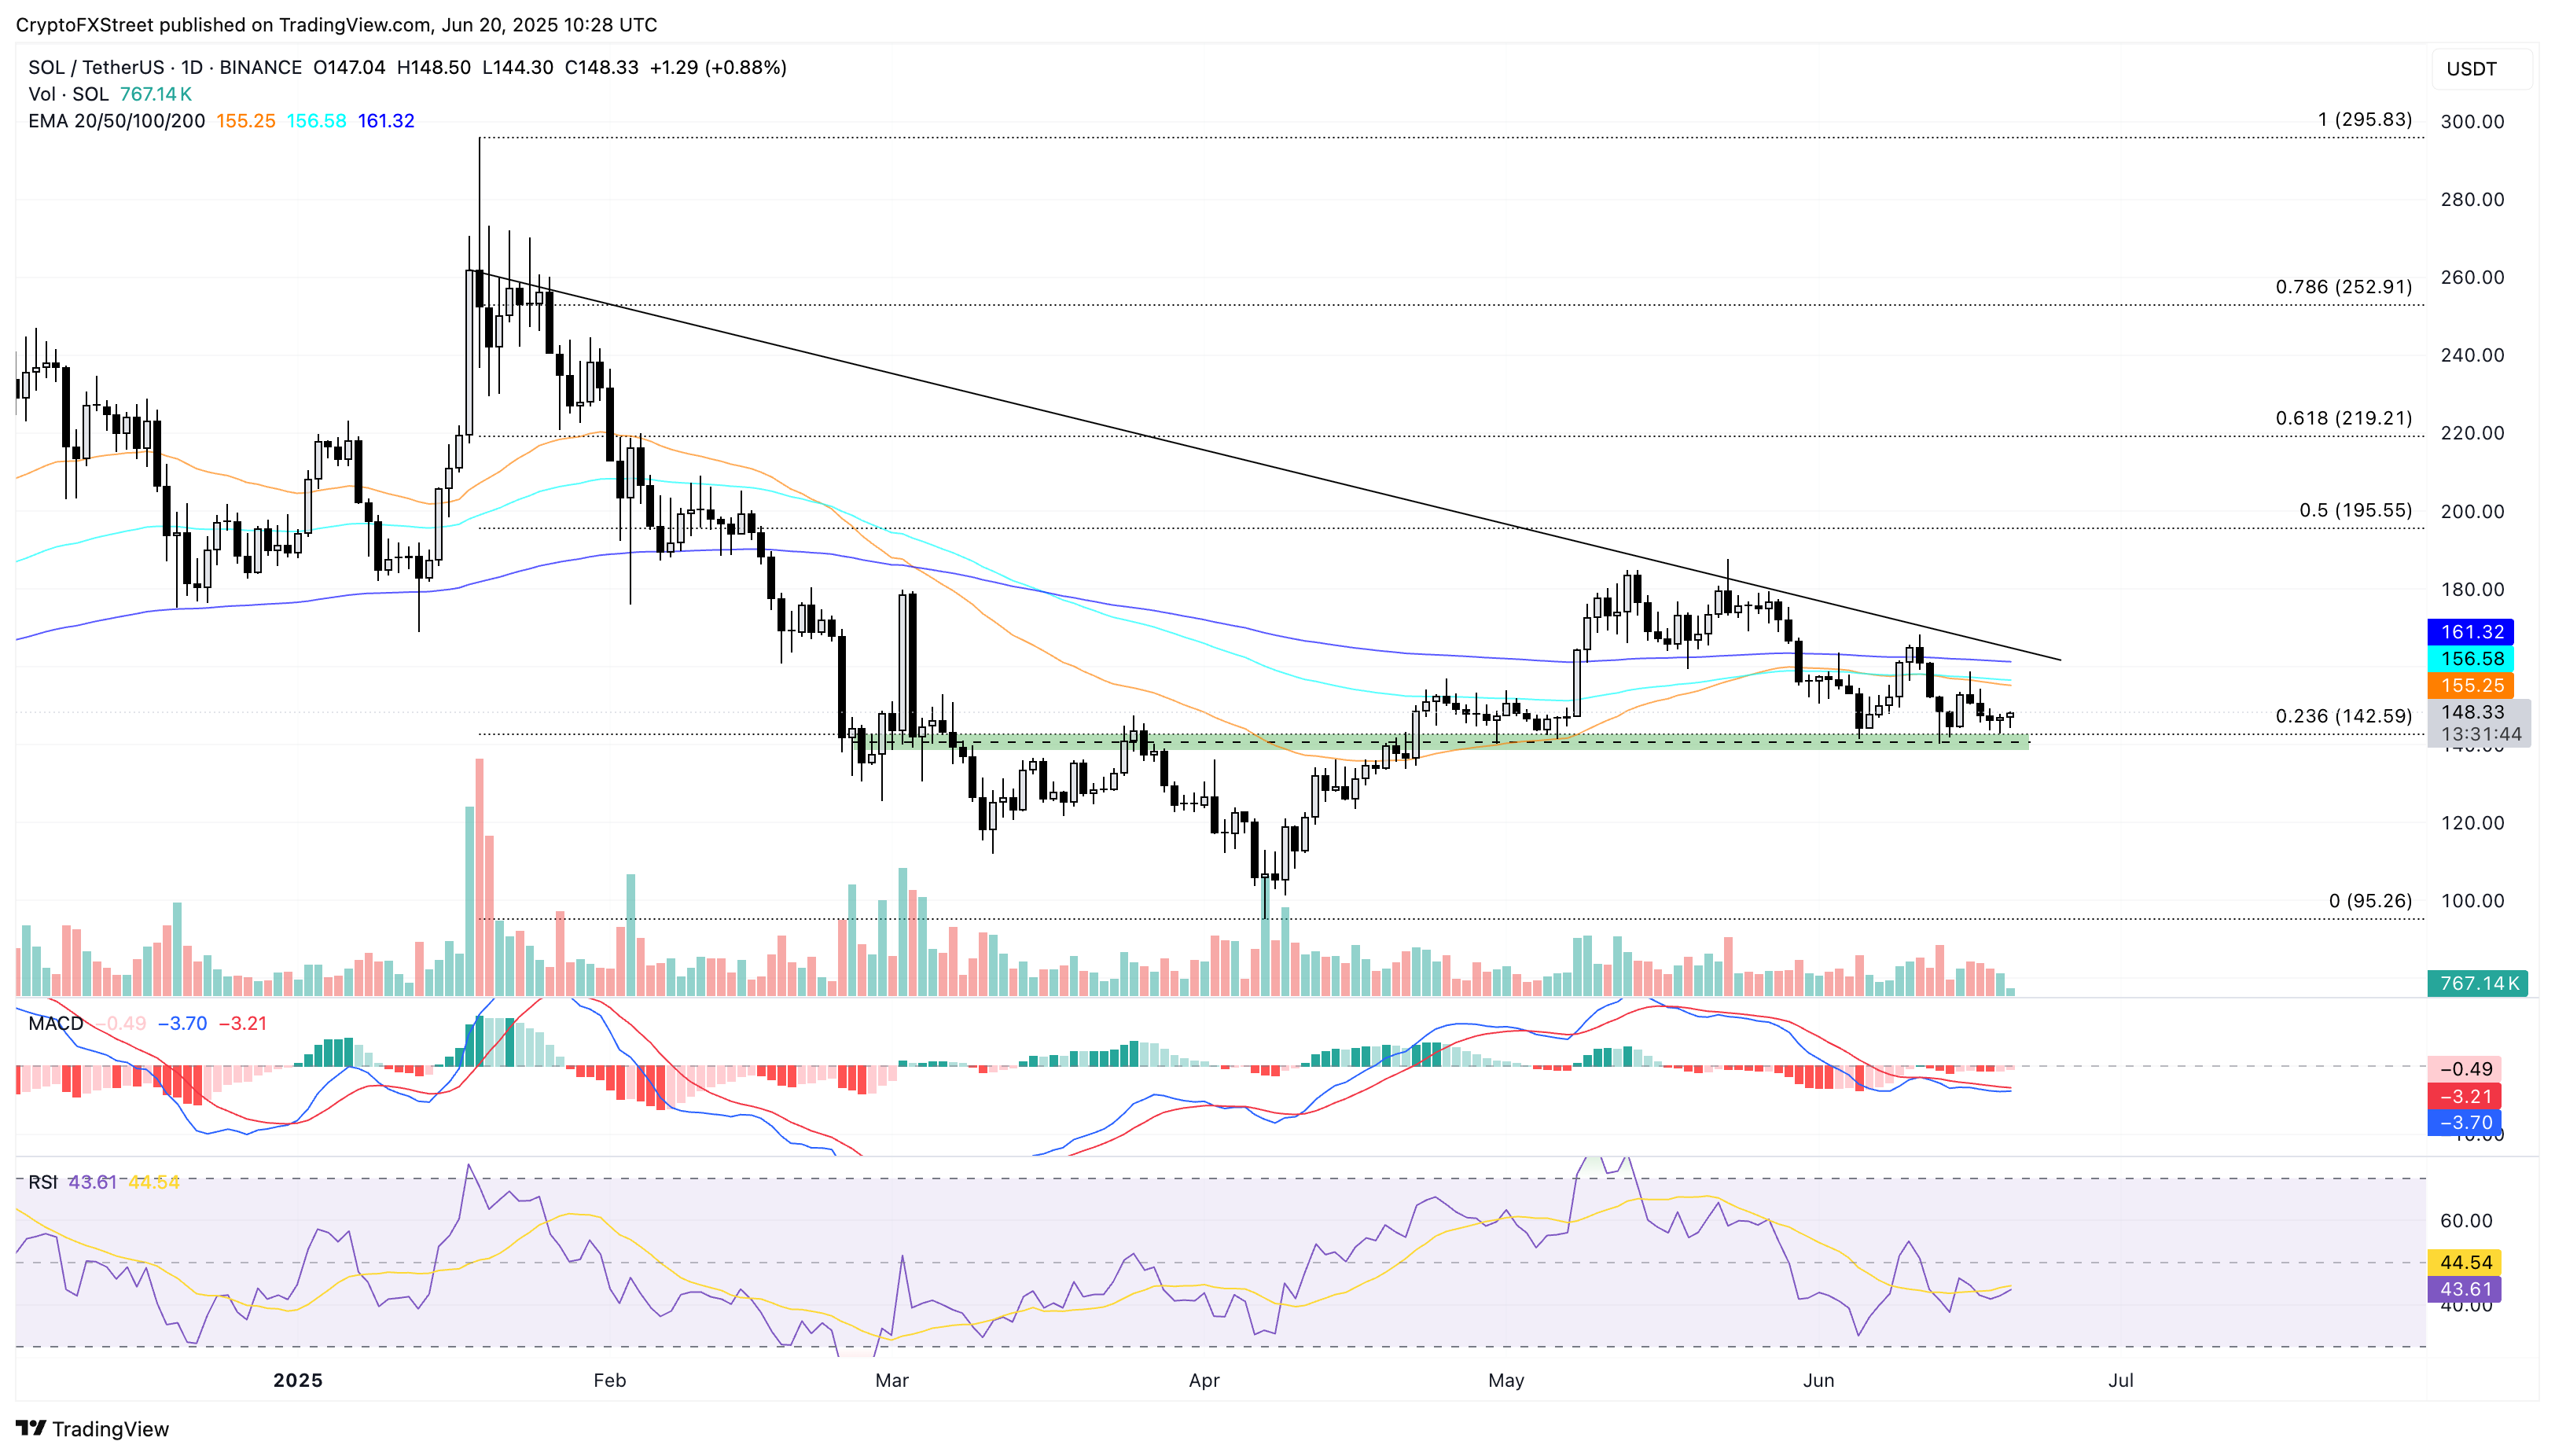
SOL/USDT daily price chart.
On the flip side, a closing below the $140 demand zone could extend SOL's decline towards the $100 psychological support level.

Log in to Reply
Log in to comment your thoughtsComments
Related Articles
|Square
Get the BTCC app to start your crypto journey
Get started today Scan to join our 100M+ users