VeChain (VET/USD) Price Surge Today: Elliott Wave Analysis Reveals Bullish Breakout {Video}

VeChain's VET/USD pair is making waves—again. Here's why traders are scrambling.
Elliott Wave Theory Signals Upward Momentum
The charts don’t lie: VeChain’s price action aligns perfectly with a classic Elliott Wave pattern. Traders eyeing the next leg up—or bracing for a classic crypto fakeout.
Technical Indicators Scream ‘Buy’
RSI? Neutral. MACD? Bullish crossover. Volume? Spiking like a Wall Street analyst’s blood pressure during a flash crash.
The Bottom Line
VeChain’s setup looks tasty—but remember, in crypto, even ‘sure things’ have a habit of evaporating faster than a hedge fund’s ethics.
VET/USD Elliott Wave technical analysis
-
Function: Counter trend.
-
Mode: Corrective.
-
Structure: Double Corrective.
-
Position: Wave Y.
-
Next Direction Higher Degree: Pending.
-
Wave Cancel Invalid Level: Under Review.
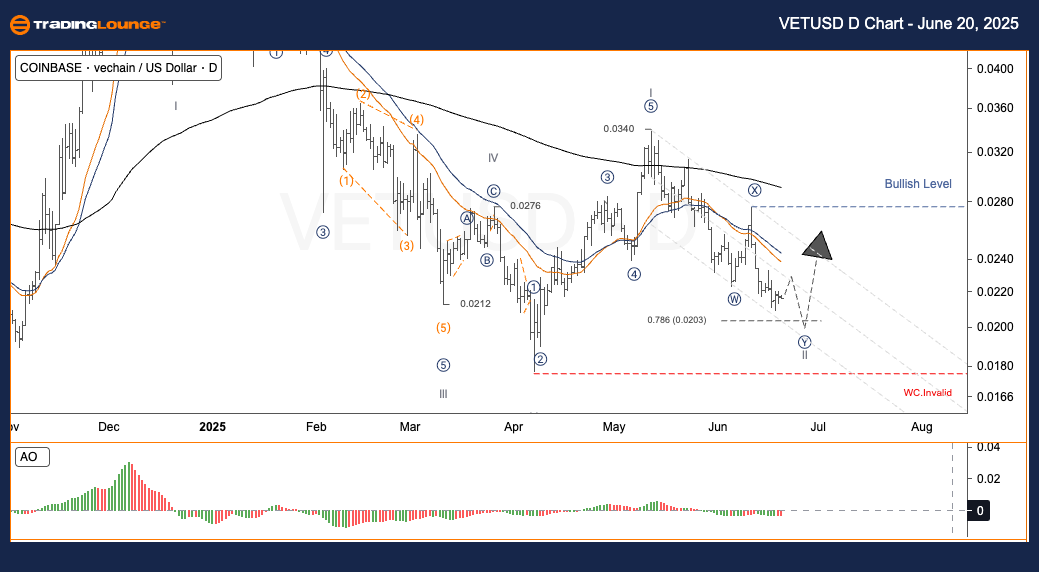
The VET/USD pair appears to be nearing the end of Wave II, which is a part of the corrective structure. If the price drops close to the 0.020 – 0.018 range and then shows a sharp upward move, it WOULD indicate the potential beginning of an impulsive Wave III to the upside.
-
General approach
-
-
Short-Term Traders (Swing Trading)
-
-
Monitor RSI/MACD for divergence and ensure the price does not form a new confirmed low.
-
If a reversal candlestick such as a Bullish Engulfing appears with supporting volume, consider initiating buy positions.
-
-
-
Risk Management
-
-
If the price drops below 0.01700, the Wave II structure becomes invalid and should be reanalyzed.
-
VET/USD Elliott Wave technical analysis
-
Function: Counter trend.
-
Mode: Corrective.
-
Structure: Double Corrective.
-
Position: Wave Y.
-
Next Direction Higher Degree: Pending.
-
Wave Cancel Invalid Level: Under Review.
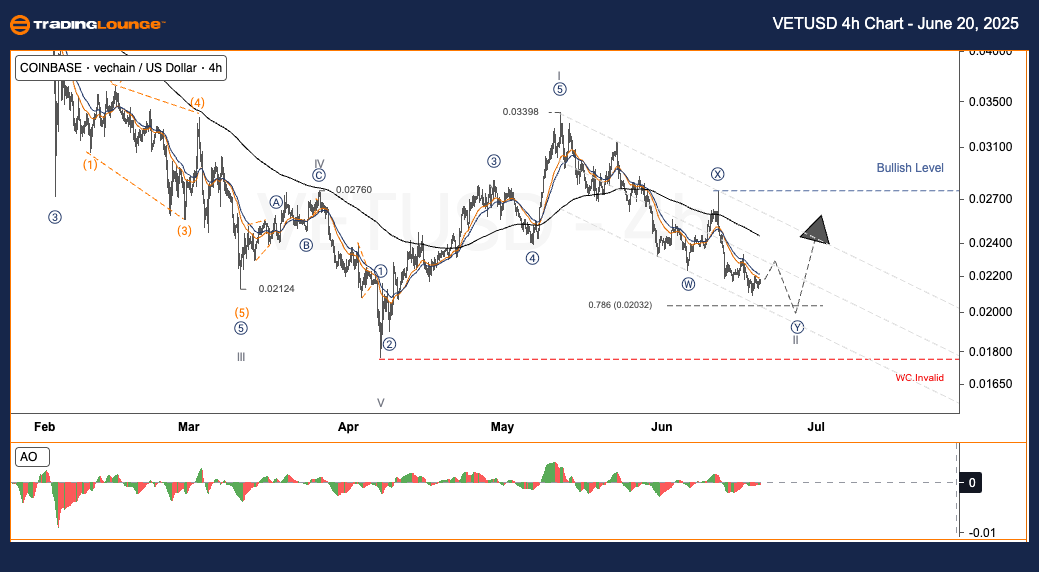
VET/USD remains in the late phase of the corrective Wave II. A drop NEAR 0.020 – 0.018 followed by a strong reversal may signal the start of Wave III and a bullish shift in momentum.
-
General approach
-
-
Short-Term Traders (Swing Trading)
-
-
✅ Look for RSI/MACD divergence and ensure no new significant lows occur.
-
✅ A strong bullish reversal candle with volume could indicate a buying opportunity.
-
-
-
Risk management
-
-
If the price declines below 0.01700, the current wave analysis becomes invalid and must be revised.
-
VET/USD Elliott Wave technical analysis [Video]
