🚀 Altcoins Steal the Spotlight: OKB, Sei, and Bitcoin Cash Defy Market Turbulence as Top Crypto Gainers

While traditional markets wobble like a rookie tightrope walker, altcoins are flexing their volatility-resistant muscles. Three names just left the rest of the crypto pack choking on their dust.
OKB: The exchange token quietly printing gains
Binance's BNB isn't the only exchange token worth watching—OKX's native asset just reminded everyone why infrastructure plays dominate bear markets.
Sei: The 'speed demon' blockchain living up to the hype
Touted as the 'fastest Layer 1', this project's token is delivering the kind of performance that makes Ethereum maxis nervously check their watches.
Bitcoin Cash: The zombie that won't stay dead
Just when you thought the fork wars were ancient history, BCH comes roaring back—because in crypto, even the 'failed experiments' get second acts (and third, and fourth...).
Meanwhile, Wall Street fund managers are still trying to explain to clients why their 'diversified portfolio' got outperformed by a meme coin named after a dog. The revolution won't be institutionalized—but it might get 20x returns.
OKB’s bullish reversal gains momentum
OKB trades in the green by over 3% at press time on Friday following the 8.92% rise the previous day. With two consecutive bullish engulfing candles, OKB reclaims the $50 psychological mark and surpasses the $53 peak, the highest monthly closing.
A decisive new higher monthly closing could further propagate OKB’s uptrend towards $56, last tested on May 10. Beyond this, the $58 level stands as a resistance, marked by the highest year-to-date closing price.
The uptick in Moving Average Convergence/Divergence (MACD) indicator crosses above its signal line on the daily chart, triggering a bullish crossover. With a new green histogram bar rising from the zero line, the indicator signals a boost in bullish momentum.
The Relative Strength Index (RSI) at 60 approaches the overbought boundary, signaling a surge in buying pressure.
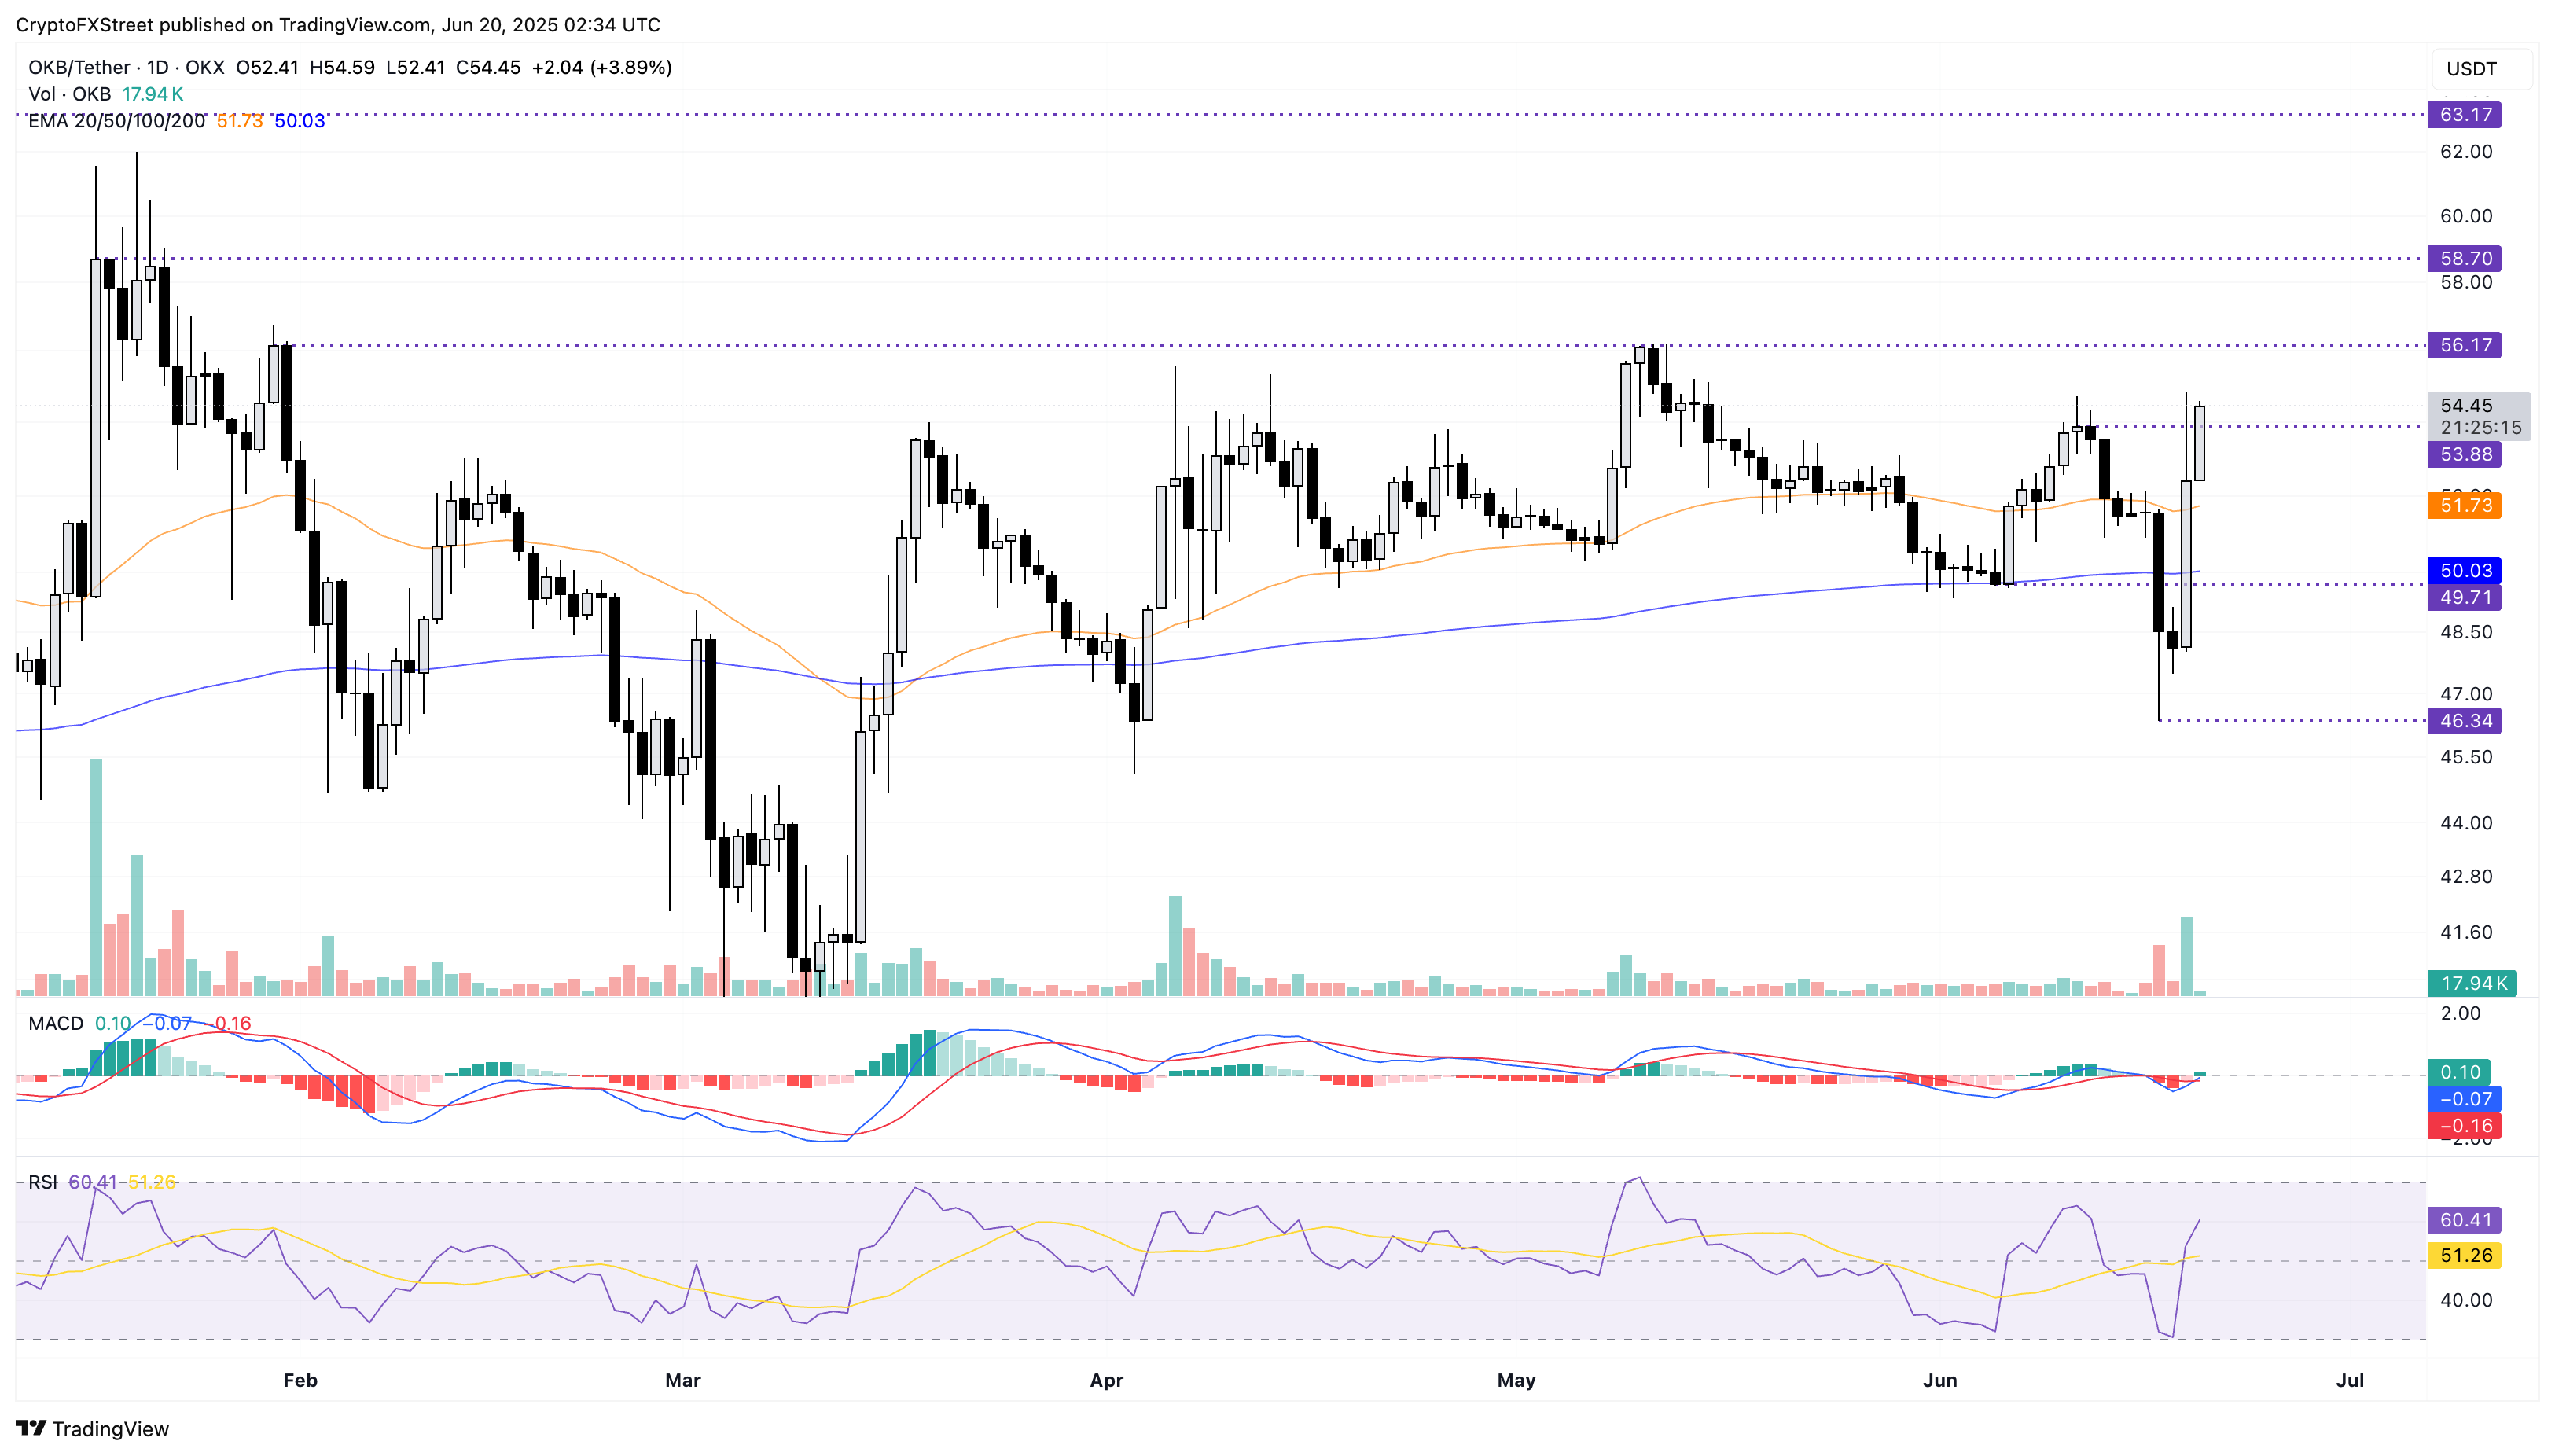
OKB/USDT daily price chart.
If OKB fails to hold above $53, a reversal could retest the $50 psychological level, followed by the $46 low formed on Tuesday.
SEI outgrows a falling channel
SEI prints its third consecutive bullish candle as it nears the $0.20 mark. At the time of writing, SEI edges higher by over 2% at press time on Friday, crossing a resistance trendline formed by declining peaks on May 11, May 23, May 29 and June 11.
A parallel support trendline formed by declining swing lows on May 31, June 5 and June 17 formed a channel with the overhead resistance trendline. A positive closing price on Friday will mark a decisive breakout of the channel, which could prolong the uptrend to $0.2334, the May 23 peak.
The MACD indicator flashes a buy signal with a bullish crossover with its signal line. The RSI at 52 edges above the halfway level, flashing a boost in bullish momentum.
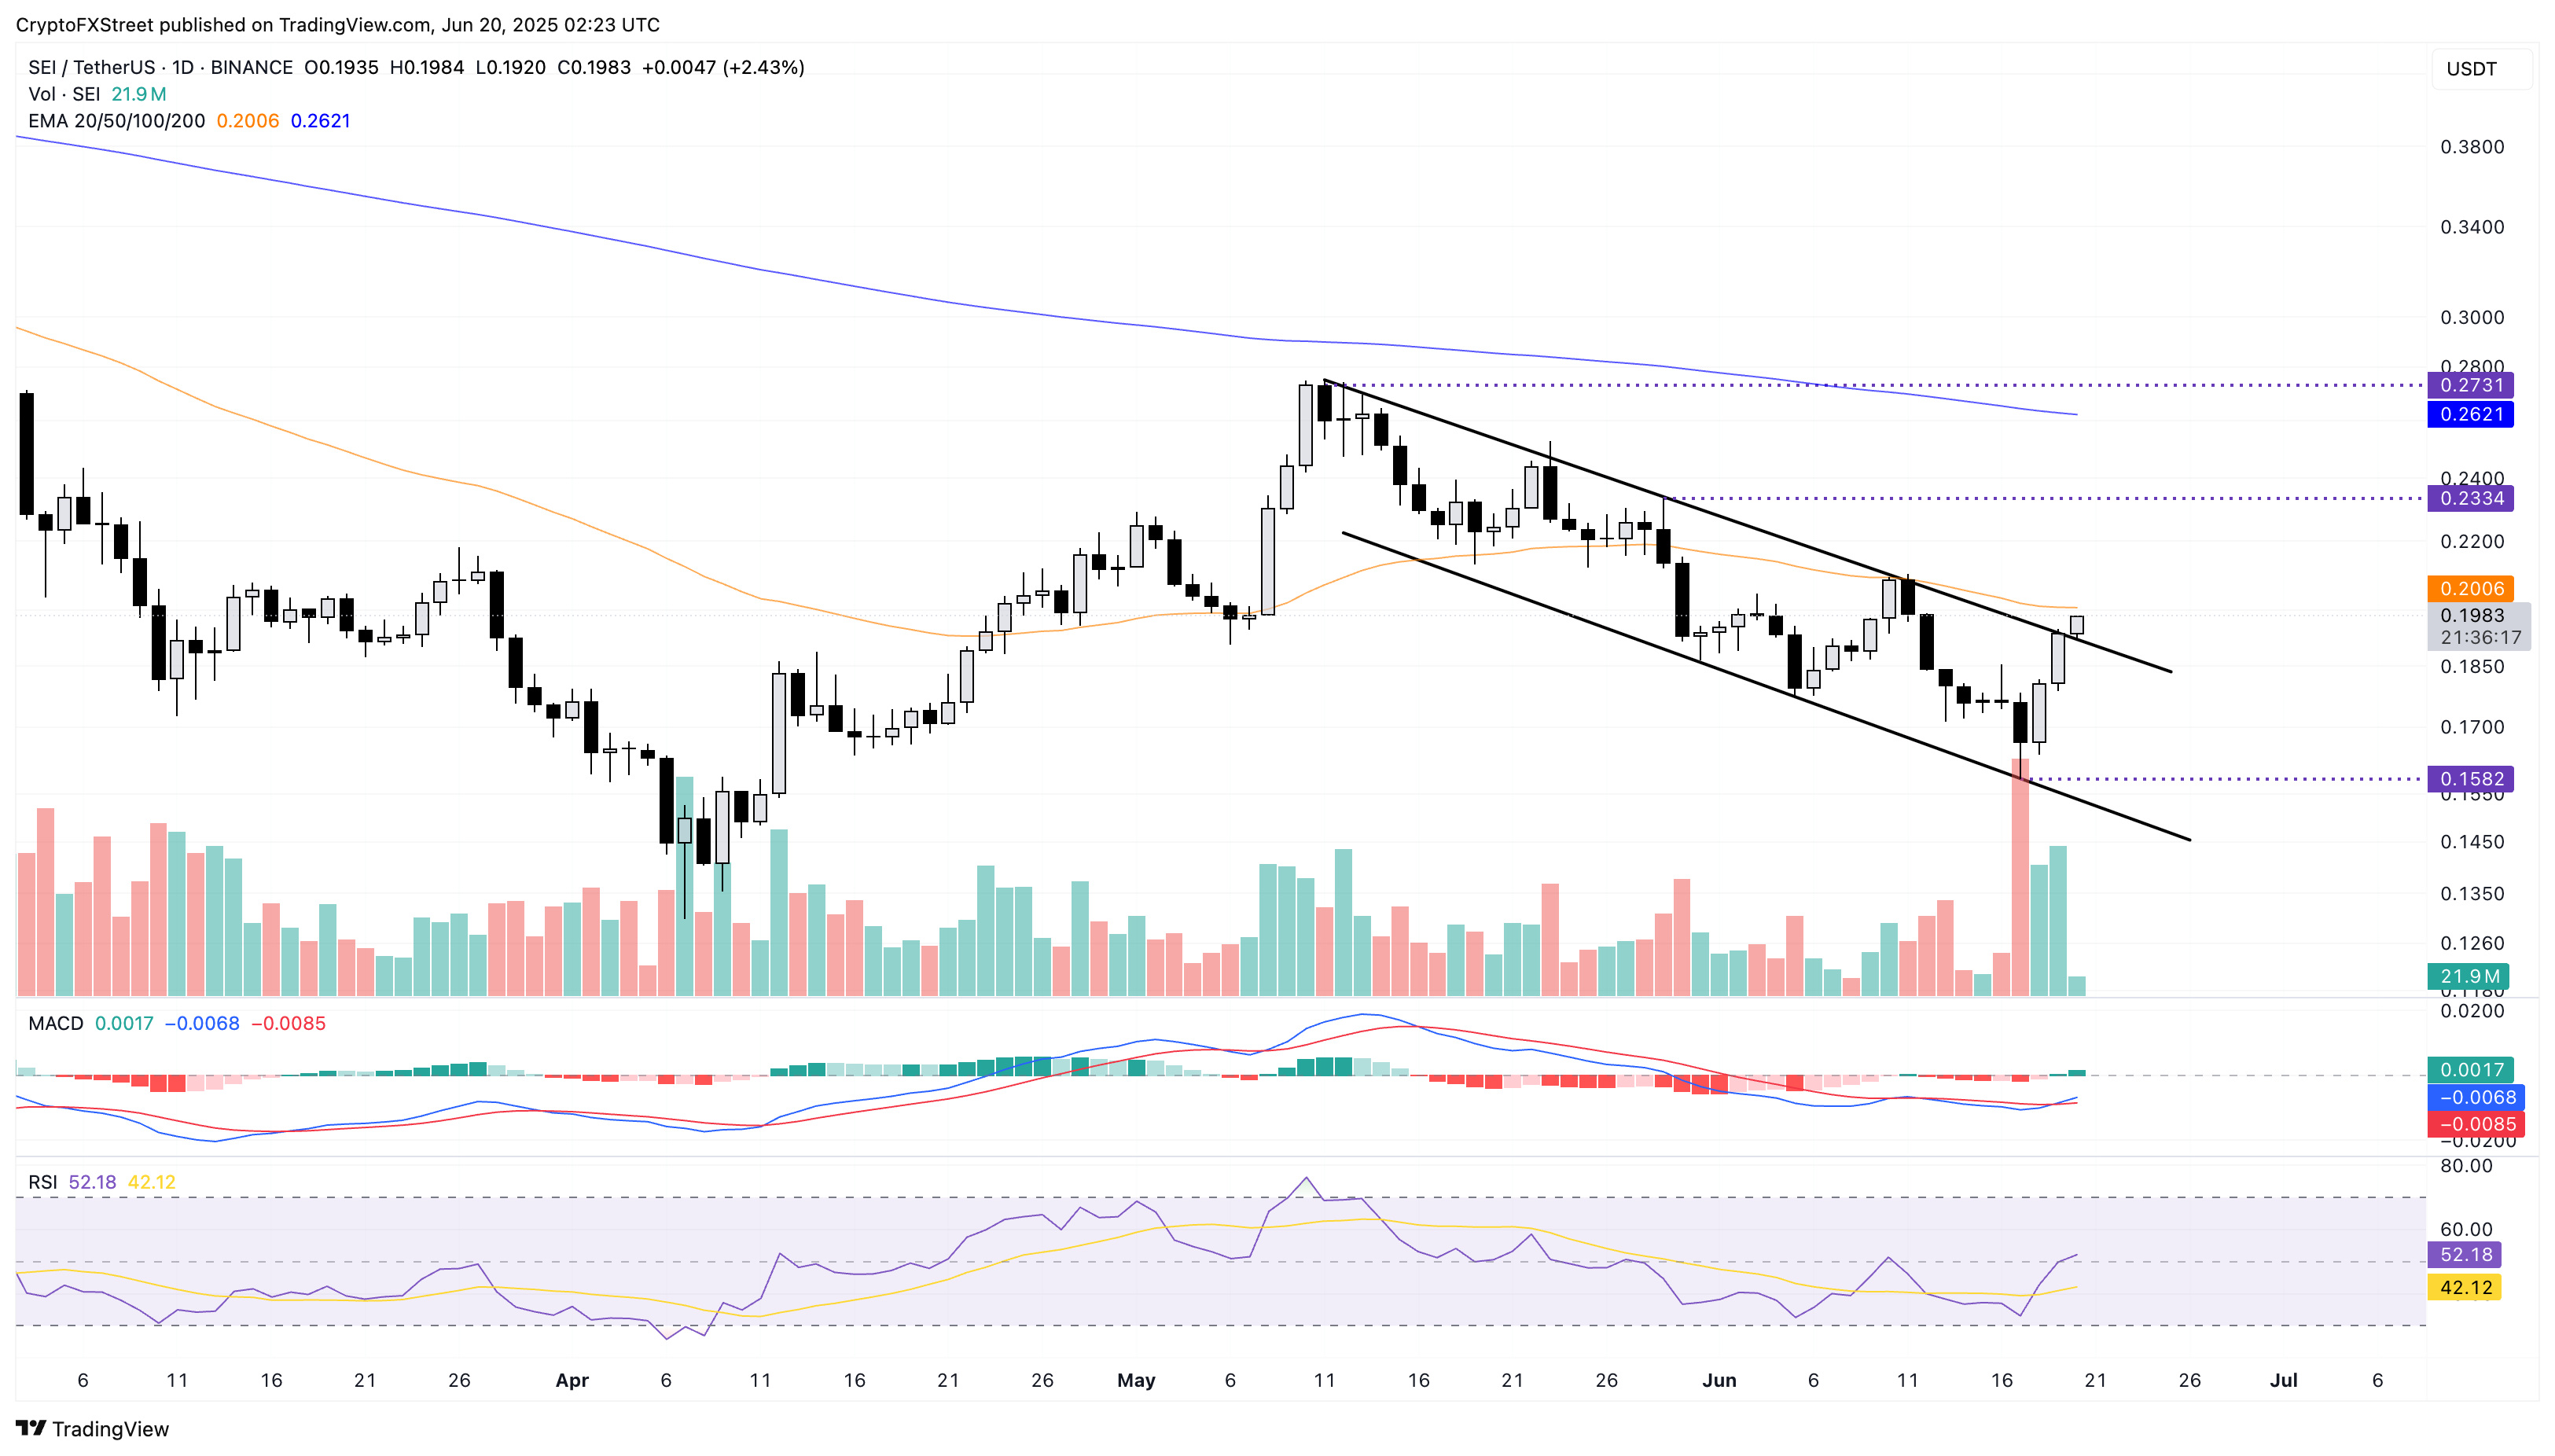
SEI/USDT daily price chart.
If Sei records a negative closing on Friday, it could extend the downtrend within the falling channel towards the weekly low at $0.1582.
Bitcoin Cash nears $500 breakout
Bitcoin Cash maintains its 8% gains from Thursday, trading at $496 at the time of press. BCH nears the $500 psychological level breakout after crossing the 61.8% Fibonacci level at $490, drawn from the 52-week high at $640 to the year-to-date low at $249.
A closing above $500 could prolong the BCH uptrend towards the $556, aligning with the 78.6% Fibonacci level.
The uptrend in the MACD indicator and its signal catalyzes a bullish growth of histogram bars from the zero line, suggesting a surge in buying pressure. The RSI at 70 signals strong bullish momentum, while overbought conditions risk surges that could result in an abrupt pullback.
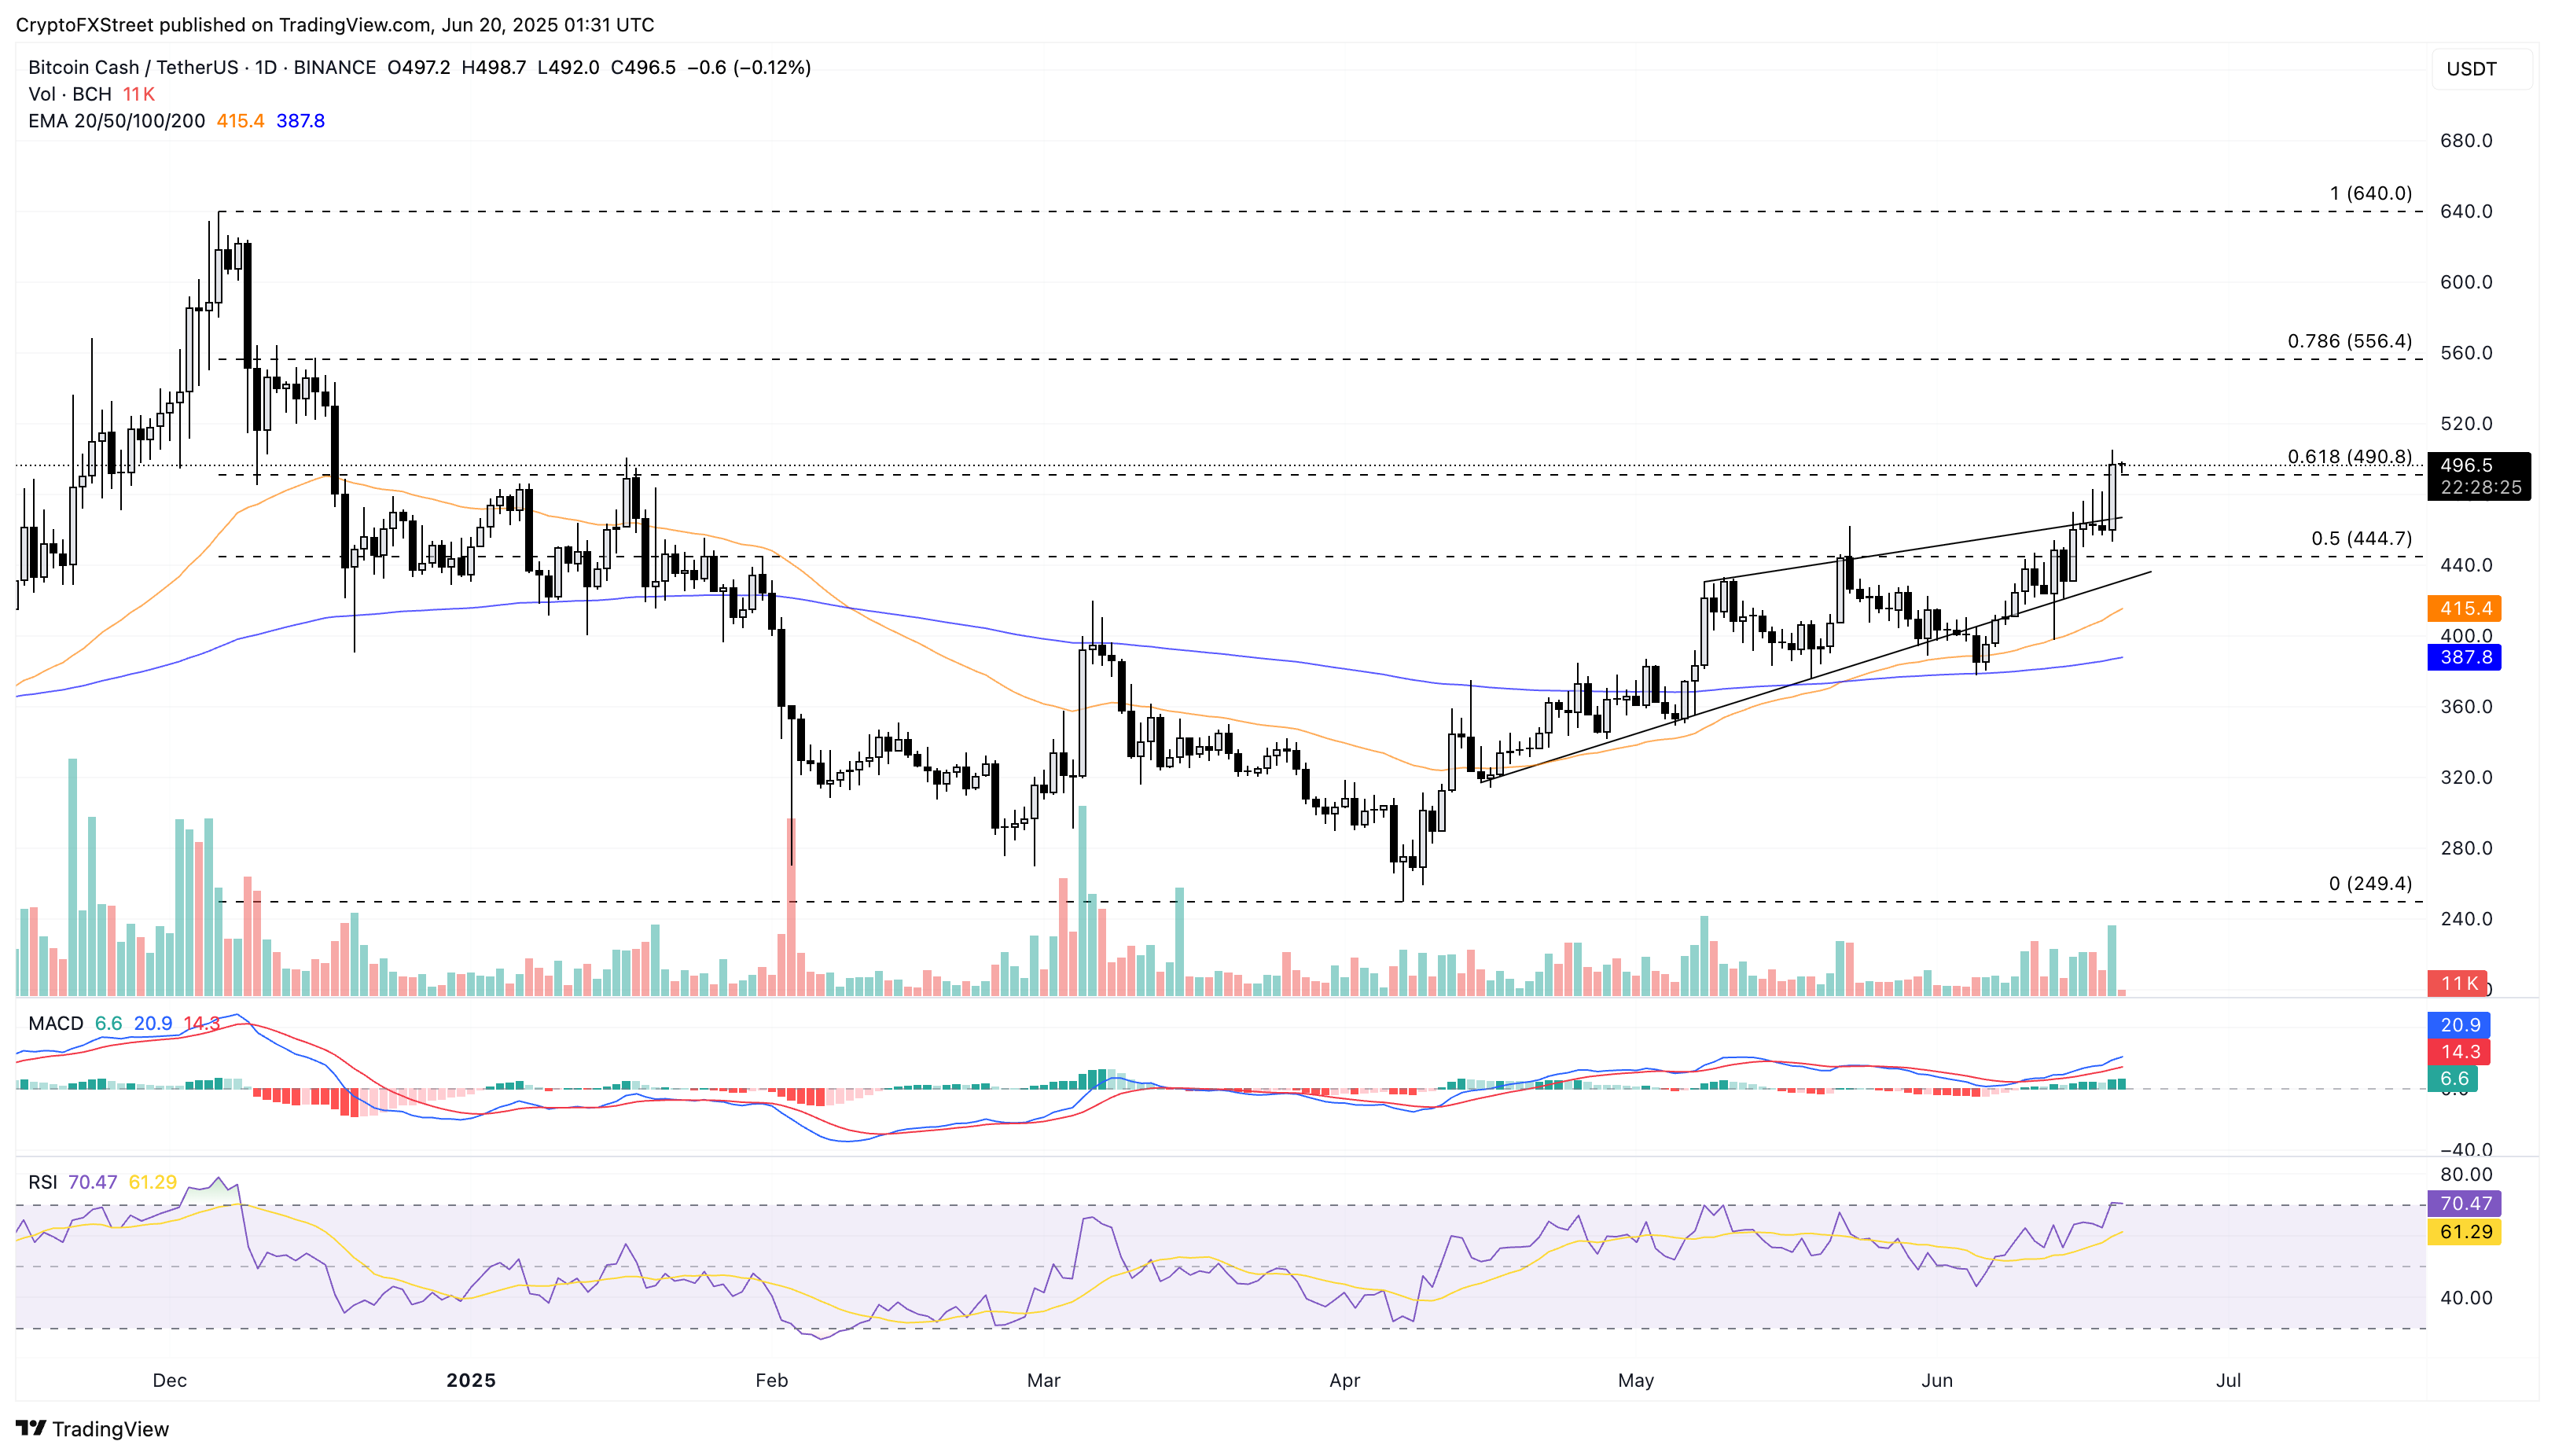
BCH/USDT daily price chart.
A negative daily closing below the 61.8% Fibonacci level could extend Bitcoin Cash’s decline towards $444, aligned with the 50% Fibonacci level.

Log in to Reply
Log in to comment your thoughtsComments
Related Articles
|Square
Get the BTCC app to start your crypto journey
Get started today Scan to join our 100M+ users