Meme Coins Surge: DOGE, SHIB, and PEPE Lead Crypto Market Rally in 2025

Dogecoin, Shiba Inu, and Pepe Coin are flexing their meme muscles again—just as the crypto market shakes off its bearish hangover. Here''s why these joke-tokens-turned-juggernauts are outperforming.
Meme coins defy gravity—again
While ''serious'' investors were busy arguing about real-world assets, DOGE, SHIB, and PEPE quietly stacked double-digit gains. No utility? No problem. The market''s voting with its wallet—and the results are borderline absurd.
The retail cavalry arrives
Trading volumes spiked as weekend traders piled in, proving once again that nothing moves crypto markets faster than the collective FOMO of bored normies with smartphone wallets. Wall Street analysts are reportedly grinding their teeth into dust.
Crypto''s class clown gets the last laugh
While blue-chip DeFi tokens crawl toward recovery, meme coins are already partying like it''s 2021. Maybe the real ''store of value'' was the friends we gambled with along the way.
Dogecoin’s first uptick in six days
Dogecoin trades in the green by almost 1% at press time on Monday as it bounces off the $0.1710 support level formed by the lowest closing price in June. With a potential tweezer bottom in making, Dogecoin prepares for its second turnaround from this level.
This could trigger a double bottom pattern possibility with a neckline at $0.1987, the closing price of June 10. Thus, Doge shows potential to test the immediate resistance at this level.
A potential closing above the neckline could extend the breakout rally towards the $0.2506 peak formed on May 10.
The Relative Strength Index (RSI) momentum indicator at 40 gradually recovers from the oversold boundary in the daily chart, while DOGE records a second bottom at the $0.1710 support floor. This signals a bullish RSI divergence supporting uptrend chances with significant room for growth before reaching the overbought zone.
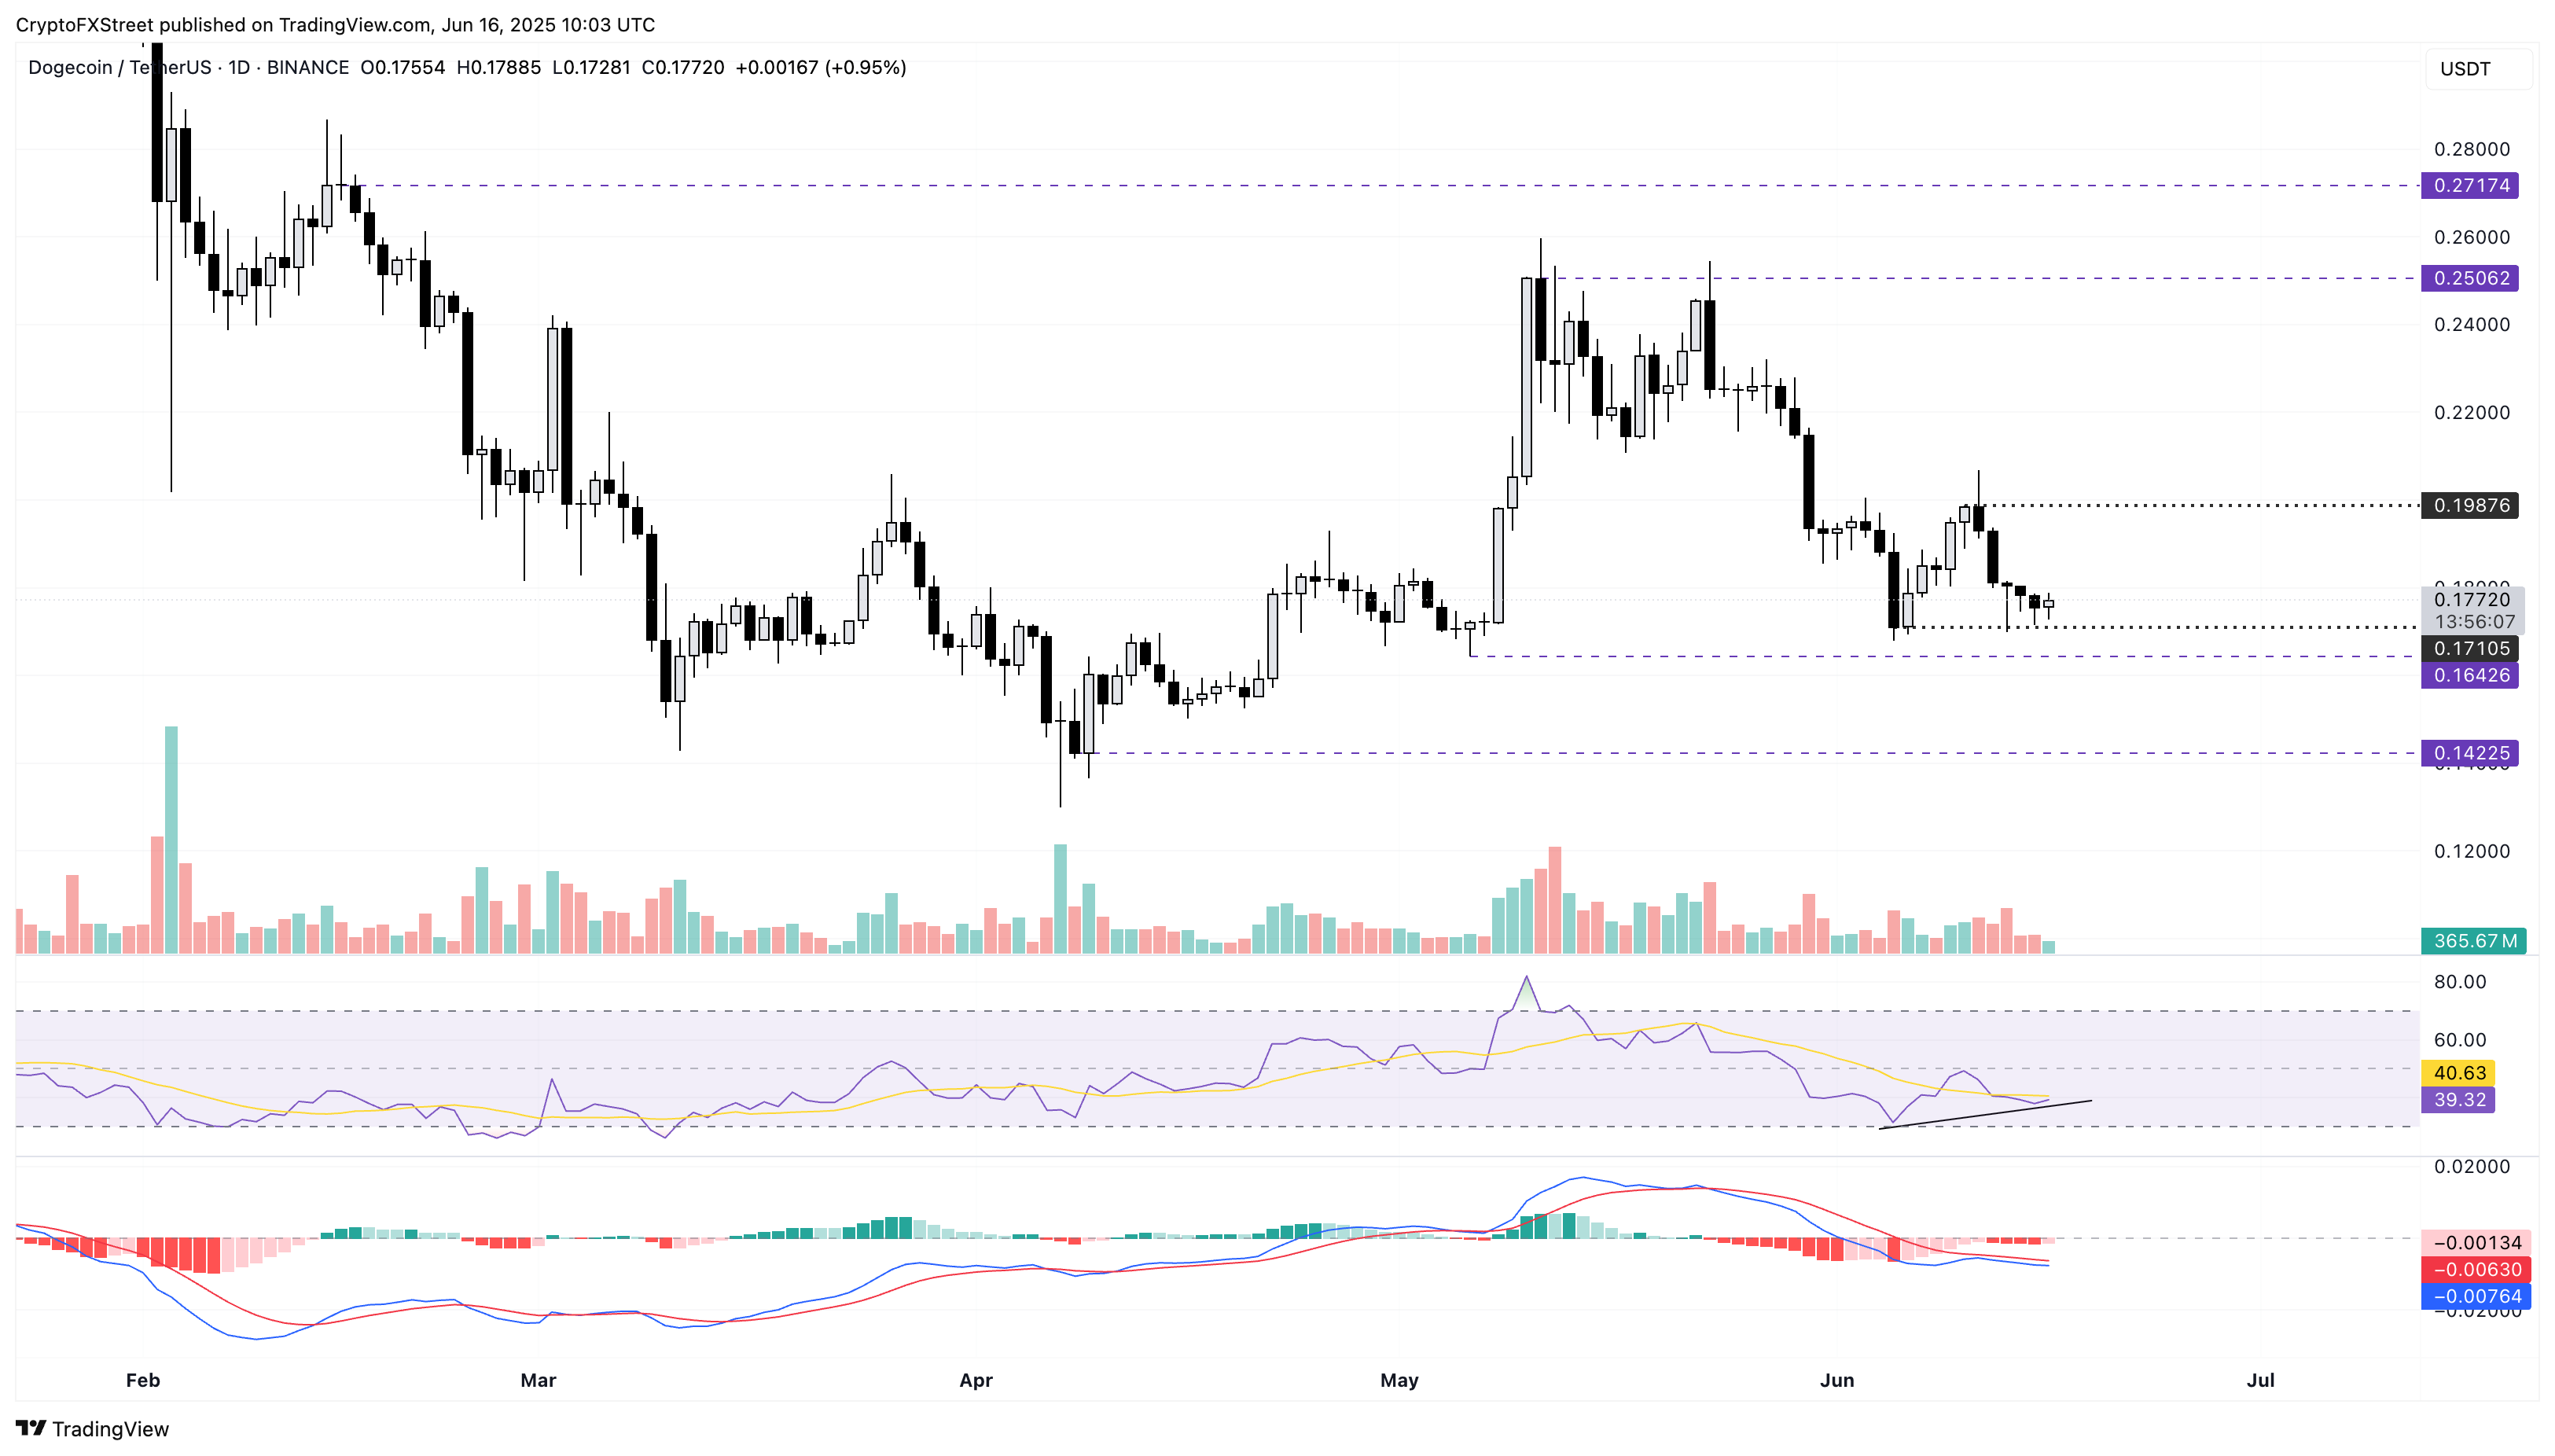
DOGE/USDT daily price chart.
However, a closing below $0.1710 will nullify the double bottom pattern. In such a scenario, DOGE could test the $0.1642 support formed on May 6.
Shiba Inu mimics Dogecoin’s double bottom recovery
Shiba Inu avoids a close below the critical support level at $0.00001220, marked by June''s lowest closing (June 5) so far, despite increased pressure last week. After multiple long-tailed candles, SHIB is up by over 1% at press time on Monday, hinting at a trend reversal.
Similar to DOGE, shiba inu teases a double bottom pattern as it bounces off the $0.00001220 support with a neckline at $0.00001337, the highest closing price last week. A clean push in closing price above the neckline will mark the pattern breakout.
The similarity with DOGE extends to the momentum indicator as a bullish RSI divergence manifests in the daily chart. The RSI indicator at 40 shows a recovery approaching the halfway line, suggesting a gradual rise in bullish momentum.
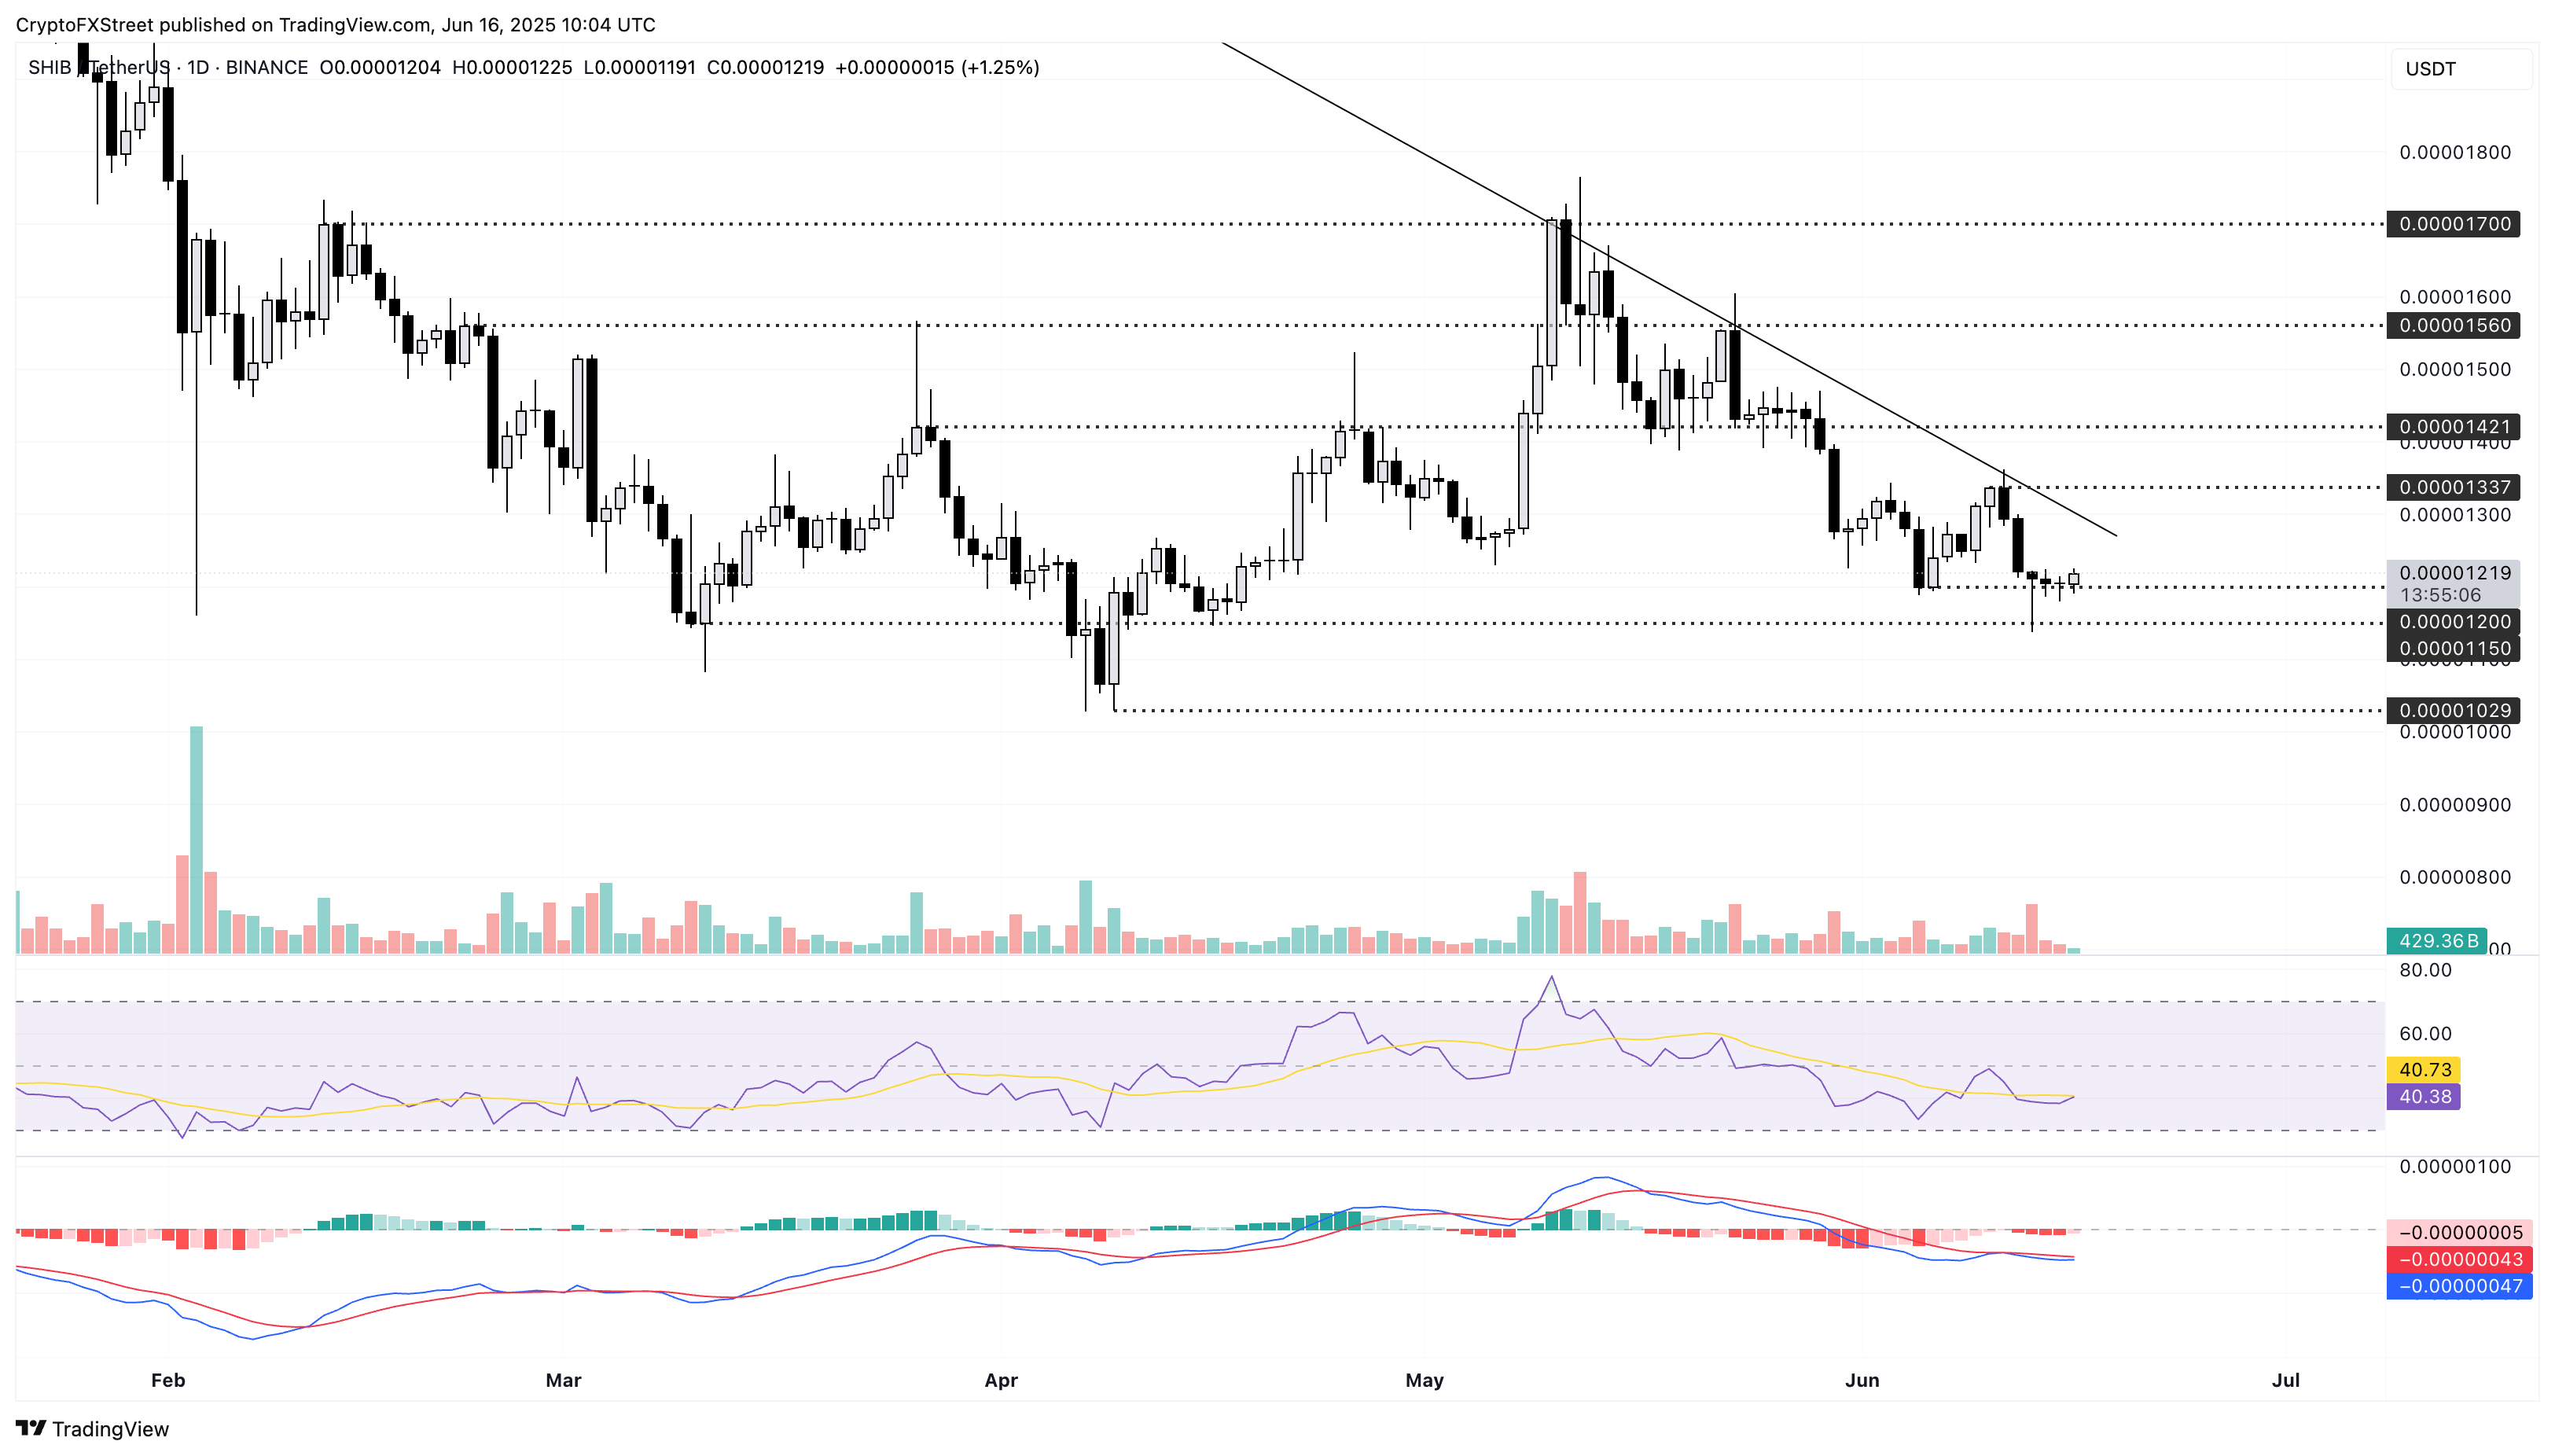
SHIB/USDT daily price chart.
However, a closing below the $0.00001220 support floor will nullify the bullish pattern. In such a case, SHIB could extend the correction to test the $0.00001150 level last tested on April 16.
Pepe recovery crosses key resistance
Pepe’s pullback last week bottomed out before risking a close below the $0.00001000 psychological support level. At the time of writing, Pepe trades at $0.00001139, with a nearly 10% surge from its Friday low of $0.00001044.
The recovery rally has crossed above the $0.00001119 resistance last tested by a reversal on Sunday on the 4-hour chart. With a clean closing price push above this key resistance, PEPE now targets the $0.00001208 resistance marked by a swing low on May 17.
The RSI indicator at 51 crosses above the halfway line, signalling a turn in momentum favouring bulls in the 4-hour chart. As RSI needs to cover space before reaching overbought conditions, the indicator projects room for growth in the PEPE price.
Further up, the Moving Average Convergence/Divergence (MACD) indicator crosses above its signal line, marking a bullish crossover. This aligns with the trend reversal thesis and backs upside chances.
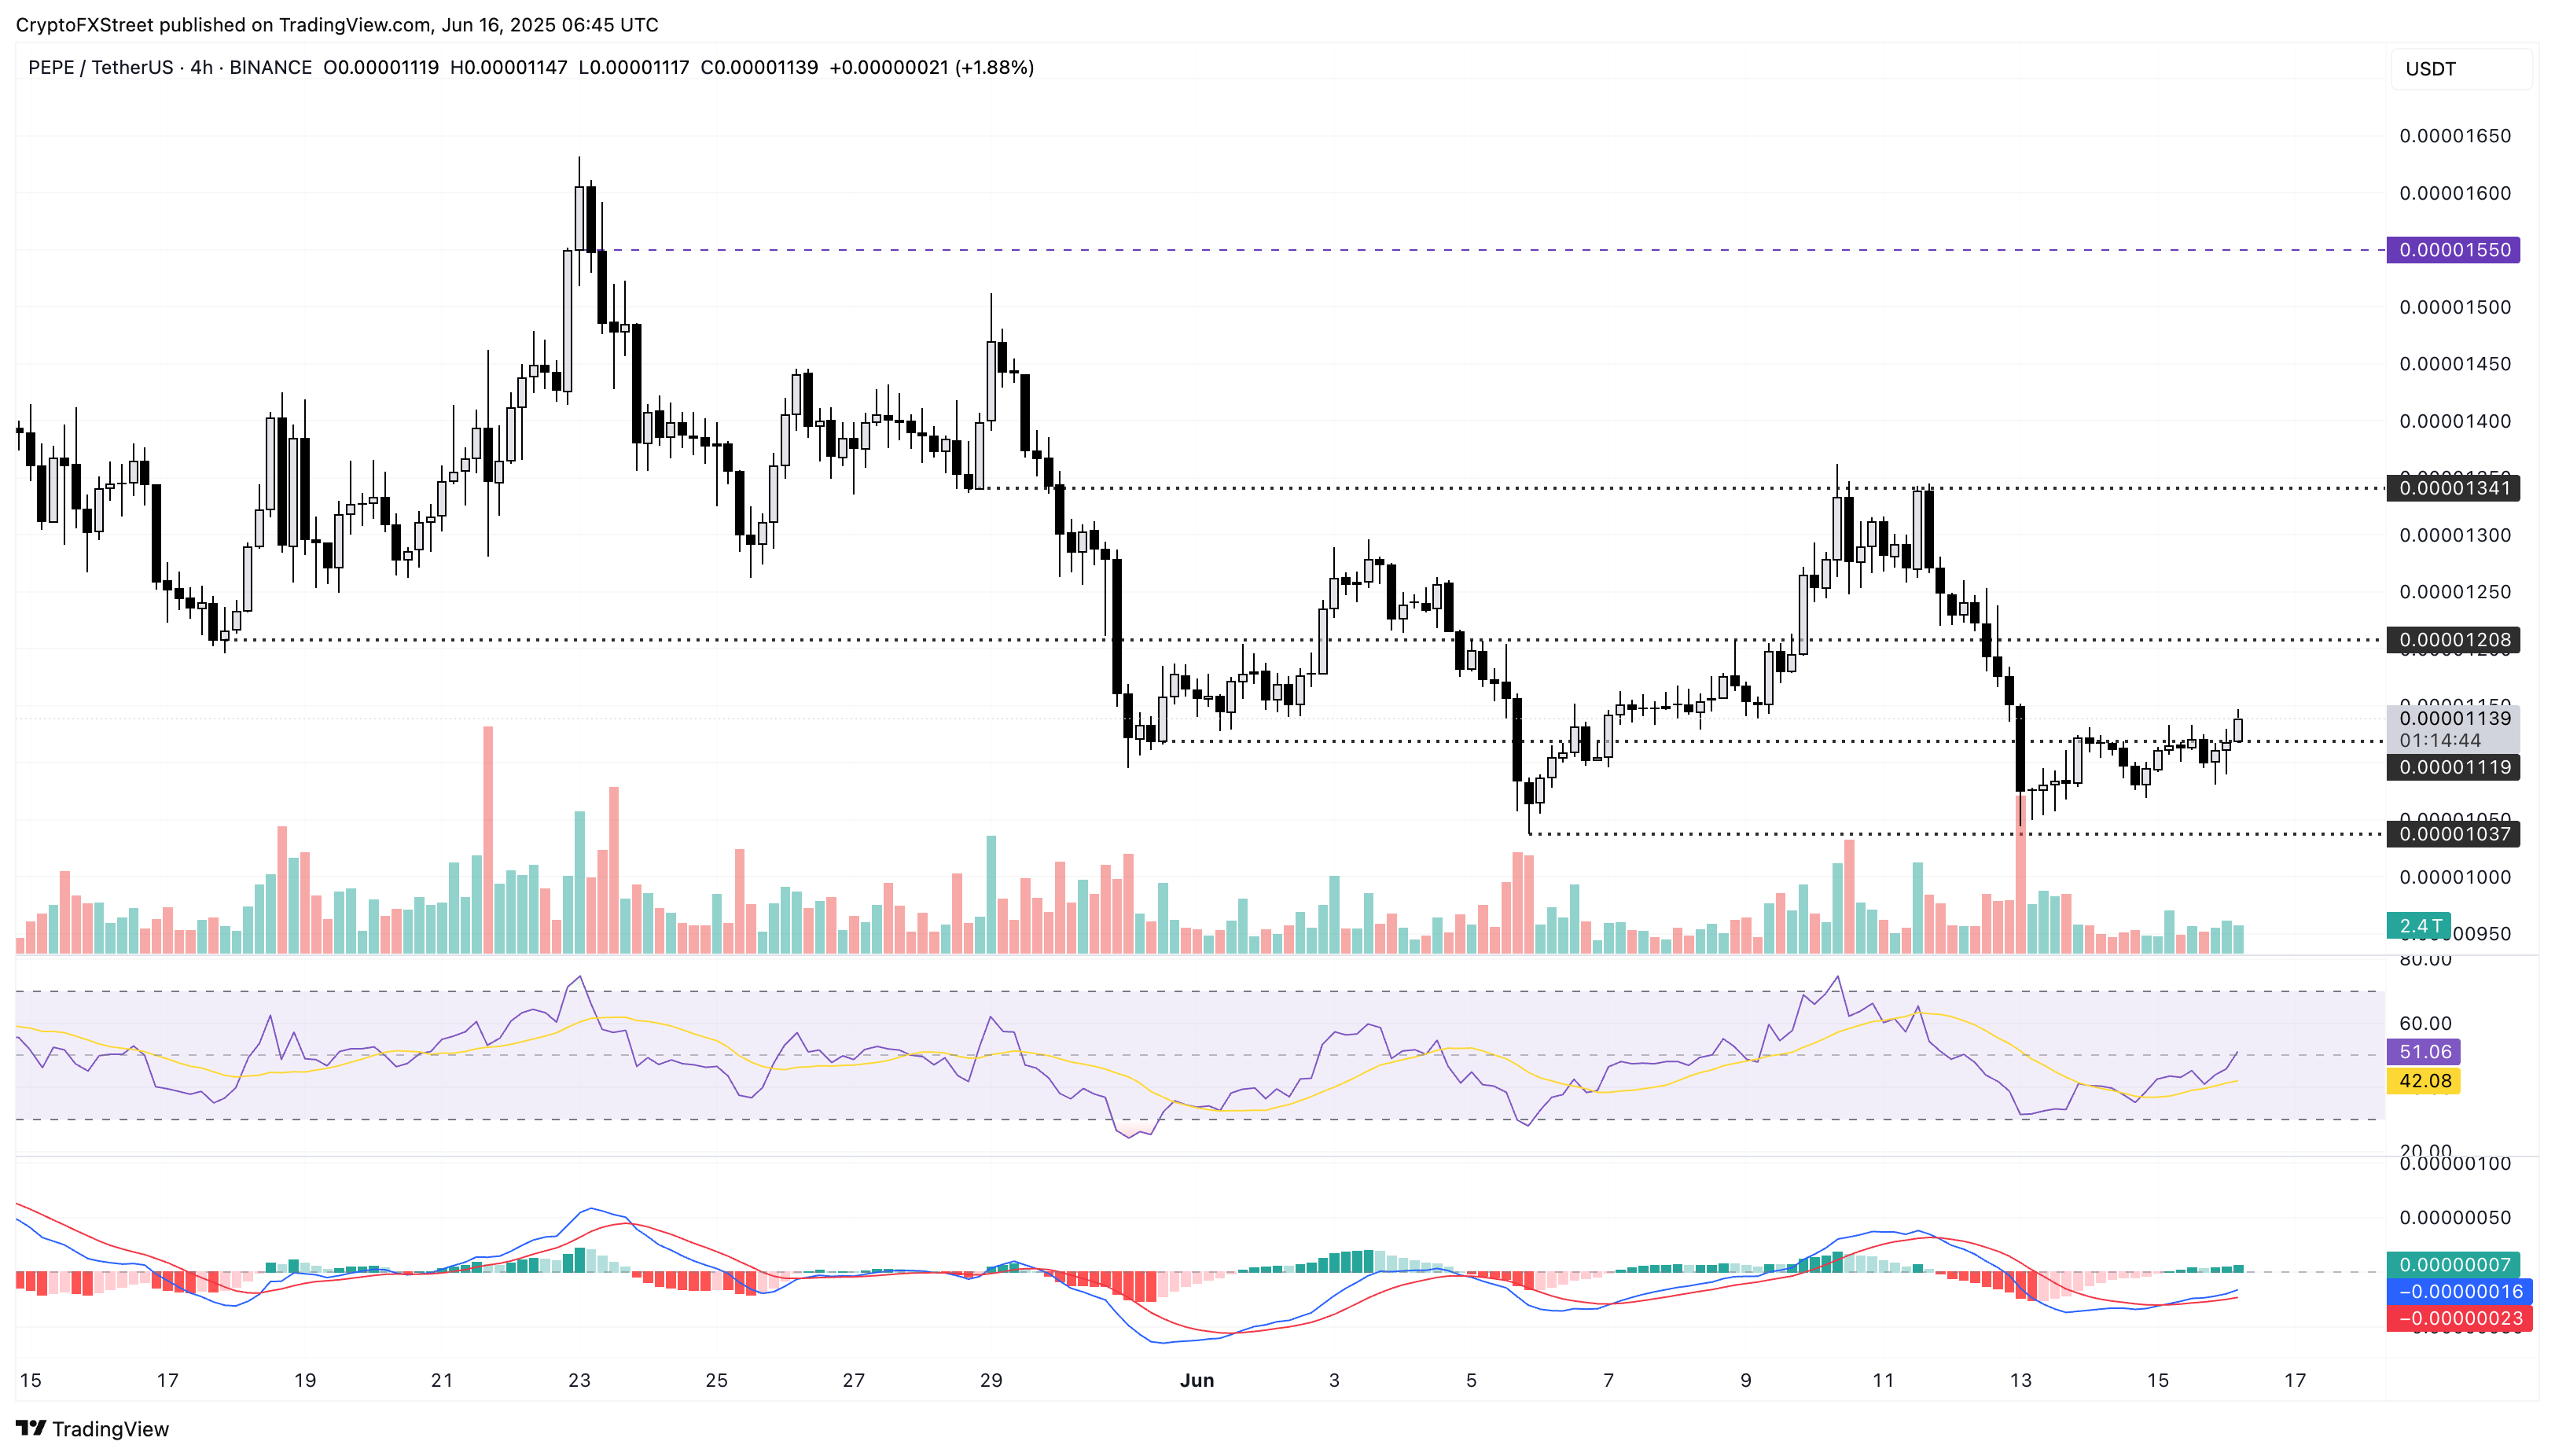
PEPE/USDT 4-hour price chart.
If Pepe fails to hold support at $0.00001119, a steeper correction towards $0.00001000 is possible.
