Hyperliquid Price Surge: Bulls Charge Toward New All-Time High in 2025

Hyperliquid''s rally defies gravity—again. The perpetual contract protocol''s token is painting the charts green as bulls obliterate resistance levels. Here''s why traders are doubling down.
Momentum builds toward ATH
Liquidity floods the order books while shorts get squeezed into oblivion. Retail FOMO meets institutional accumulation—classic pump ingredients, minus the SEC subpoena (for now).
Perp warriors stack paper
Funding rates stay positive but reasonable, suggesting sustainable growth rather than degenerate leverage. Of course, ''reasonable'' in crypto still means 5x positions with lunch money collateral.
The cynical take
Another ''fundamentals-driven'' rally where the only fundamental is bigger fools bidding up your bags. But hey—when the music''s playing, you either dance or watch from the sidelines crying over your 2022 trauma.
Hyperliquid’s bullish bets rise
Coinglass’ data shows that the futures’ OI in HYPE at exchanges rose from $1.79 billion on Sunday to $1.97 billion on Monday, a new all-time high (ATH). An increasing OI represents new or additional money entering the market and new buying, which could drive Hyperliquid’s price to a new all-time high.
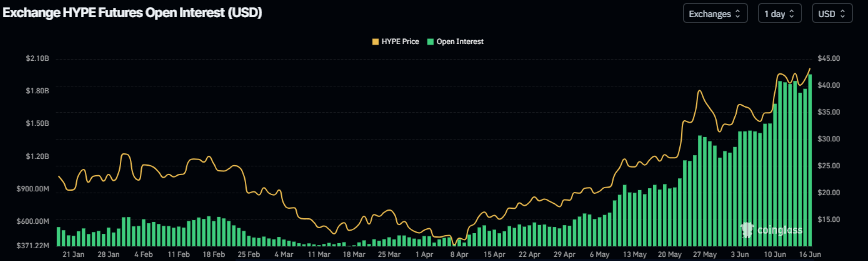
HYPE Open Interest chart. Source: Coinglass
Another bullish sign is Coinglass’s long-to-short ratio, which reads 1.20, the highest level in over a month. This ratio, above one, reflects bullish sentiment in the markets, as more traders are betting on the Hyperliquid Price to rise.
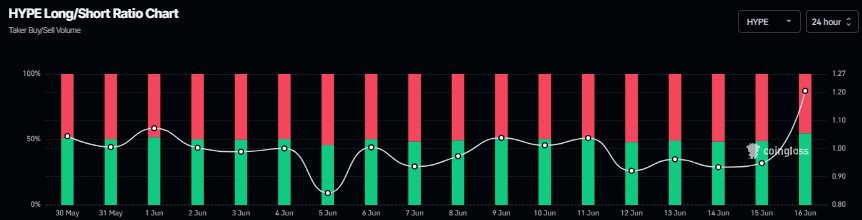
HYPE long-to-short ratio chart. Source: Coinglass
Hyperliquid Price Forecast: HYPE bulls target record high at $46
Hyperliquid price reached a new all-time high of $44.08 on Wednesday and declined slightly the following day. However, HYPE price retested and found support around the daily level of $39.11 on Saturday and ROSE slightly the next day. At the time of writing on Monday, it continues to trade higher by 5% and heads toward its ATH of $44.08.
If HYPE continues its upward trend, it could extend the rally to set a new ATH of $46.35, the 141.40% Fibonacci extension drawn from the December high of $35.51 to the April low of $9.32.
The Relative Strength Index (RSI) reads 68, which is above its neutral level of 50 but below its overbought level of 70, indicating strong bullish momentum. The Moving Average Convergence Divergence (MACD) indicator also displayed a bullish crossover last week , giving buy signals and suggesting a continuation of an upward trend.
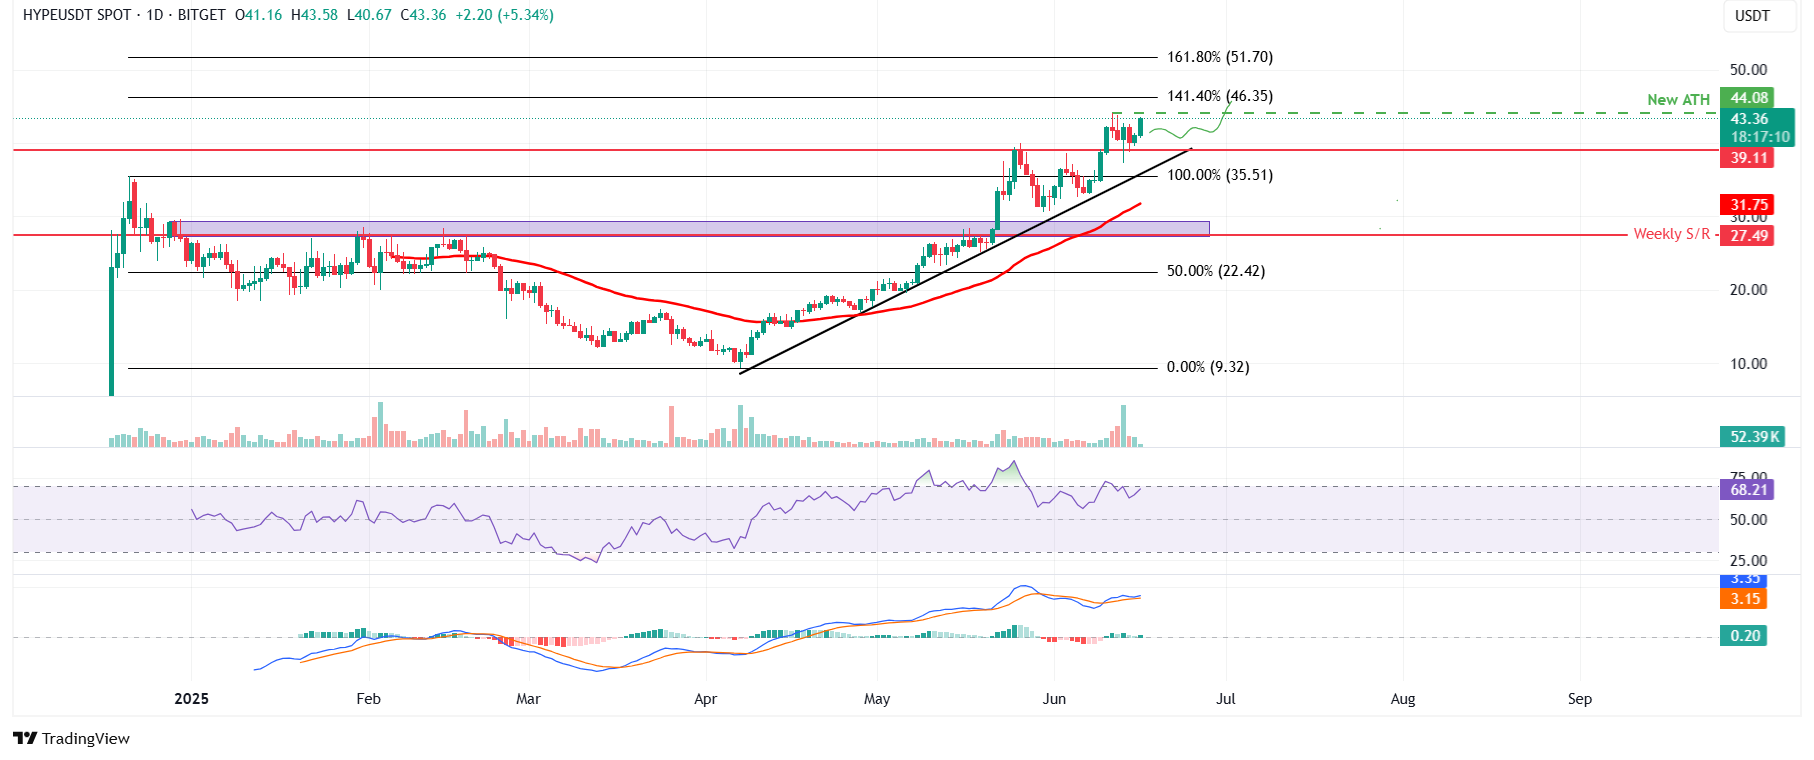
HYPE/USDT daily chart
In case of a correction, HYPE could decline to find support around its daily level of $39.11.

Log in to Reply
Log in to comment your thoughtsComments
Related Articles
|Square
Get the BTCC app to start your crypto journey
Get started today Scan to join our 100M+ users