Crypto Carnage: Bitcoin Plunges Below $103K, Dragging FARTCOIN, ENA, LDO Into Abyss

Crypto markets bled out today as Bitcoin''s nosedive below $103,000 triggered a violent altcoin massacre. The domino effect hit meme coins and DeFi darlings alike—no safe havens here.
FARTCOIN gets flushed
The meme coin du jour cratered 40% in 3 hours, proving once again that ''utility'' matters less than liquidity when whales dump. Retail bagholders now face the classic crypto dilemma: diamond hands or panic sells?
ENA and LDO: DeFi''s house of cards
Yield farming protocols ENA and LDO got wrecked with 25-30% losses. Turns out algorithmic stablecoins aren''t so stable when BTC volatility goes nuclear. Who could''ve predicted that (aside from every skeptic since 2021)?
The silver lining? Another ''buy the dip'' opportunity for degenerates who think risk management is for TradFi boomers. Just remember: past performance guarantees absolutely nothing—except maybe more pain.
Bitcoin finds support at the 50-day EMA
Bitcoin trades in the red on Friday at press time, briefly dropping under $103,000 to $102,664. With the third consecutive bearish candle, BTC erases the recovery earlier this week and is down nearly 2% so far this week.
Bitcoin marks a short-term recovery as it bounces off the high-demand zone, marked in a green band, above $102,000 and the rising 50-day Exponential Moving Average (EMA) at $104,458. This creates a minor shadow in the intraday candle, projecting recovery chances later in the day.
The Moving Average Convergence/Divergence (MACD) indicates a failed bullish reversal, as it reverses from its signal line without crossing above it. With the resurgence of bearish histograms, the indicator suggests a pullback phase is underway.
The Relative Strength Index (RSI) at 45 steps under the halfway level indicates a loss in bullish momentum. As RSI edges lower towards the oversold zone, it warns of further downside.
A daily close under the 50-day EMA at $104,458 could violate the support zone above $102,000. In such a case, sidelined investors could find an entry opportunity with $100,372, the 30-day lowest trading price, as the next immediate support.
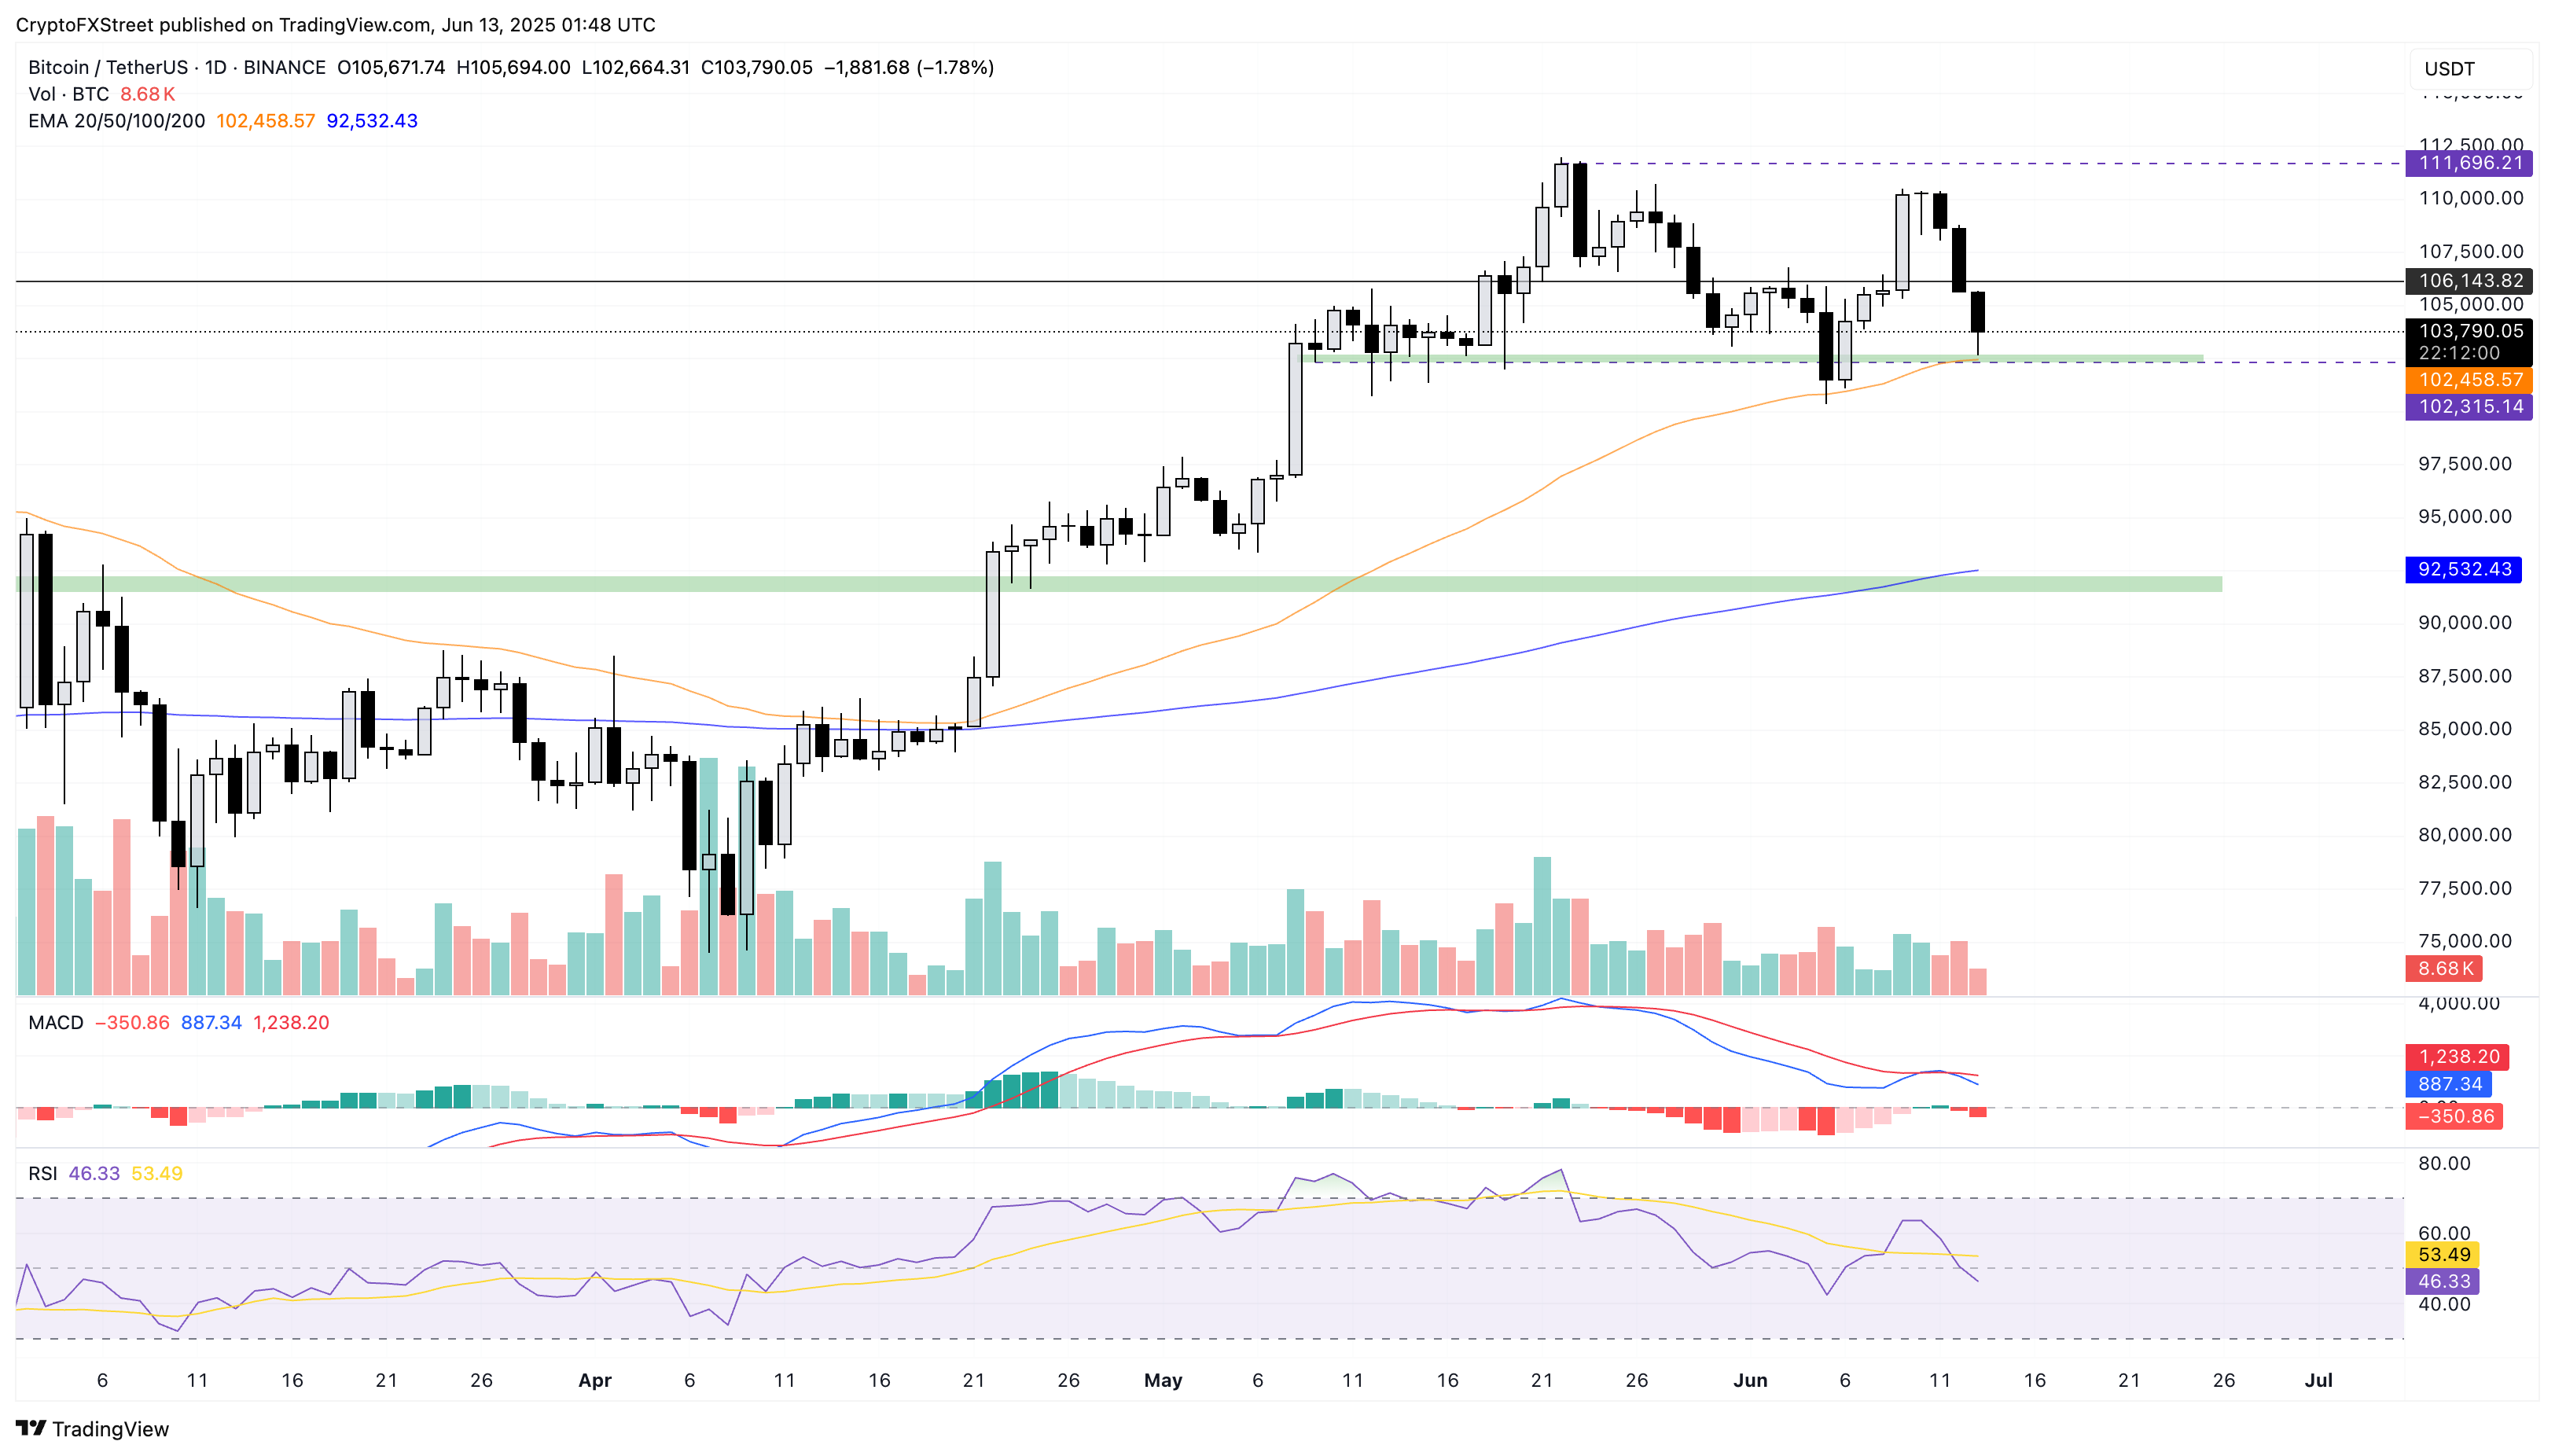
BTC/USDT daily price chart.
However, a recovery later in the day, as Bitcoin upholds the 50-day EMA, could result in a consolidation move before taking a recovery run towards the all-time high of $111,980.
Fartcoin’s reversal risks $1 fallout
Fartcoin marks its third consecutive bearish day, reversing from Wednesday’s high at $1.53. Crossing below its 50-day EMA at $1.13, the meme coin is down by over 10% to $1.09 at press time on Friday.
The momentum indicator suggests a sharp surge in bearish momentum as the RSI at 45 drops below the halfway line and the MACD nears crossing below its signal line.
The immediate support lies at $0.92, marked by the low on May 7, if it breaks below the $1 psychological support level.
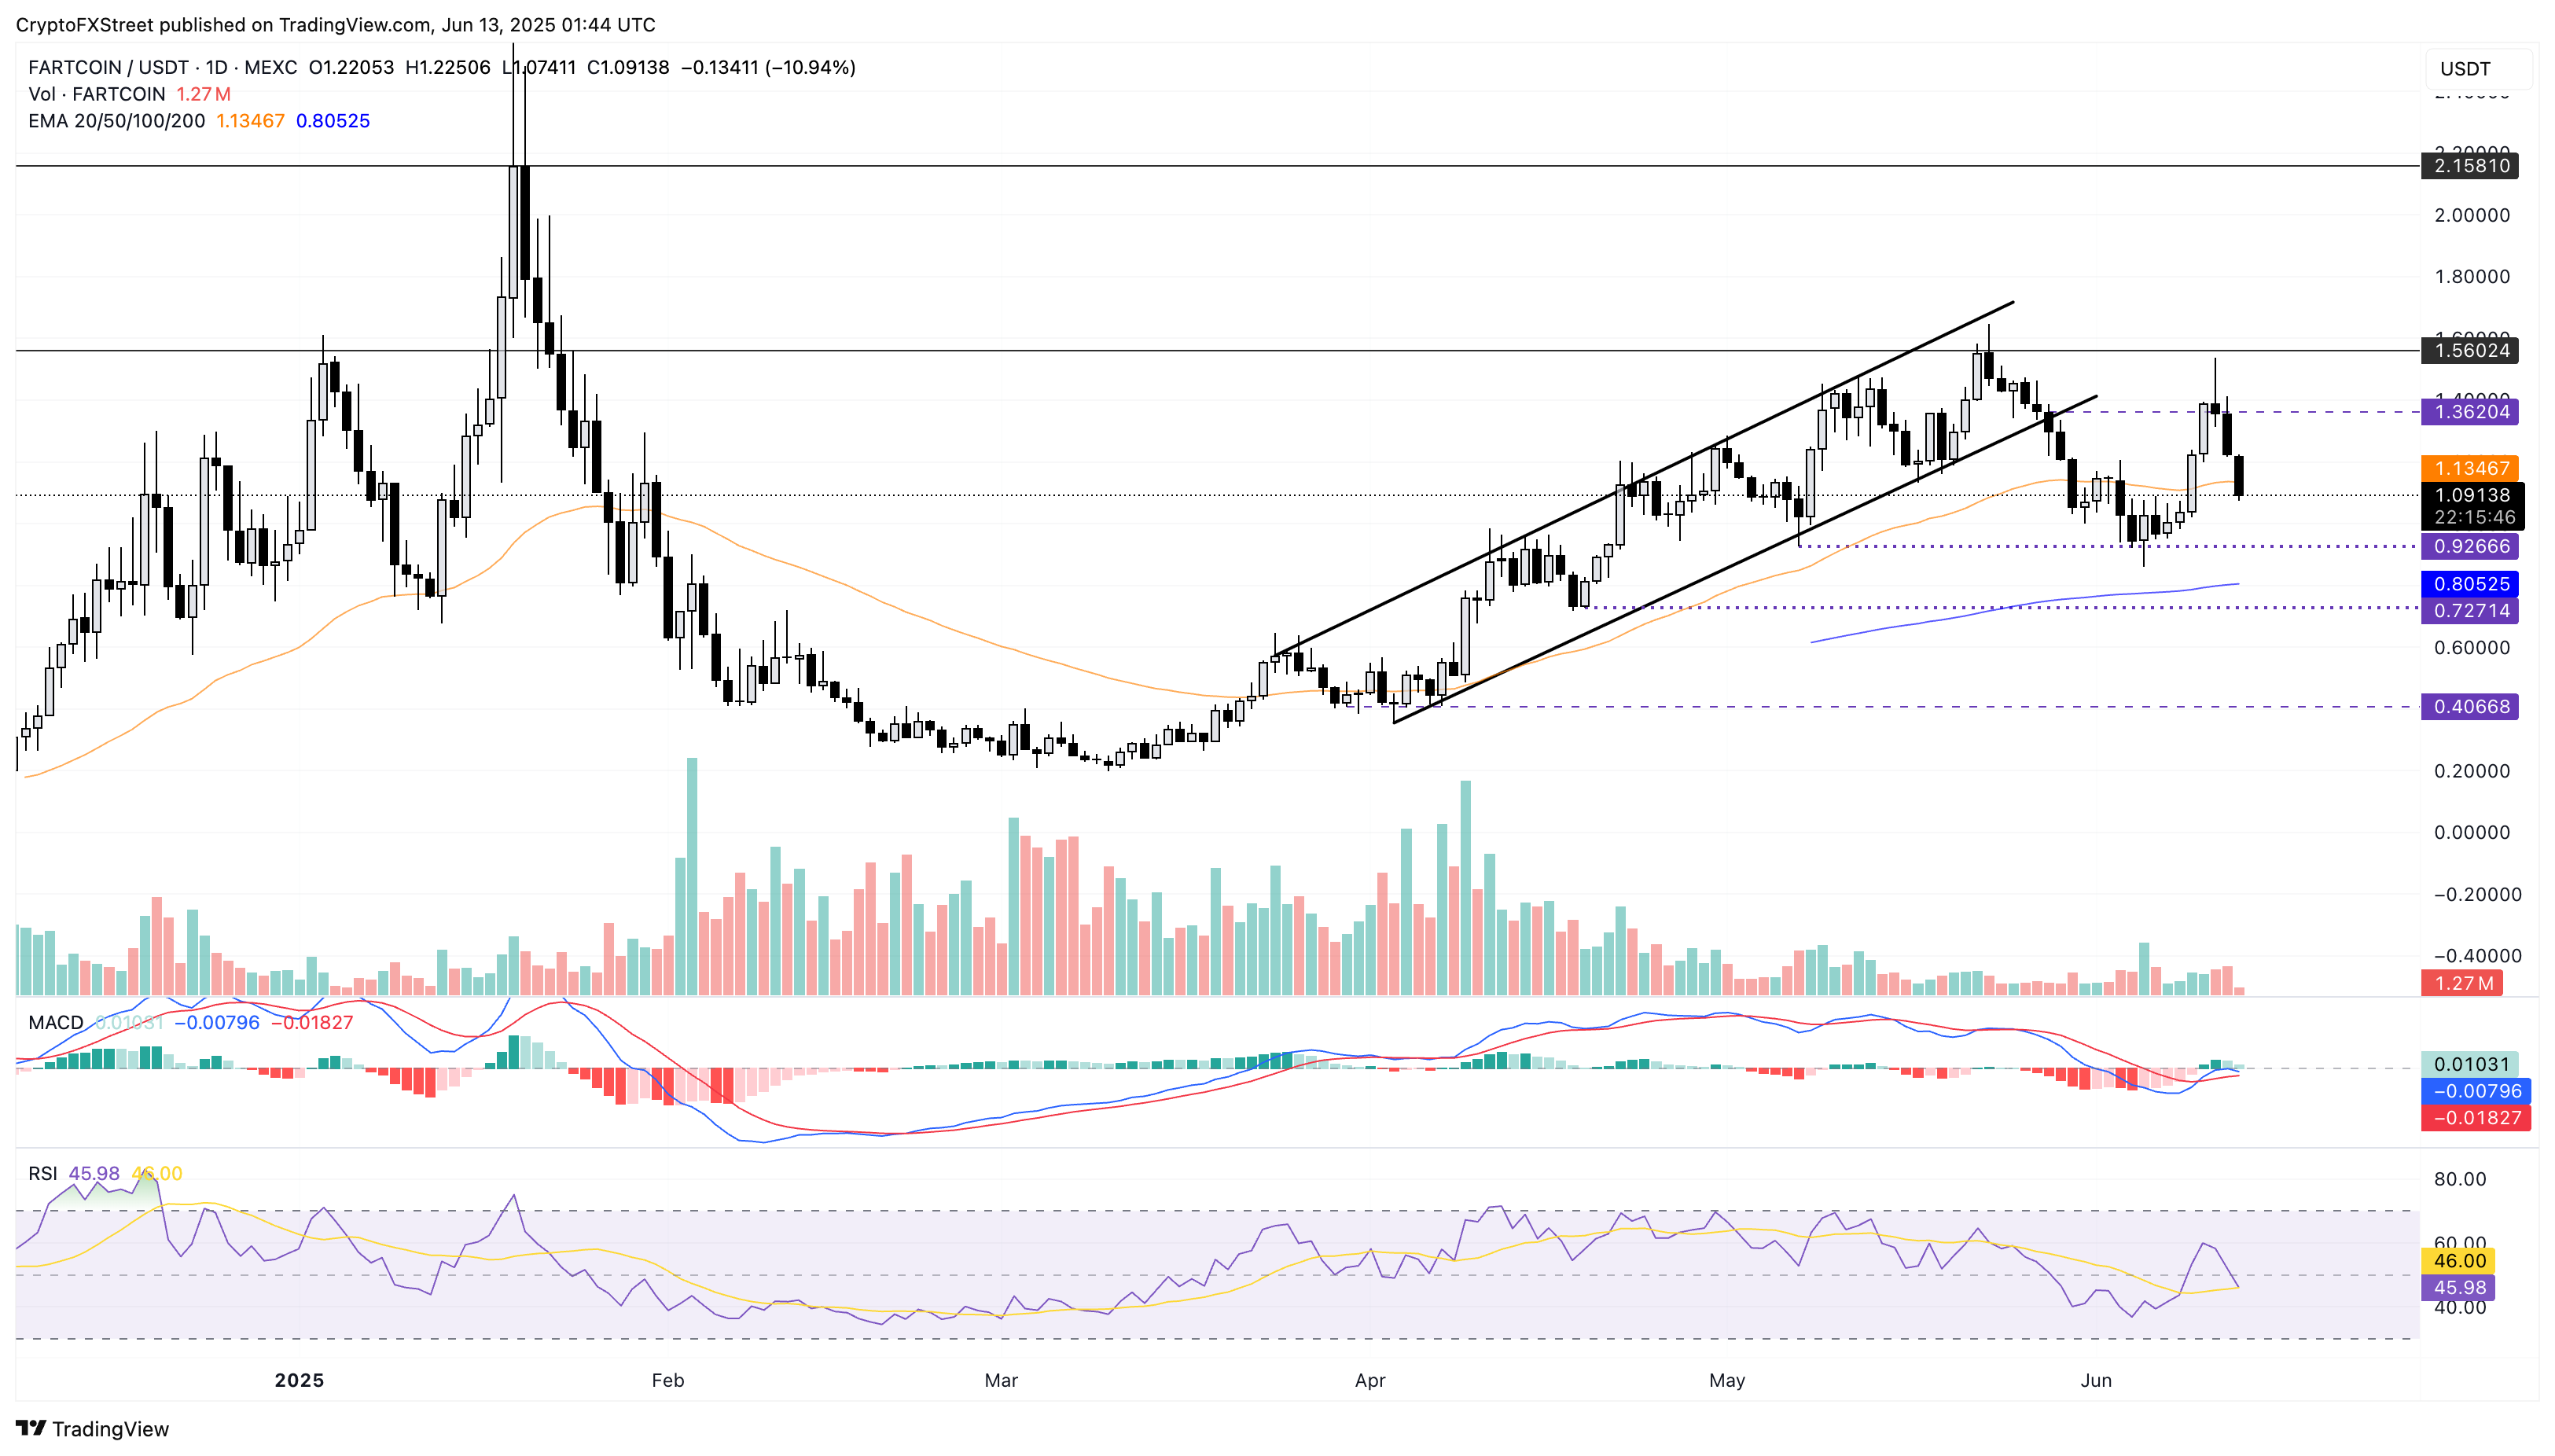
FARTCOIN/USDT daily price chart.
A reversal above $1.36 will nullify the downfall and could result in a surge towards the Wednesday high at $1.53.
Downtrend prolongs in ENA, risks $0.25 retest
Ethena prolongs the lower high trend with the recent reversal from $0.37 on Wednesday. With an over 20% drop in the last three days, ENA tests the support level at $0.28, marked by a low last Thursday.
The momentum indicators on the daily chart show a similar bearish momentum surge to other coins. The MACD indicator drops below its signal line while the RSI at 41 nears the oversold zone.
A closing below $0.28 could test the lowest 30-day trading price at $0.25.
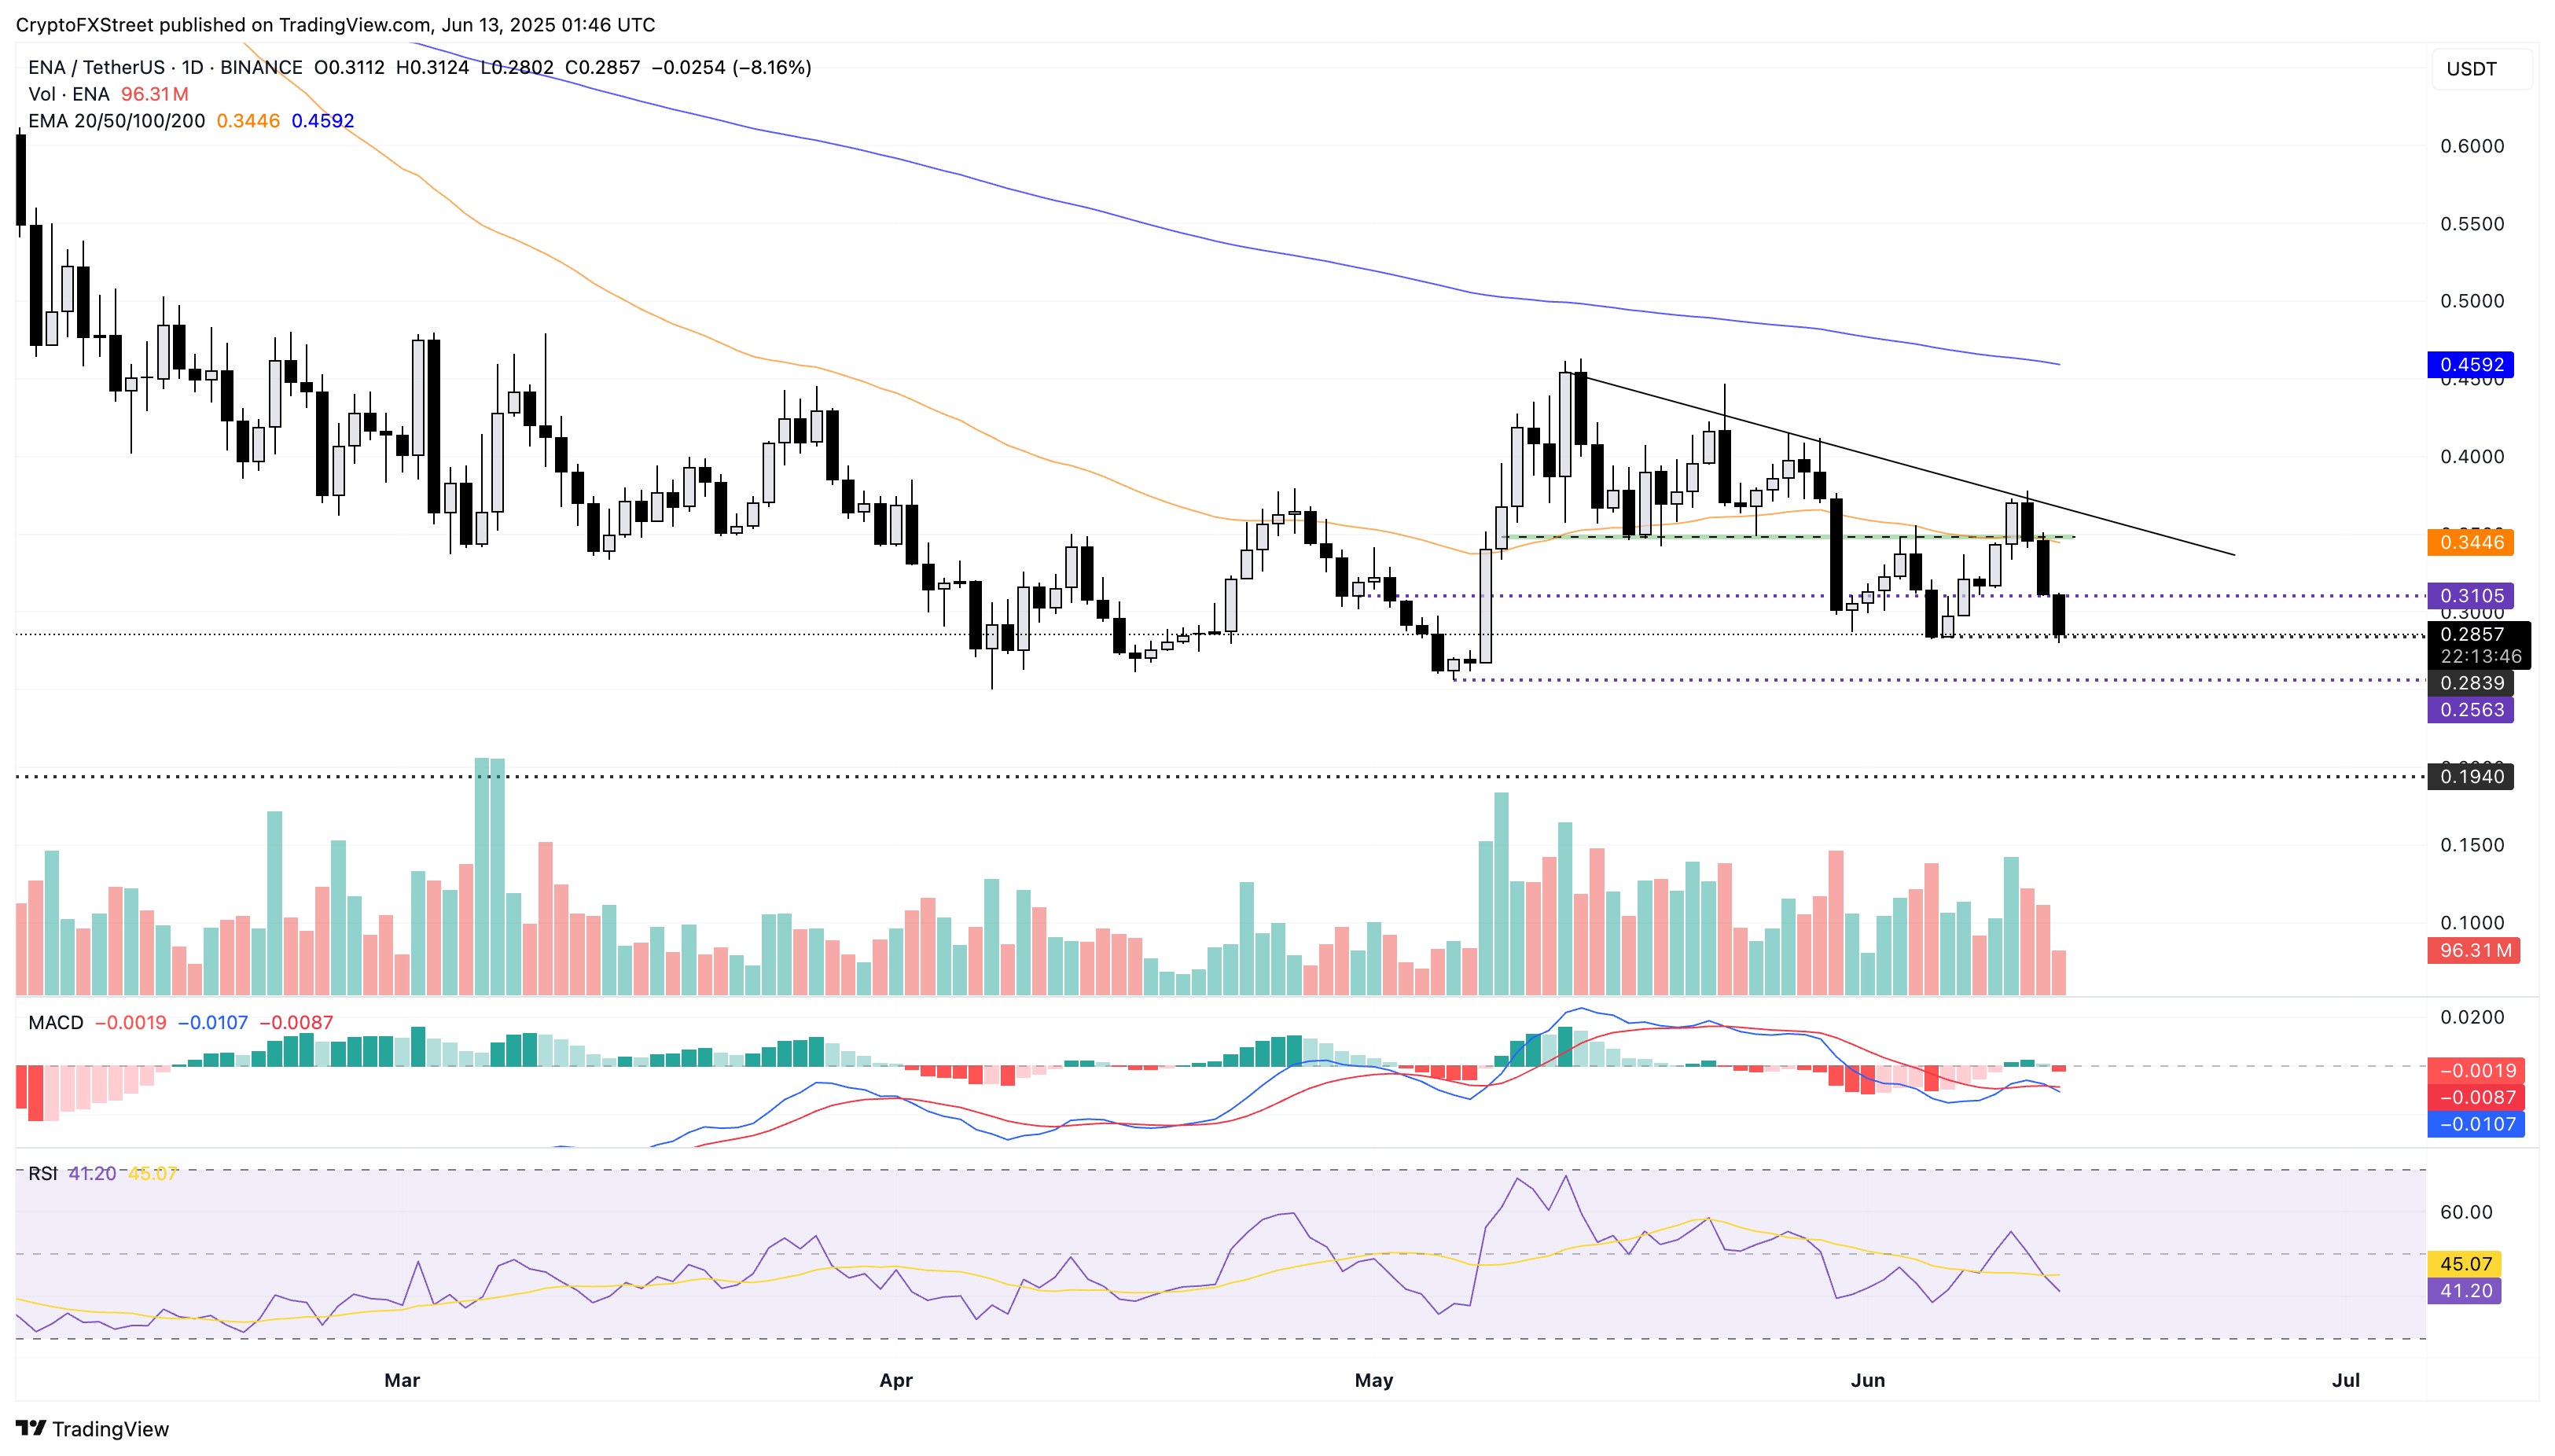
ENA/USDT daily price chart.
A reversal above $0.30 could pause the steep correction, potentially leading to a sideways trend.
LDO nosedives after failed $1 breakout
LDO fails to close above the $1 psychological resistance level despite the breakout of a long-awaited resistance trendline in the daily chart. Closing below the 50-day EMA, the altcoin retests the broken trendline.
The MACD indicator drops towards its signal line for a bearish crossover as the bullish histograms decline. The RSI indicator drops under the halfway level at 44, projecting a sudden decline in bullish momentum.
If the downtrend extends, it could test the $0.74 support level marked by a low on May 6.
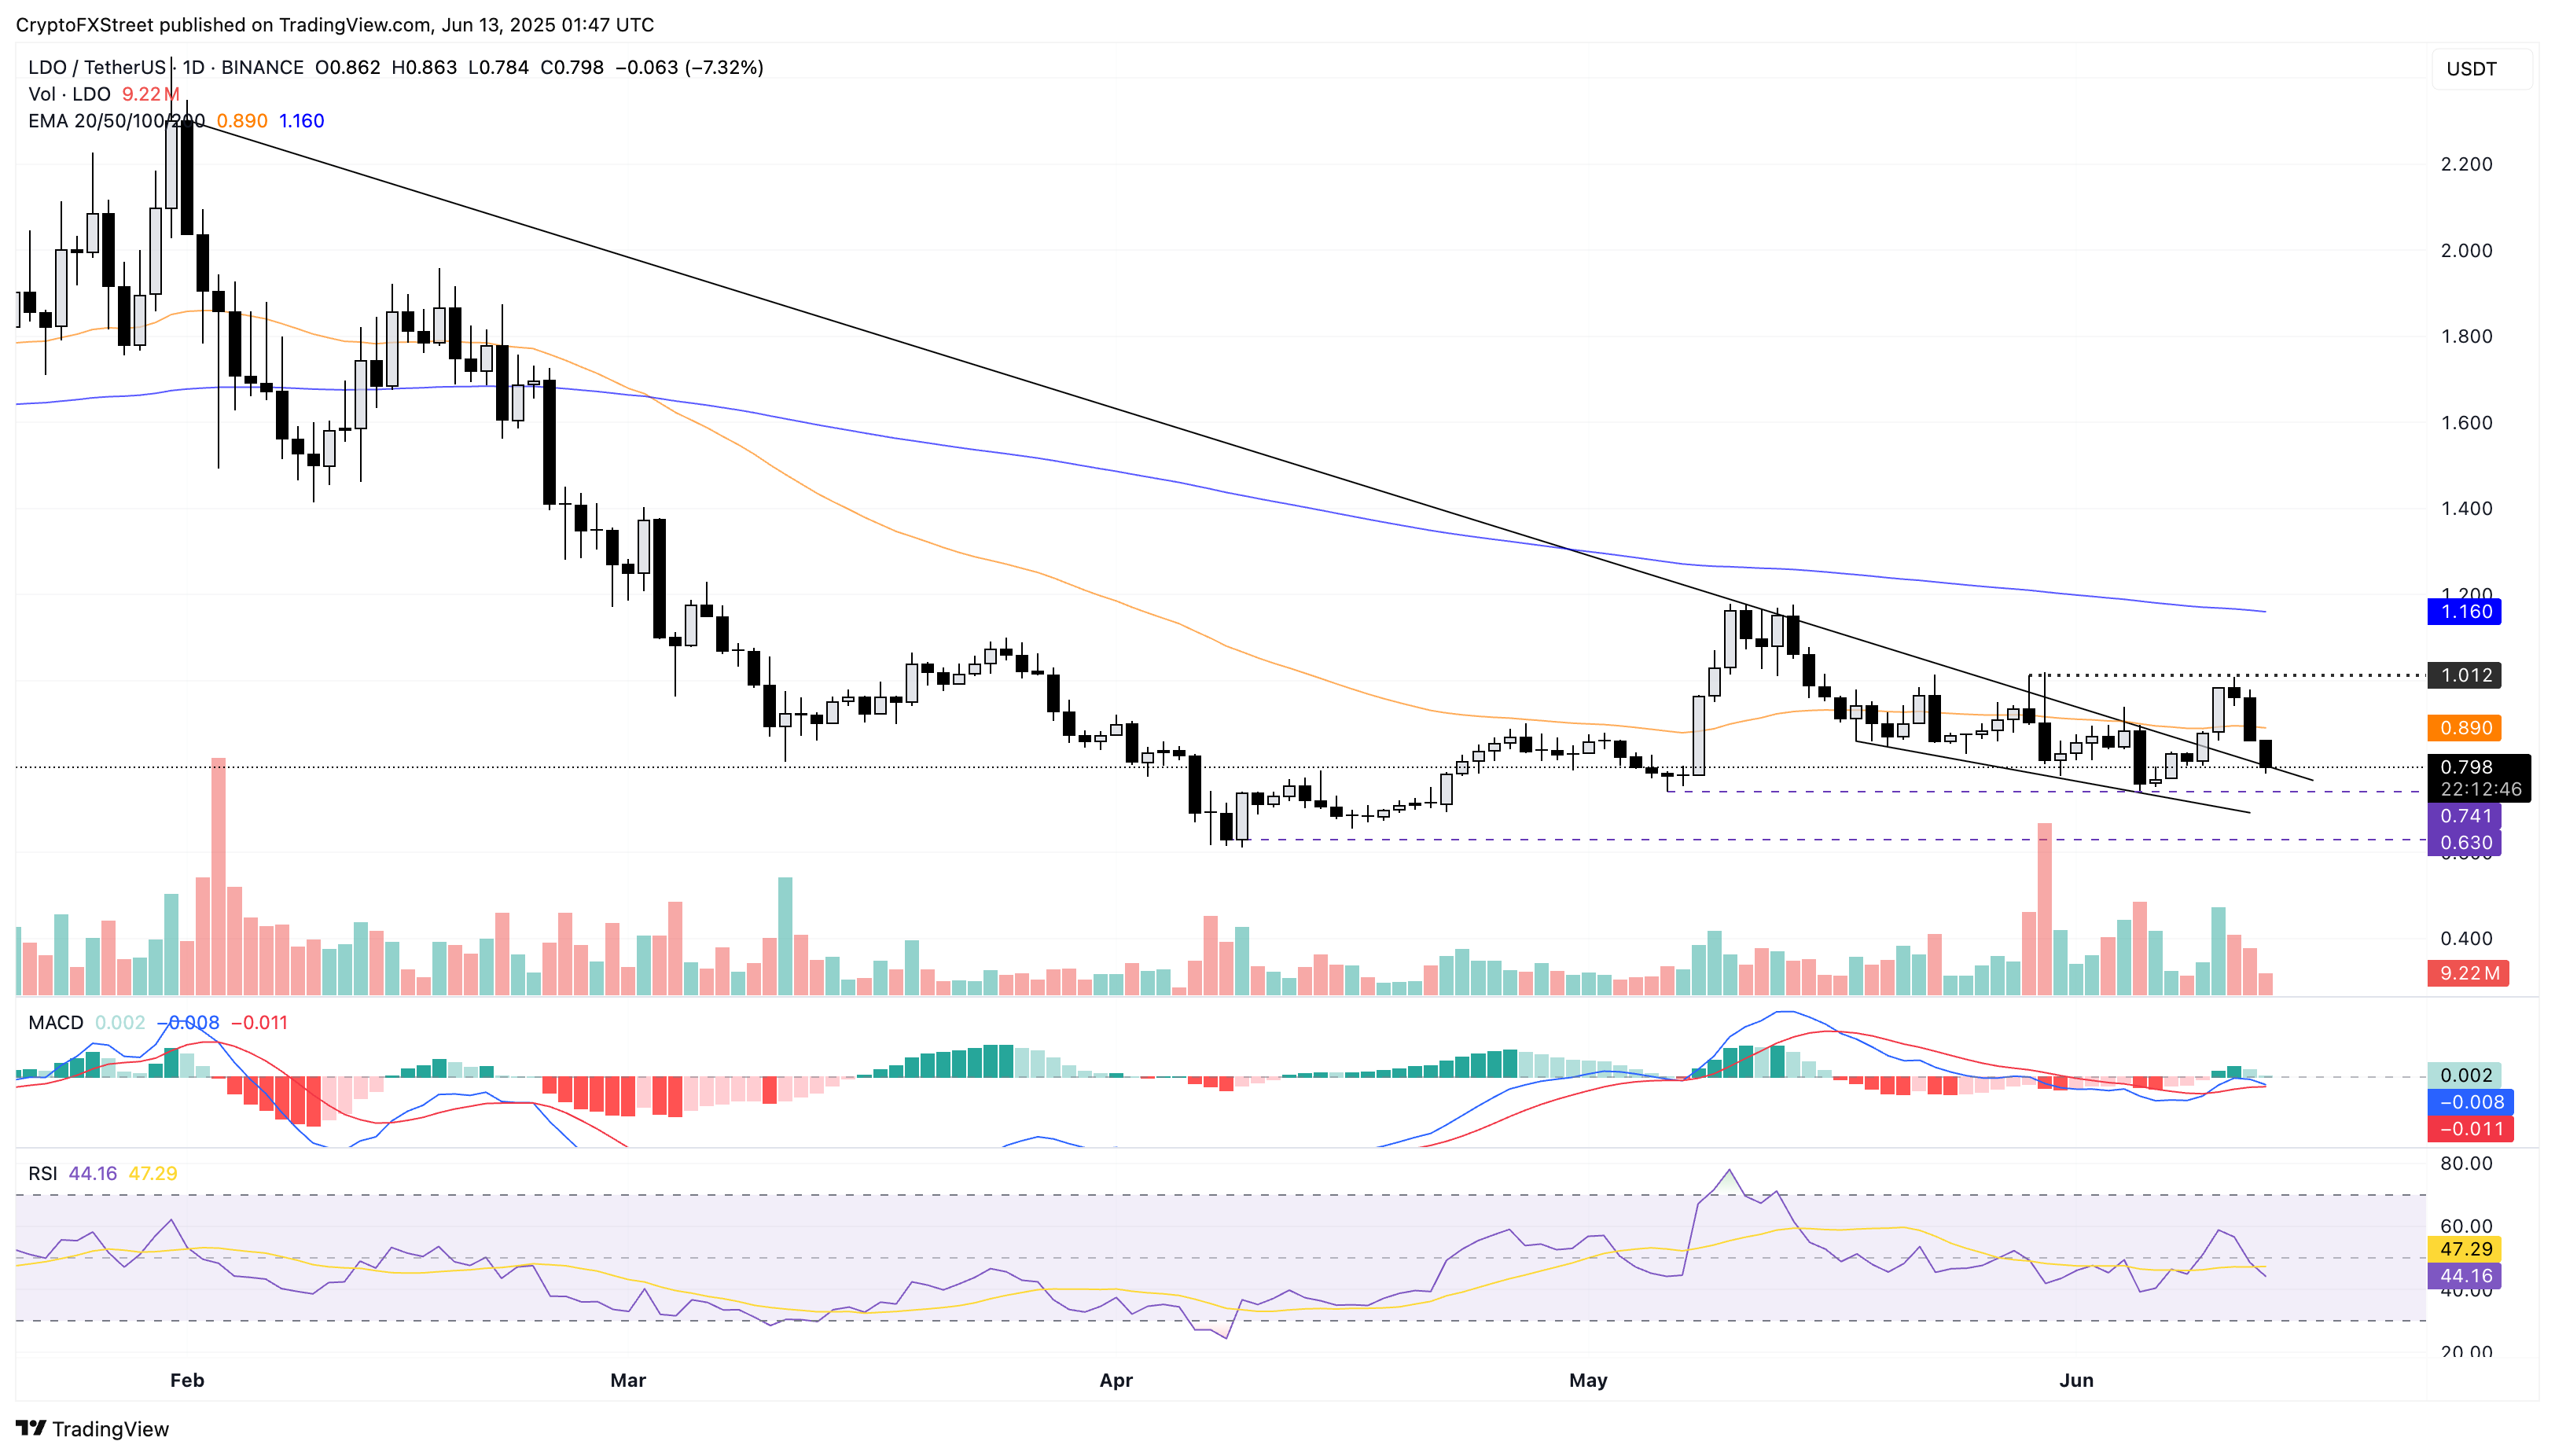
LDO/USDT daily price chart.
However, a reversal above could trend towards the $1 psychological level.

Log in to Reply
Log in to comment your thoughtsComments
Related Articles
|Square
Get the BTCC app to start your crypto journey
Get started today Scan to join our 100M+ users