Stellar (XLM) Nears Breakout as Total Value Locked Soars Past $97M

Stellar''s ecosystem flexes its muscles—TVL just smashed records with a $97 million milestone. Is this the fuel for XLM''s next leg up?
Forget ''slow and steady''—Stellar''s DeFi scene is sprinting while traditional finance still struggles with spreadsheets. The network''s locked value hitting an all-time high signals more than just growth; it''s a middle finger to legacy systems.
Price charts coil tighter than a spring. When—not if—this breaks, the move could be violent. Just don''t expect Wall Street analysts to notice until CNBC runs a graphic.
Stellar’s on-chain metrics back a bullish bias
Data from crypto intelligence tracker DefiLlama shows that XLM’s TVL increase reached a new all-time high (ATH) of $97.7 million on Wednesday. This increase in TVL indicates growing activity and interest within Stellar’s ecosystem, suggesting that more users are depositing or utilizing assets within XLM-based protocols.
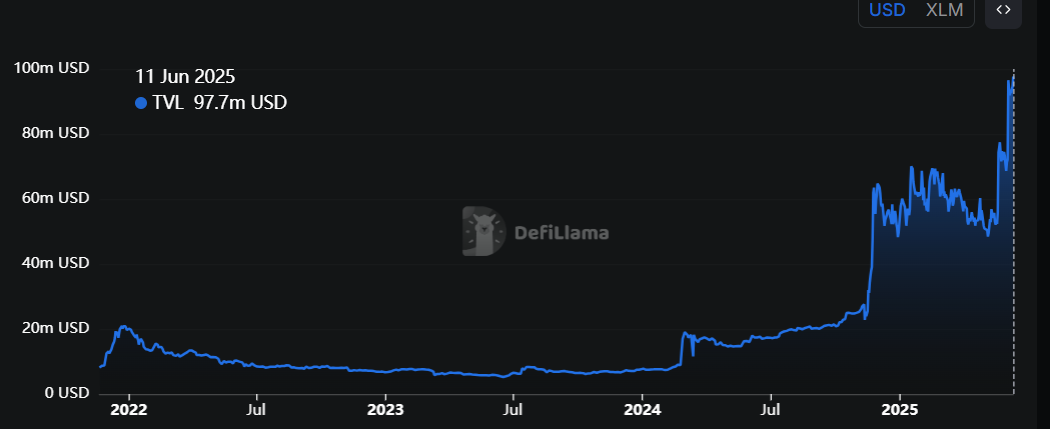
XLM TVL chart. Source: DefiLlama
Additionally, its stablecoin market capitalization has risen sharply since the end of May and currently stands at $650.53 million as of Wednesday after reaching a record high of $681.20 million on Monday. Such stablecoin activity and value increase on the XLM project indicate a bullish outlook, as they boost network usage and can attract more users to the ecosystem.
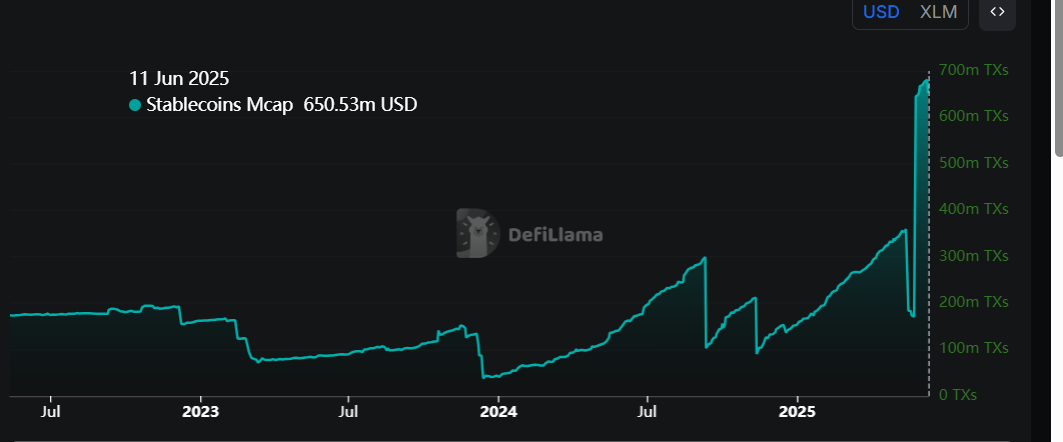
XLM stablecoins Mcap chart. Source: DefiLlama
According to Coinglass’s OI-Weighted Funding Rate data, the number of traders betting that the price of stellar will slide further is lower than that anticipating a price increase.
For XLM, this metric has flipped to a positive rate, reading 0.0087% on Wednesday, indicating that longs are paying shorts. This scenario typically indicates bullish sentiment in the market, suggesting a potential price rally for Stellar.
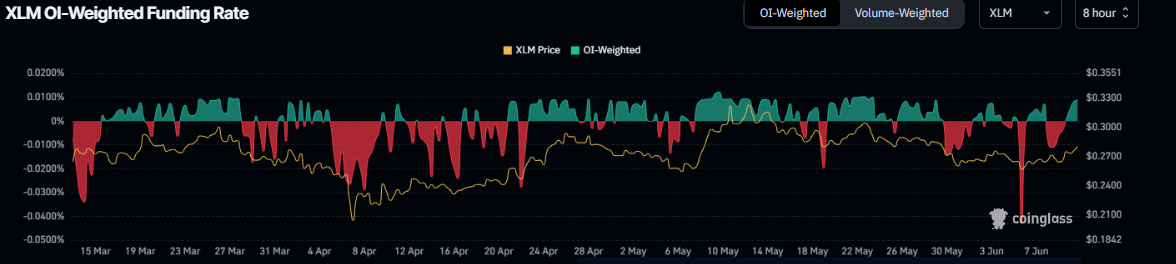
XLM OI-Weighted Funding Rate chart. Source: Coinglass
Stellar Price Forecast: XLM bulls on the verge of a bullish breakout
Stellar price retested and found support around its daily level at $0.255 on Friday and recovered 6.6% till Tuesday. At the time of writing on Wednesday, it is nearing its descending trendline (drawn by connecting multiple highs since the end of November).
If XLM breaks above the descending trendline and closes above the 100-day Exponential Moving Average (EMA) at $0.283, it could extend the rally to retest its daily resistance level at $0.356.
The Relative Strength Index (RSI) on the daily chart reads 53, above its neutral level of 50 and points upwards, indicating that bullish momentum is gaining traction. The Moving Average Convergence Divergence (MACD) indicator on the daily chart also displayed a bullish crossover on Tuesday, providing a buy signal and indicating an upward trend.
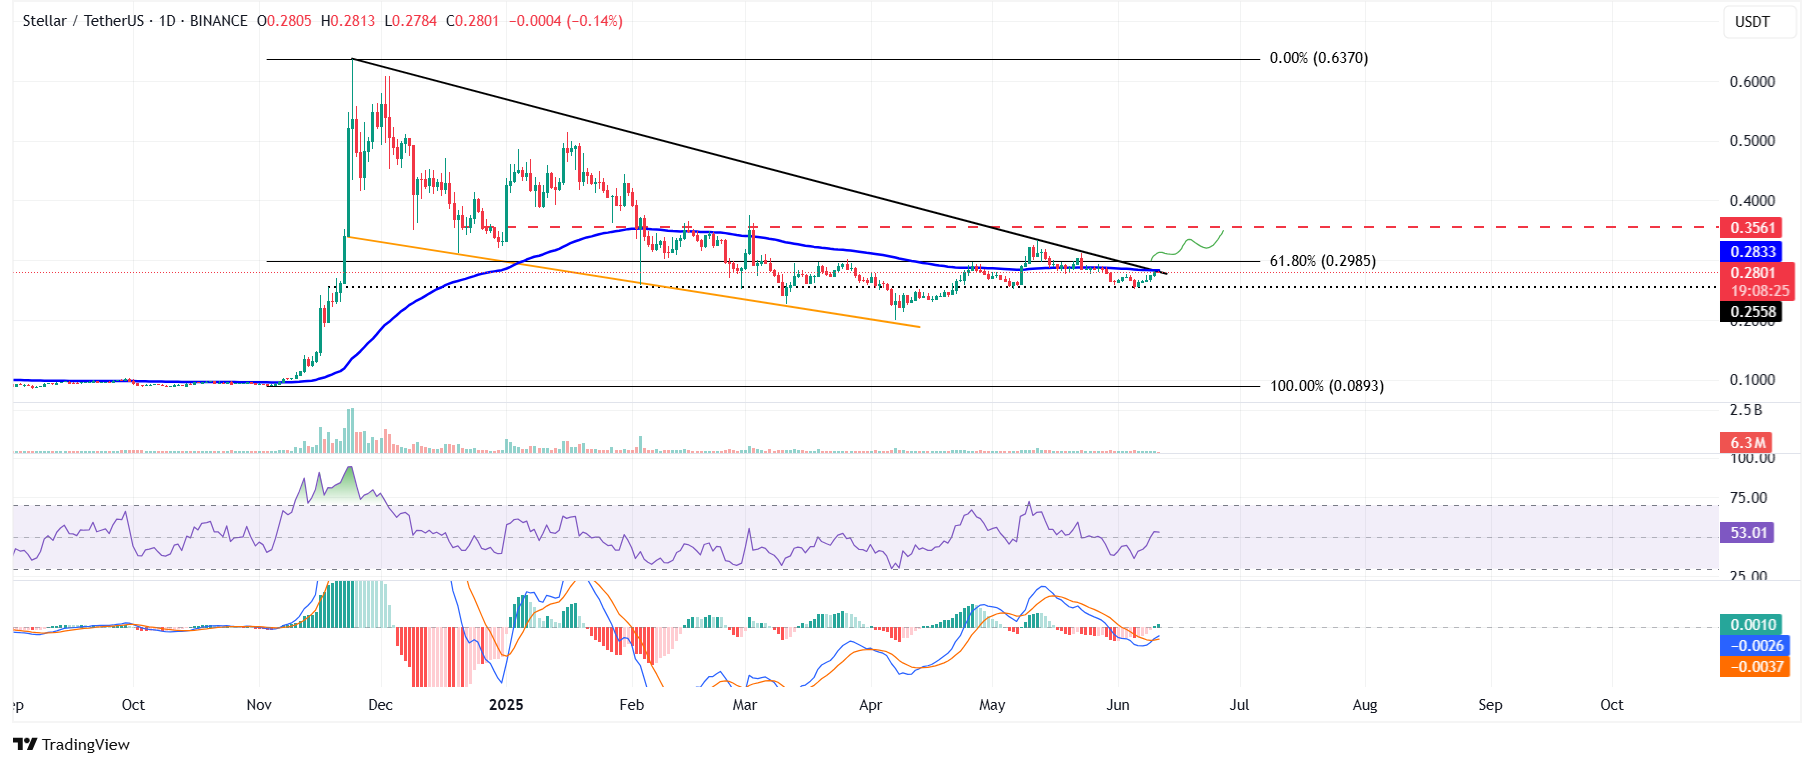
XLM/USDT daily chart
However, if XLM faces a correction, it could extend the decline to retest its daily support at $0.255.

Log in to Reply
Log in to comment your thoughtsComments
Related Articles
|Square
Get the BTCC app to start your crypto journey
Get started today Scan to join our 100M+ users