DeFi Tokens UNI, XDC, JTO Rally as Regulator Backs Self-Custody—Wall Street Grumbles

DeFi''s heavy hitters are flexing again—Uniswap''s UNI, XDC Network, and Jito''s JTO lead the charge as former SEC commissioner Paul Atkins throws weight behind self-custody. TradFi dinosaurs already drafting complaint letters.
Atkins'' endorsement cuts through regulatory fog, sparking fresh capital inflows. XDC''s enterprise blockchain pivot pays off while JTO rides Solana''s resurgence. Meanwhile, UNI whales accumulate ahead of v4 rumors.
Self-custody wins, bankers lose. The revolution will be decentralized—unless the suits finally figure out how to short it.
Uniswap shatters above $8
Uniswap edges lower by over 4% at press time on Wednesday after a spectacular performance of a 26% surge to close a bullish engulfing candle the day before. With a brief pause at $8.67, a three-month high, UNI reverses from the $8.70 supply ceiling to take a breather.
The technical indicators reveal a bullish bias as the Moving Average Convergence/Divergence (MACD) indicator flashes a positive crossover, and the Relative Strength Index (RSI) at 67 hovers NEAR the overbought boundary, signaling a growth trend momentum.
The rising 50-day and 200-day Exponential Moving Averages (EMAs) are projecting an increased likelihood of a bullish crossover.
With the intraday pullback, Uniswap could test the 200-day EMA at $7.67, close to the $7.69 support zone. A post-retest reversal fueled by the growing risk-on sentiment in the segment could rechallenge the $8.70 ceiling.
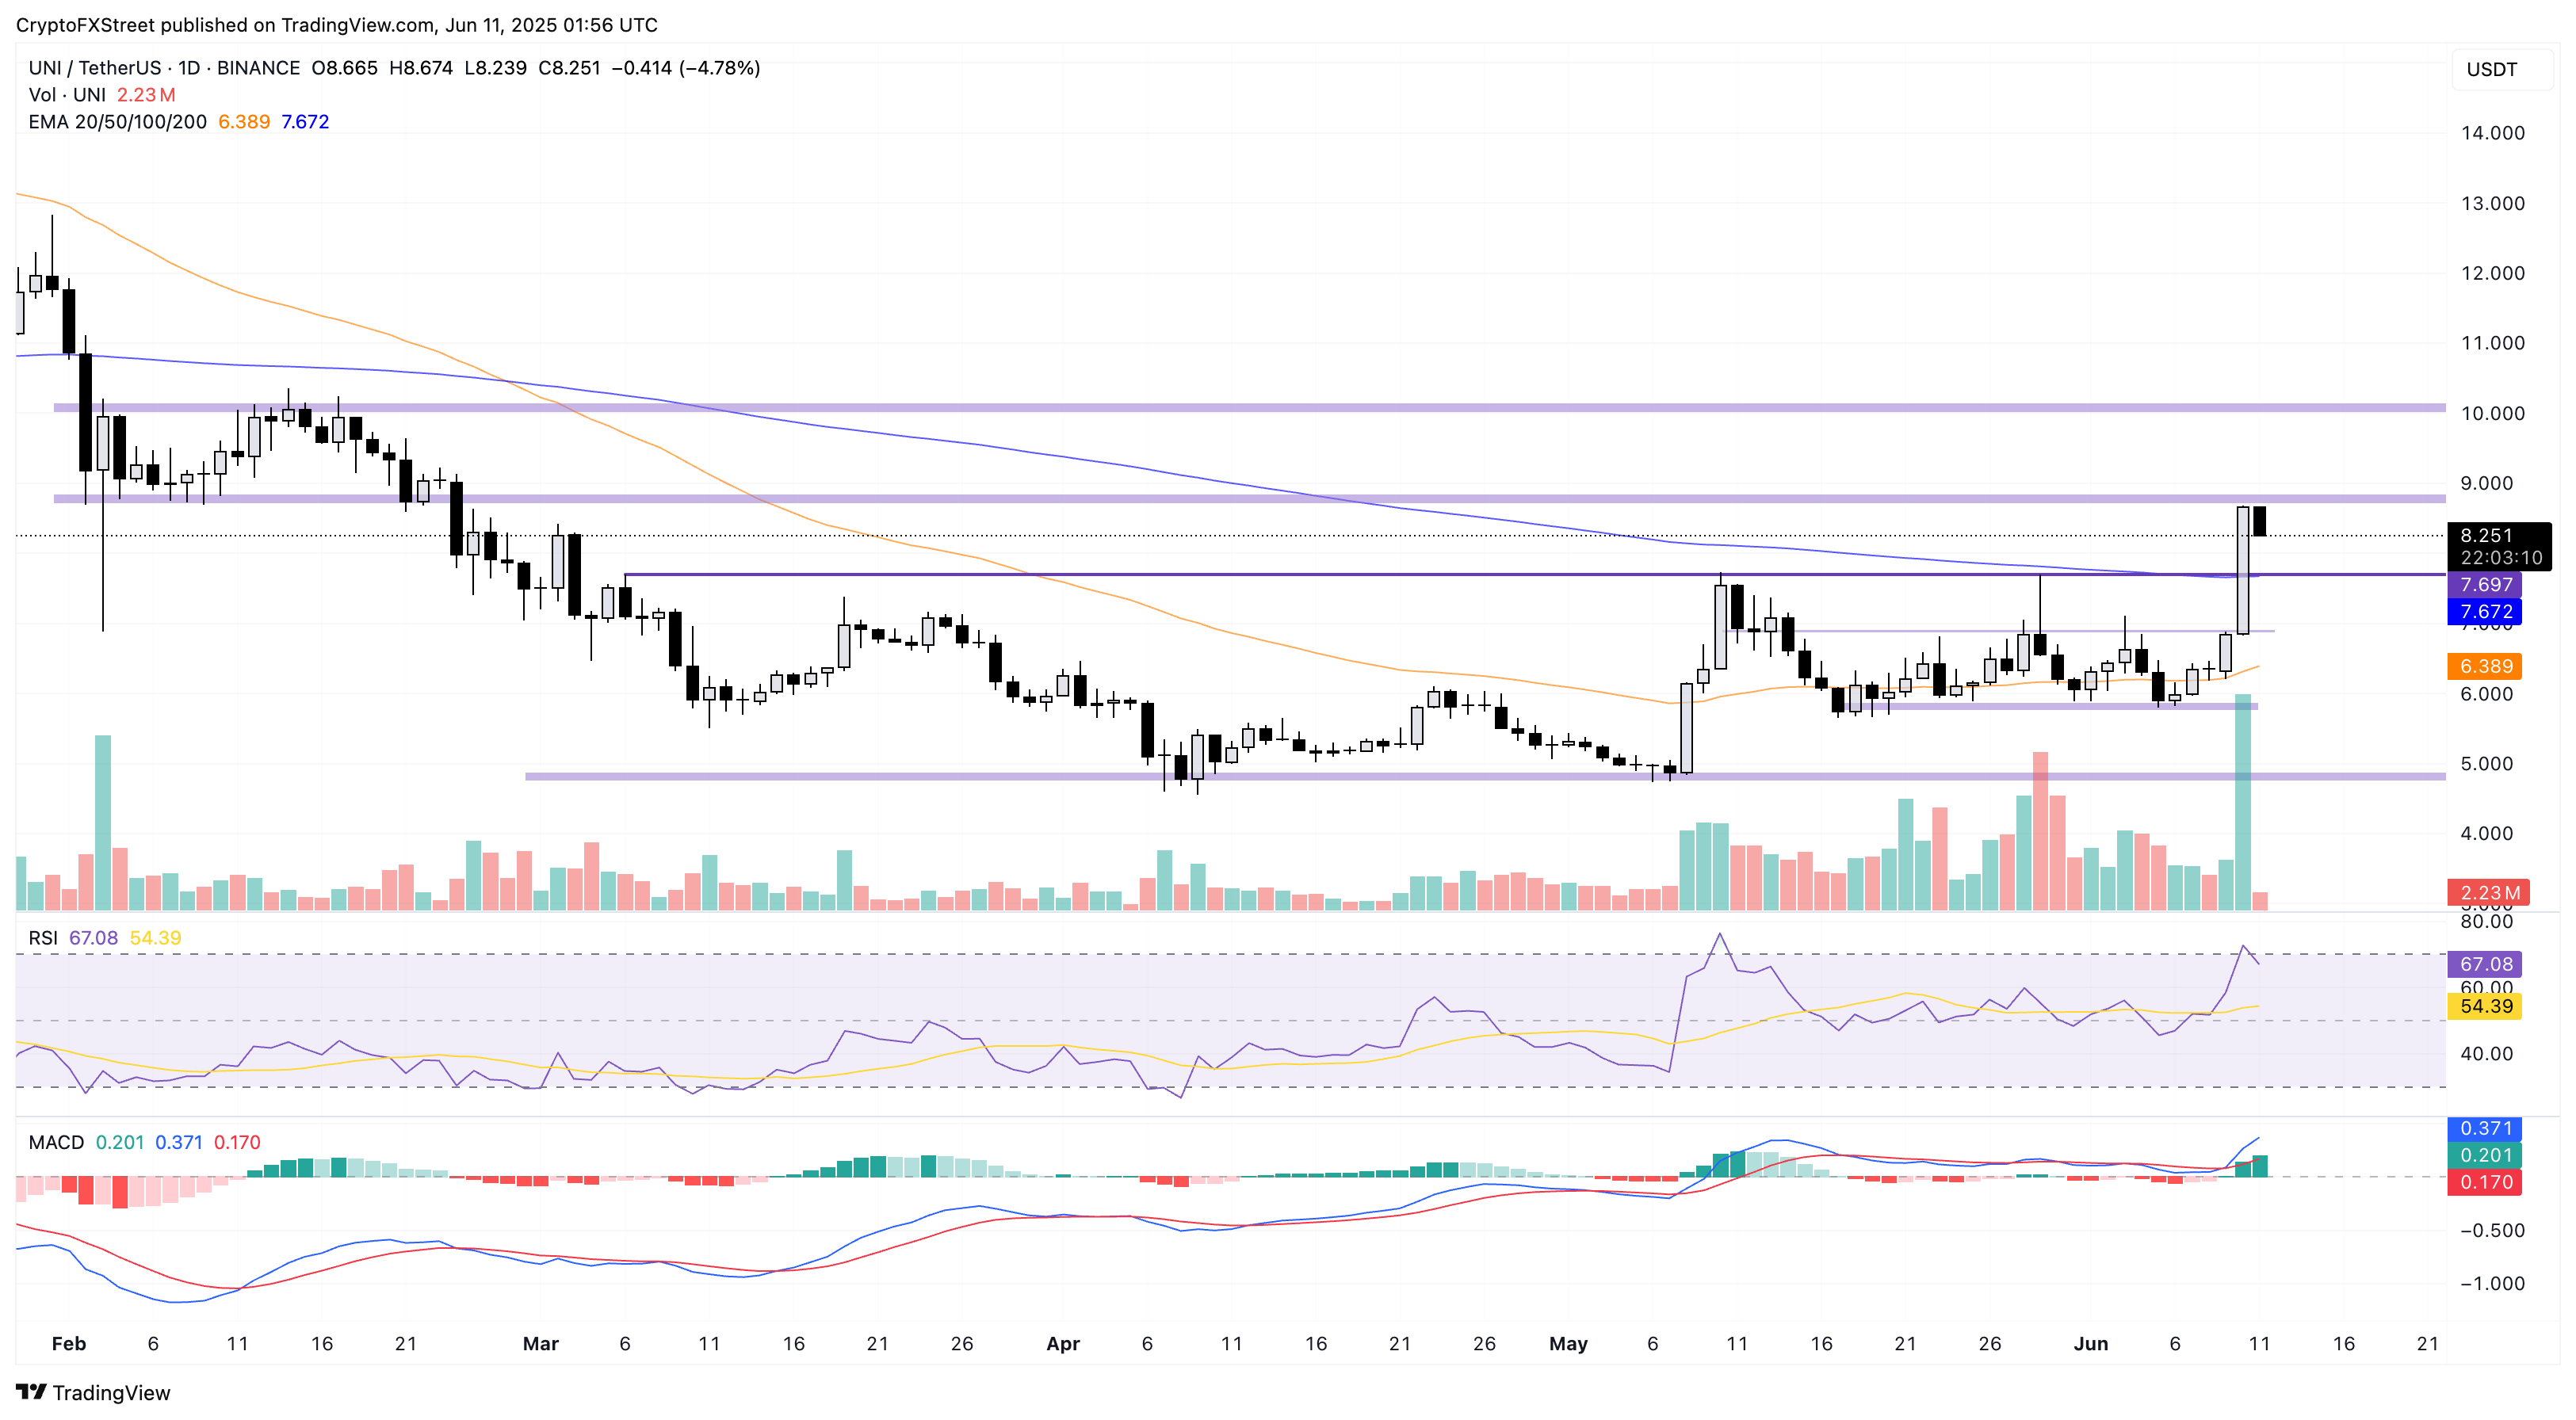
UNI/USDT daily price chart. Source: Tradingview
Conversely, a closing below $7.67 could trigger a decline to the $6.90 zone, a resistance-turned-support level last tested on June 3.
XDC nears multi-month resistance trendline breakout
XDC extends the 9% gains recorded on Tuesday by over 1% at the time of writing. The DeFi token has increased in value by over 16% as it trades at $0.06775, up from the 7-day low at $0.05801.
The recovery rally edges above a key long-standing resistance trendline formed by peaks on January 17, April 29, and May 23, signaling strong breakout chances. A closing above the trendline could propel XDC towards the May 23 peak at $0.07954.
The MACD indicator triggers a buy signal as the blue line crosses above the red signal line. Further up, the RSI indicator, at 56 points, signals increased bullish momentum and room for growth before reaching the overbought zone.
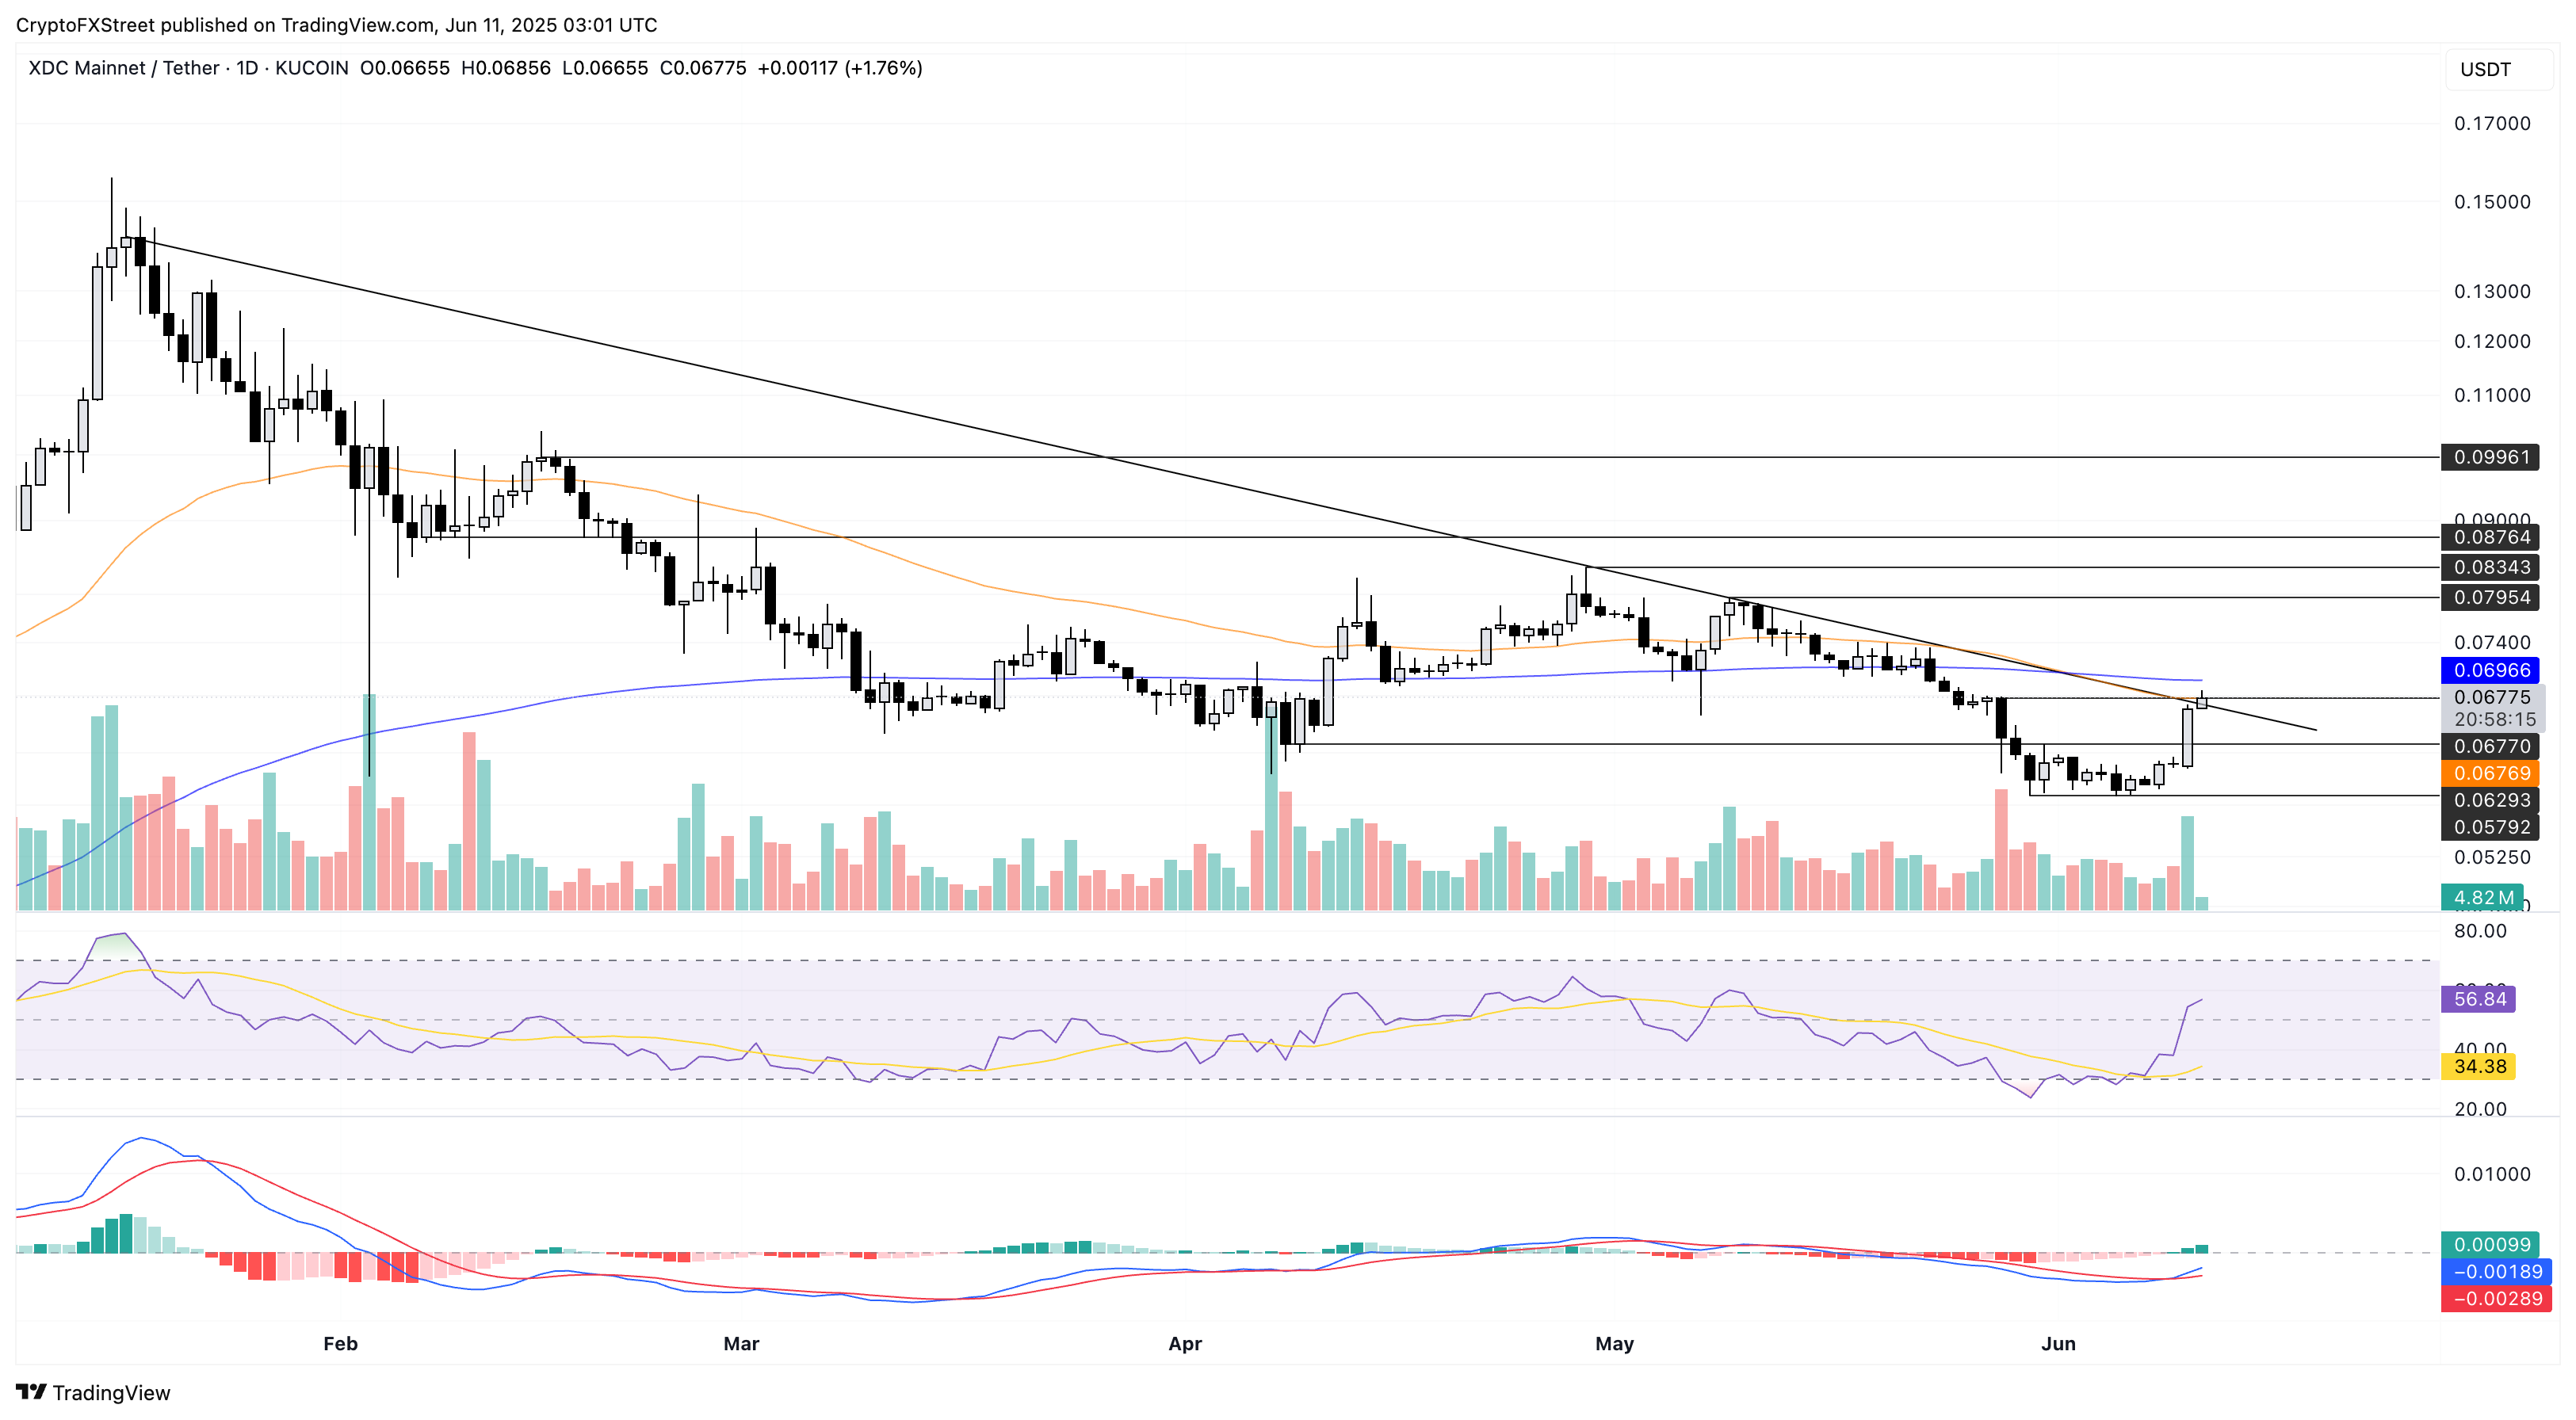
XDC/USDT daily price chart. Source: Tradingview
However, if XDC fails to close above the trendline, a reversal could result in a pullback to the $0.06770 support, formed by a low on April 8.
Bullish momentum fades in JTO
Jito, a Solana-based DeFi token, surged 14% on Tuesday, printing its fifth consecutive bullish candle on the daily chart. However, JTO fails to cross above the 200-day EMA at $2.25, resulting in a pullback of over 4% at press time on Wednesday.
The reversal retests the broken $2.11 resistance-turned-support level, last tested on May 22. Sidelined investors looking for buying opportunities could find a daily closing above the 200-day EMA as a potential entry point.
A clean push could prolong the recovery rally to $2.42, last tested on March 25.
The technical indicators of JTO share the bullish bias with other DeFi tokens. The MACD indicator displays the blue and red lines crossing above the zero line alongside the green histograms rising from the same line.
The Relative Strength Index (RSI) at 60 spikes above the halfway line shows space for an upside MOVE before reaching the overbought zone.
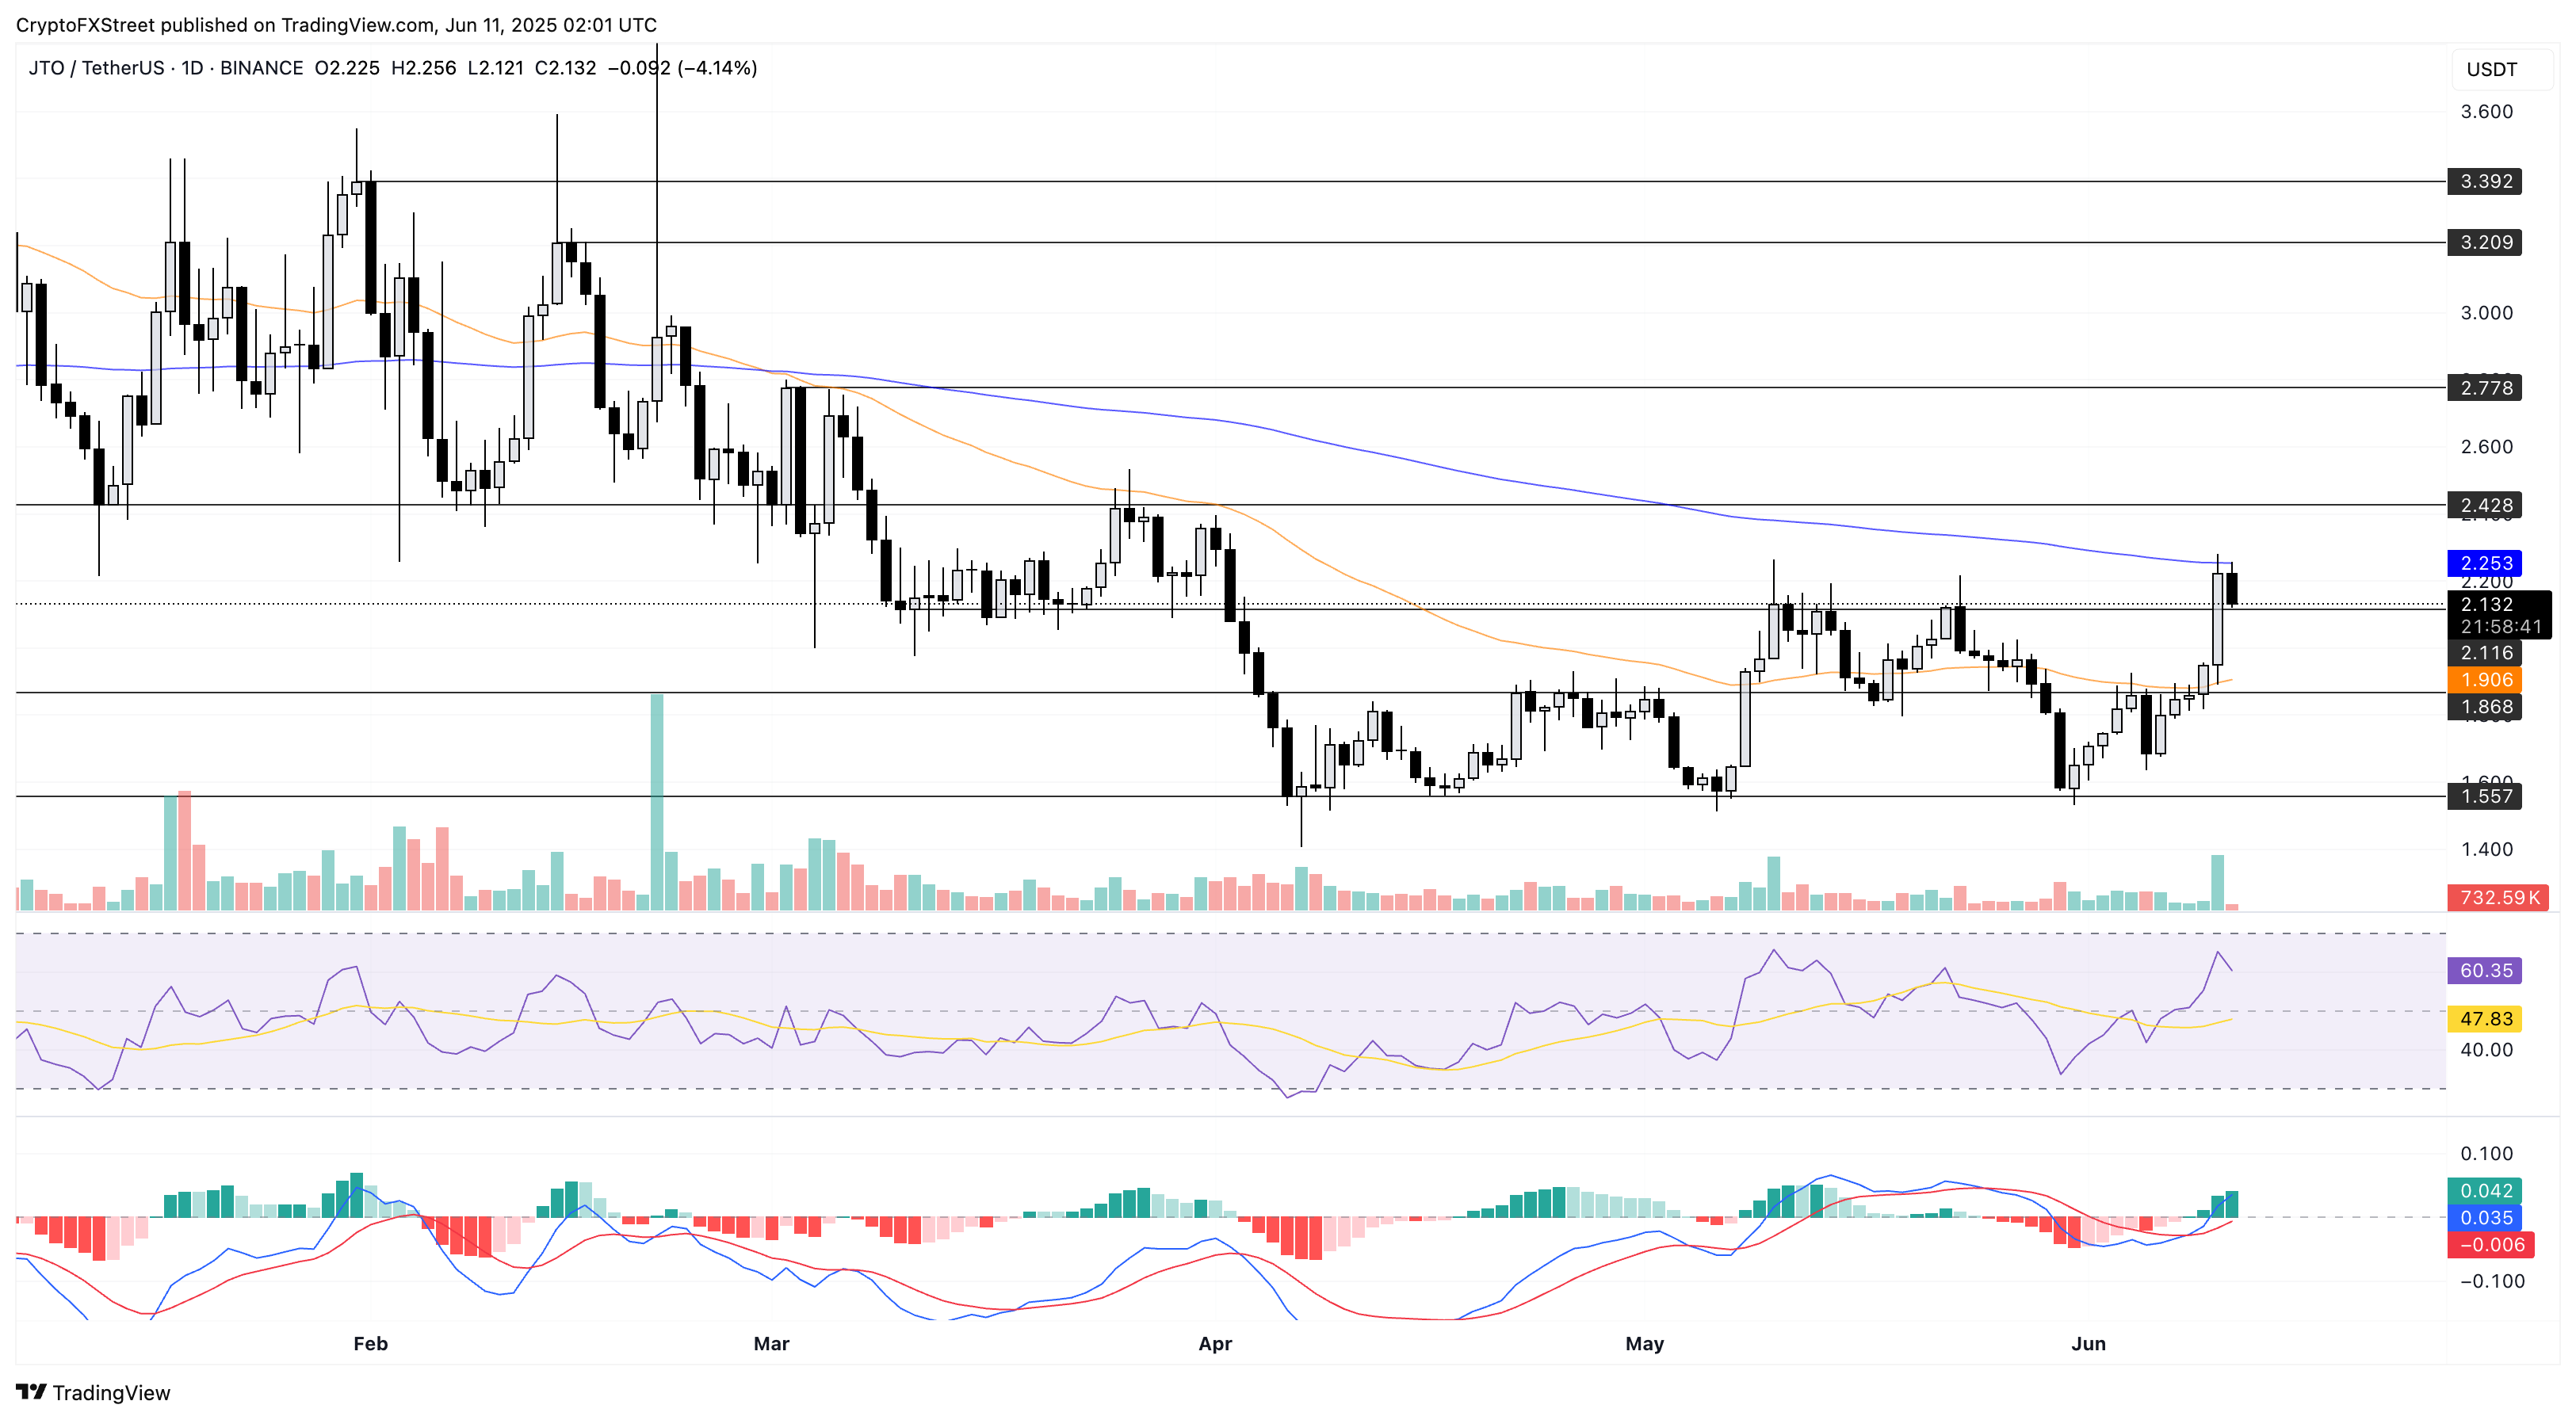
JTO/USDT daily price chart. Source: Tradingview
Conversely, a closing below $2.11 could extend the declining trend towards the 50-day EMA at $1.90.
