Chainlink Stages Comeback as Traders Bet Big on Real-World Adoption

Oracle network shrugs off crypto winter blues with utility-driven rally.
LINK bulls are back—and this time, they're waving enterprise adoption contracts like confirmation slips.
Price rebound coincides with whispers of institutional players quietly loading bags. Because nothing screams 'serious investment' like hedge funds chasing the same pumps as your Discord degenerate cousin.
Chainlink’s growing role as a trusted oracle network in financial infrastructure
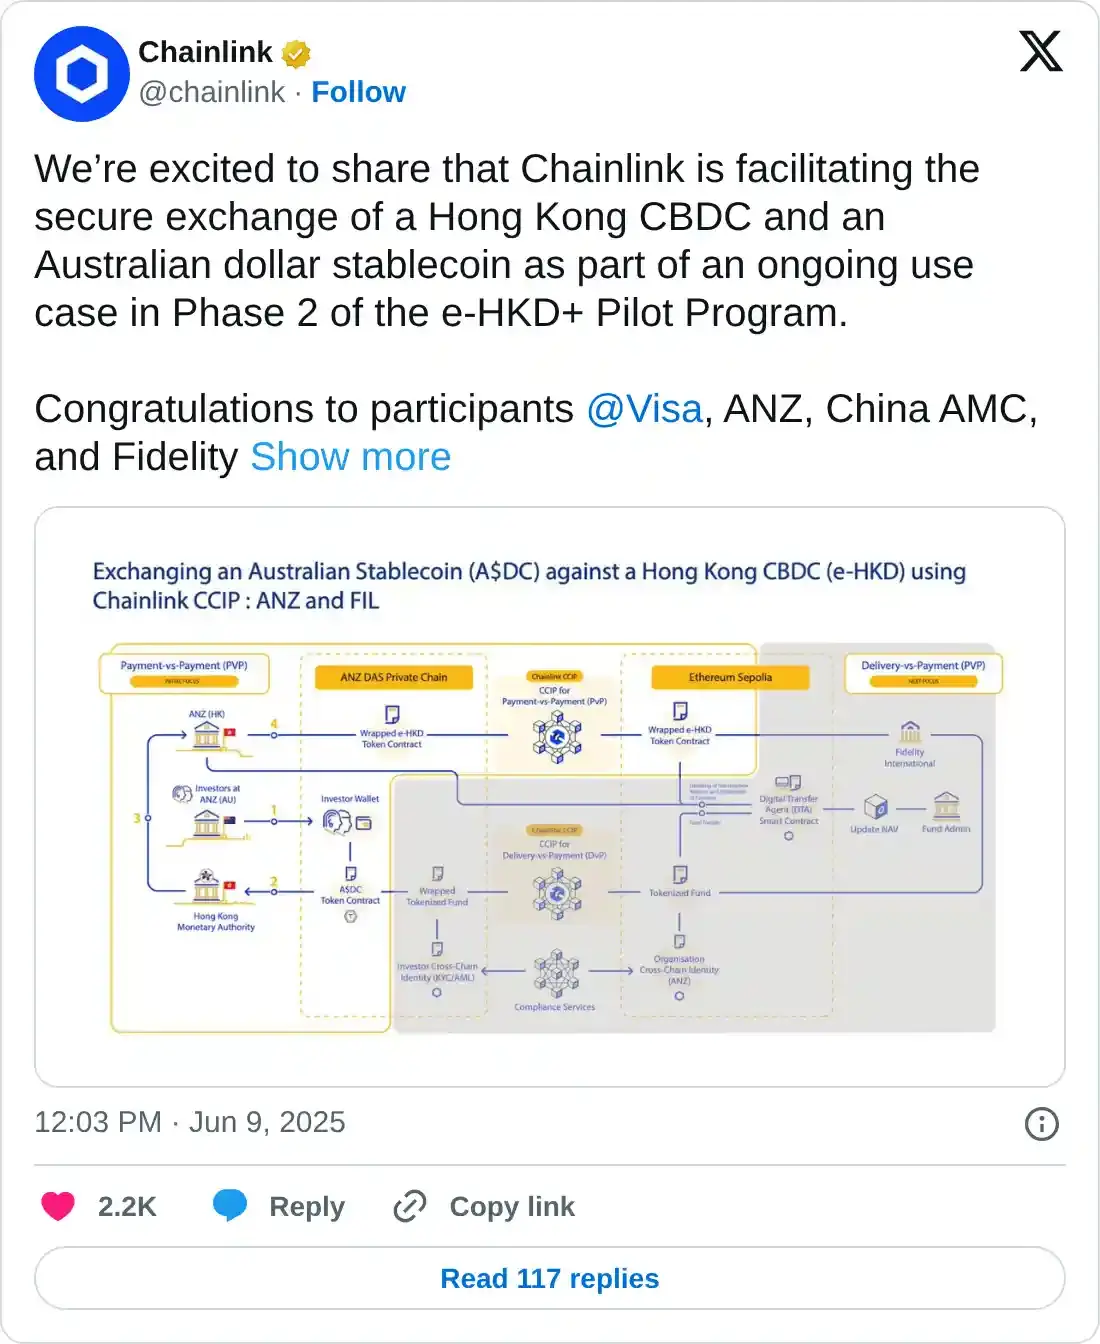
Chainlink announced on Monday that it has successfully enabled CBDC and stablecoin swaps between Hong Kong and Australia, involving major players such as Visa, Fidelity, and China AMC. The cross-border exchange involved the Hong Kong CBDC (e-HKD) against an Australian dollar stablecoin (A$DC), utilizing Chainlink’s Cross-Chain Interoperability Protocol (CCIP).
This growing development highlights LINK’s role as a trusted oracle network in critical financial infrastructure, marking a significant step in blockchain-based cross-border payments. This news drove Chainlink’s price up 4.59% on Monday, closing above $14.36.
Another bullish sign is Coinglass’s LINK long-to-short ratio, which reads 1.25, the highest level in over a month. This ratio, above one, reflects bullish sentiment in the markets, as more traders are betting on the asset price to rise.
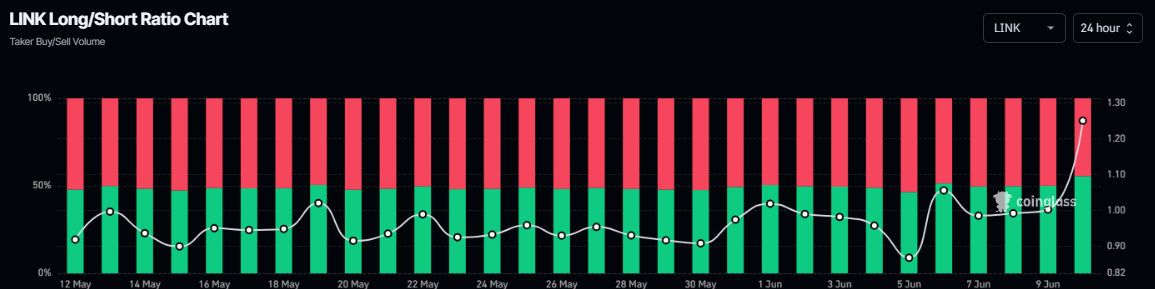
LINK long-to-short ratio chart. Source: Coinglass
Chainlink Price Forecast: LINK bulls aim for higher leg
Chainlink price found support around its daily level of $12.59 on Saturday and rebounded by 11.40% as of Monday. At the time of writing on Tuesday, it continues to trade higher at around $14.55.
If LINK continues its upward trend, it could extend the rally to retest its May 29 high of $16.19. A successful close above this level could extend additional gains toward its weekly resistance at $18.81.
The Relative Strength Index (RSI) on the daily chart reads 49 and points upward toward its neutral level of 50, indicating fading bearish momentum. If the RSI moves above its neutral level and continues its upward trend, it WOULD indicate strength in bullish momentum. The Moving Average Convergence Divergence (MACD) indicator is about to flip a bullish crossover on the daily chart. If the MACD generates a bullish crossover, it will provide a buying signal and indicate an upward trend.
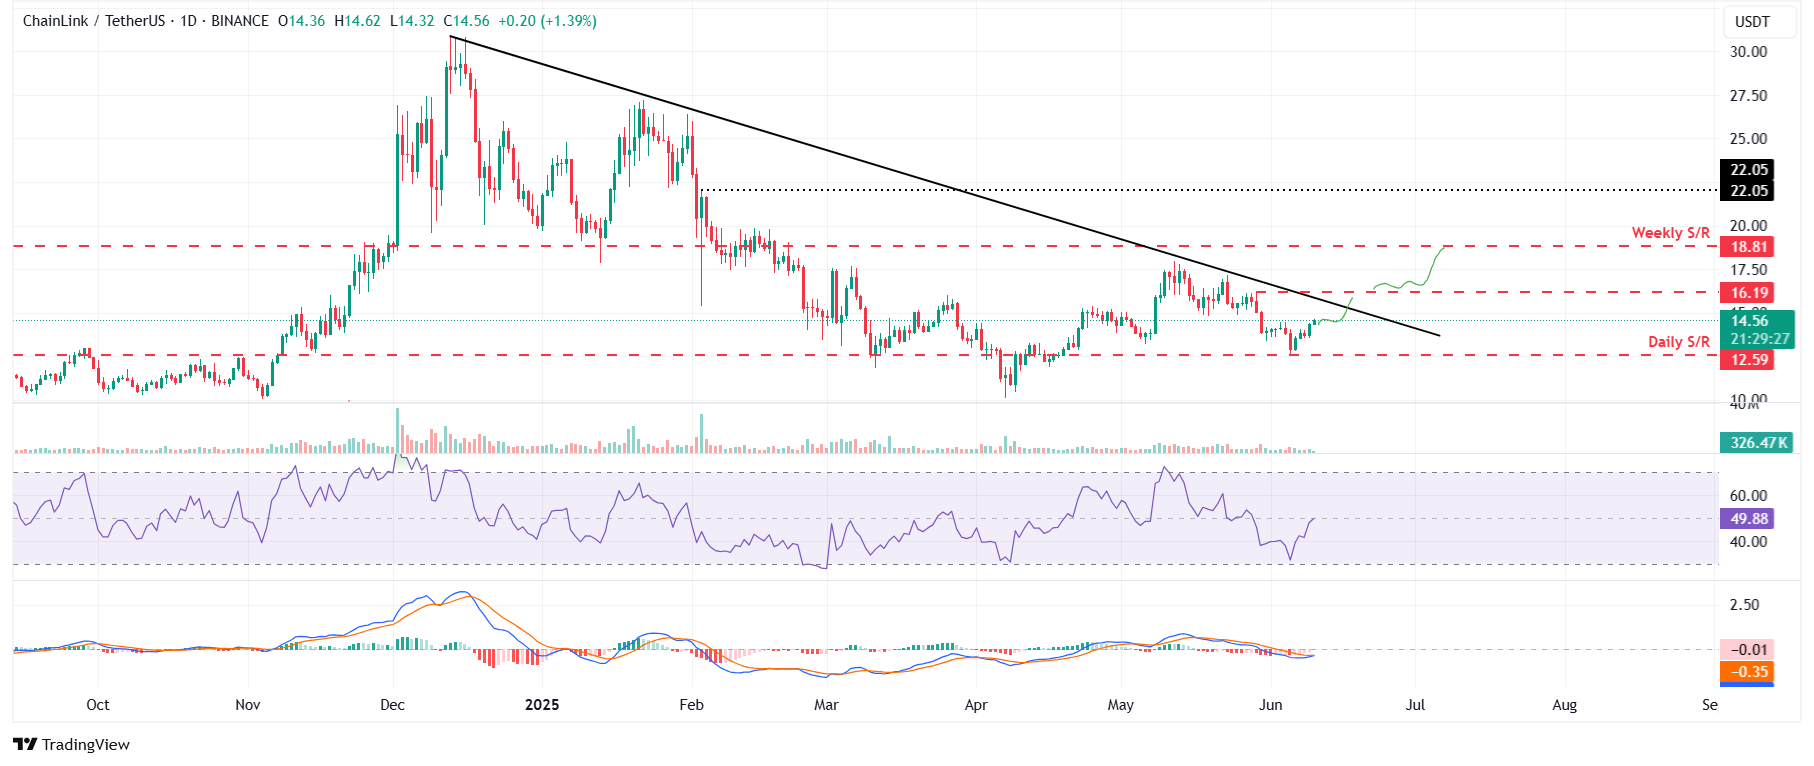
LINK/USDT daily chart
However, if LINK faces a correction, it could extend the decline to retest its daily support at $12.59.
