Altcoins Steal the Spotlight: Binance Alpha Coins Rally as ICP Eyes a Comeback

Move over, Bitcoin—altcoins are driving today's crypto narrative. SPX, ICP, and AB lead the charge with double-digit surges, fueled by Binance's Alpha program momentum.
Internet Computer (ICP) stages a bullish reversal attempt after months of sideways action. Can it break the curse of 'post-hype' tokens? Traders seem optimistic—or just desperate for the next narrative flip.
Meanwhile, Wall Street analysts still can't decide if crypto is 'digital gold' or a high-risk casino. Some things never change.
SPX6900 upholds the uptrend
The meme coin SPX soared 7.95% on Sunday following the 8% hike on Saturday to complete a bullish weekend. At the time of writing, SPX trades at $1.25 with minimal intraday movement after a 22% rally last week.
The meme coin faces opposition at the 78.6% Fibonacci level at $1.28, retraced between January’s highest closing at $1.55 and March’s lowest closing at $0.29. Typically, investors with purchase costs below the 50% Fibonacci level target the 78.6% level as a profit-booking spot, increasing the downside risk.
Despite the uptrend in motion, the Relative Strength Index (RSI) at 70 hovers almost flat below the overbought boundary, reflecting a weakening in momentum. Traders must remain cautious as the near-flat RSI marks a bearish divergence with the uptrend, signalling a bearish reversal.
The crucial support for SPX remains the $1 psychological support, followed by $0.92, the 50% Fibonacci level.

SPX/USDT daily price chart. Source: TradingView
On the contrary, a daily closing above $1.28 could prolong SPX’s uptrend to January’s highest closing at $1.55.
ICP nears triangle breakout
ICP is up by nearly 6% at press time in the last 24 hours, with two consecutive bullish candles on the weekend accounting for a 12% hike. The reversal run challenges the upper boundary of a symmetrical triangle pattern, hinting at a potential breakout.
The converging trendlines formed by the peaks on February 21, March 4, and May 12, and the lows on April 7, May 6, and May 31, FORM a triangle pattern.
Traders should look for a daily close above the trendline or the peak on May 12 at $6.13 for a buy signal, with a potential price target at $7.22, the peak formed on March 4.
Supporting the upside chances, the Moving Average Convergence/Divergence (MACD) indicator triggers a buy signal as the blue line crosses above the red. Rising above the zero line with a fresh wave of green histograms above the same line signals a high likelihood of a potential breakout.

ICP/USDT daily price chart. Source: Tradingview
If ICP reverses from the overhead trendline, crucial support lies at $4.67, last tested on May 31.
AB crosses above the $0.010 resistance
AB, an altcoin part of the Binance Alpha, which is a pre-listing pool, has increased by over 5% in the last 24 hours at press time. Fueled by the trading competition announced by Binance on Saturday, the token surged 15% on Saturday, followed by an 11% extension on Sunday.
The uptrend has crossed above the $0.010 psychological threshold, reaching a 30-day high. The MACD and its signal lines cross above the zero line with a new wave of bullish histograms signaling rising uptrend momentum.
Traders should look out for the immediate resistance at $0.013, last tested on April 12. A potential breakout could prolong the uptrend to $0.015, last tested on March 28.
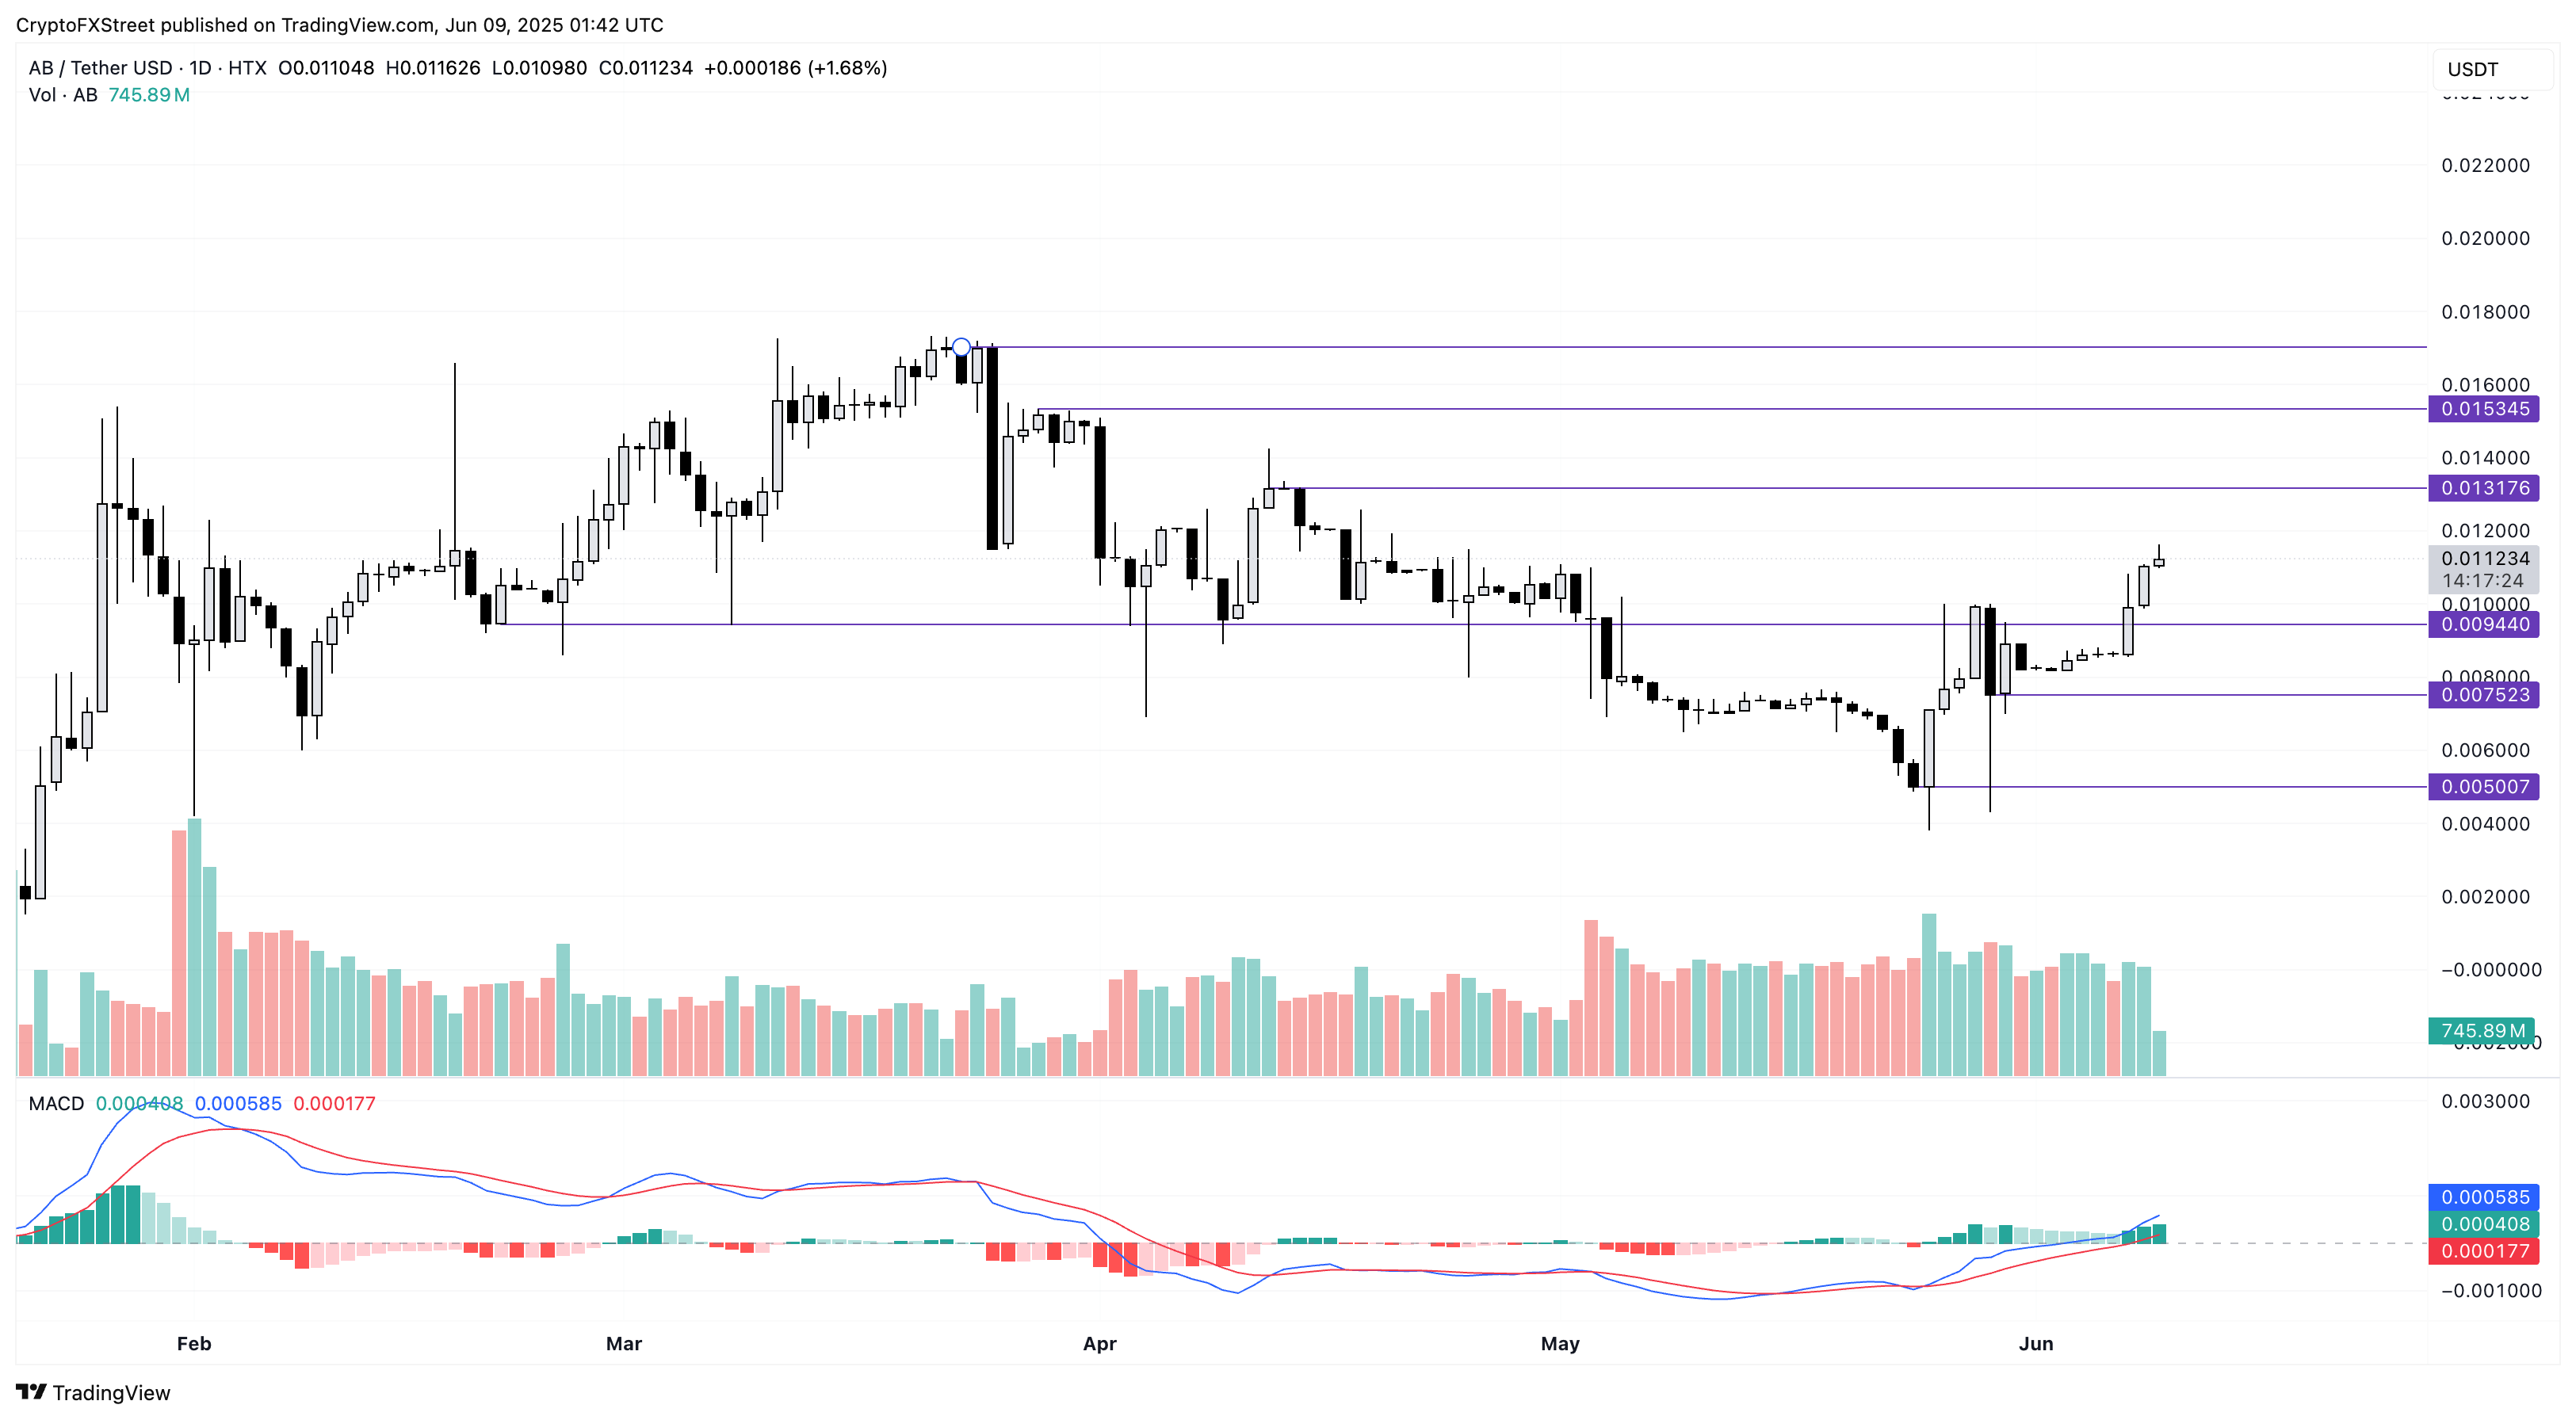
AB/USDT daily price chart. Source: Tradingview
Conversely, a flip in AB’s trend could test the $0.0094 support highlighted by the February 20 low, followed by the low on May 29 at $0.0075.
