Meme Coins Teeter on the Edge—Dogecoin, Shiba Inu, and Pepe Face Make-or-Break Support Levels

Hold onto your memes—Dogecoin, Shiba Inu, and Pepe are dancing on a knife's edge. Critical support levels loom, and a pullback could send traders scrambling.
These so-called 'joke assets' are no laughing matter for bagholders watching their portfolios. When the market sneezes, meme coins catch pneumonia—and right now, the charts are looking flu-ish.
Will the 'people's crypto' rally again, or is this another lesson in why Wall Street still won't take your Shiba Inu hoodie seriously? Only the charts know for sure—but the leverage longs are sweating.
Dogecoin risks a fall to $0.14
Dogecoin trades at $0.1886 at the time of writing on Thursday, recording an over 2% drop so far this week following the 13.90% fall last week. With a 2.58% drop the previous day, Doge marked the lowest closing price in just over three weeks.
The ongoing pullback broke under the crucial 50-day, 100-day, and 200-day Exponential Moving Averages (EMAs) on Friday and tests a critical support level at $0.1865, marked by the long-tail candles over the weekend.
A daily closing below $0.1865 could result in a steep correction to $0.1642, May’s lowest trading price. In case of an extended crash, the support floor at the lowest year-to-date closing price of $0.1422 could absorb the incoming supply.
The Moving Average Convergence/Divergence (MACD) indicator shows the average lines declining into the negative territory, concurrent with the rising red histogram bars. In addition, the Relative Strength Index (RSI) at 38 continues declining below the halfway level.
Thus, the momentum indicators reveal a gradual surge in bearish momentum and room for extended correction before reaching the oversold condition.
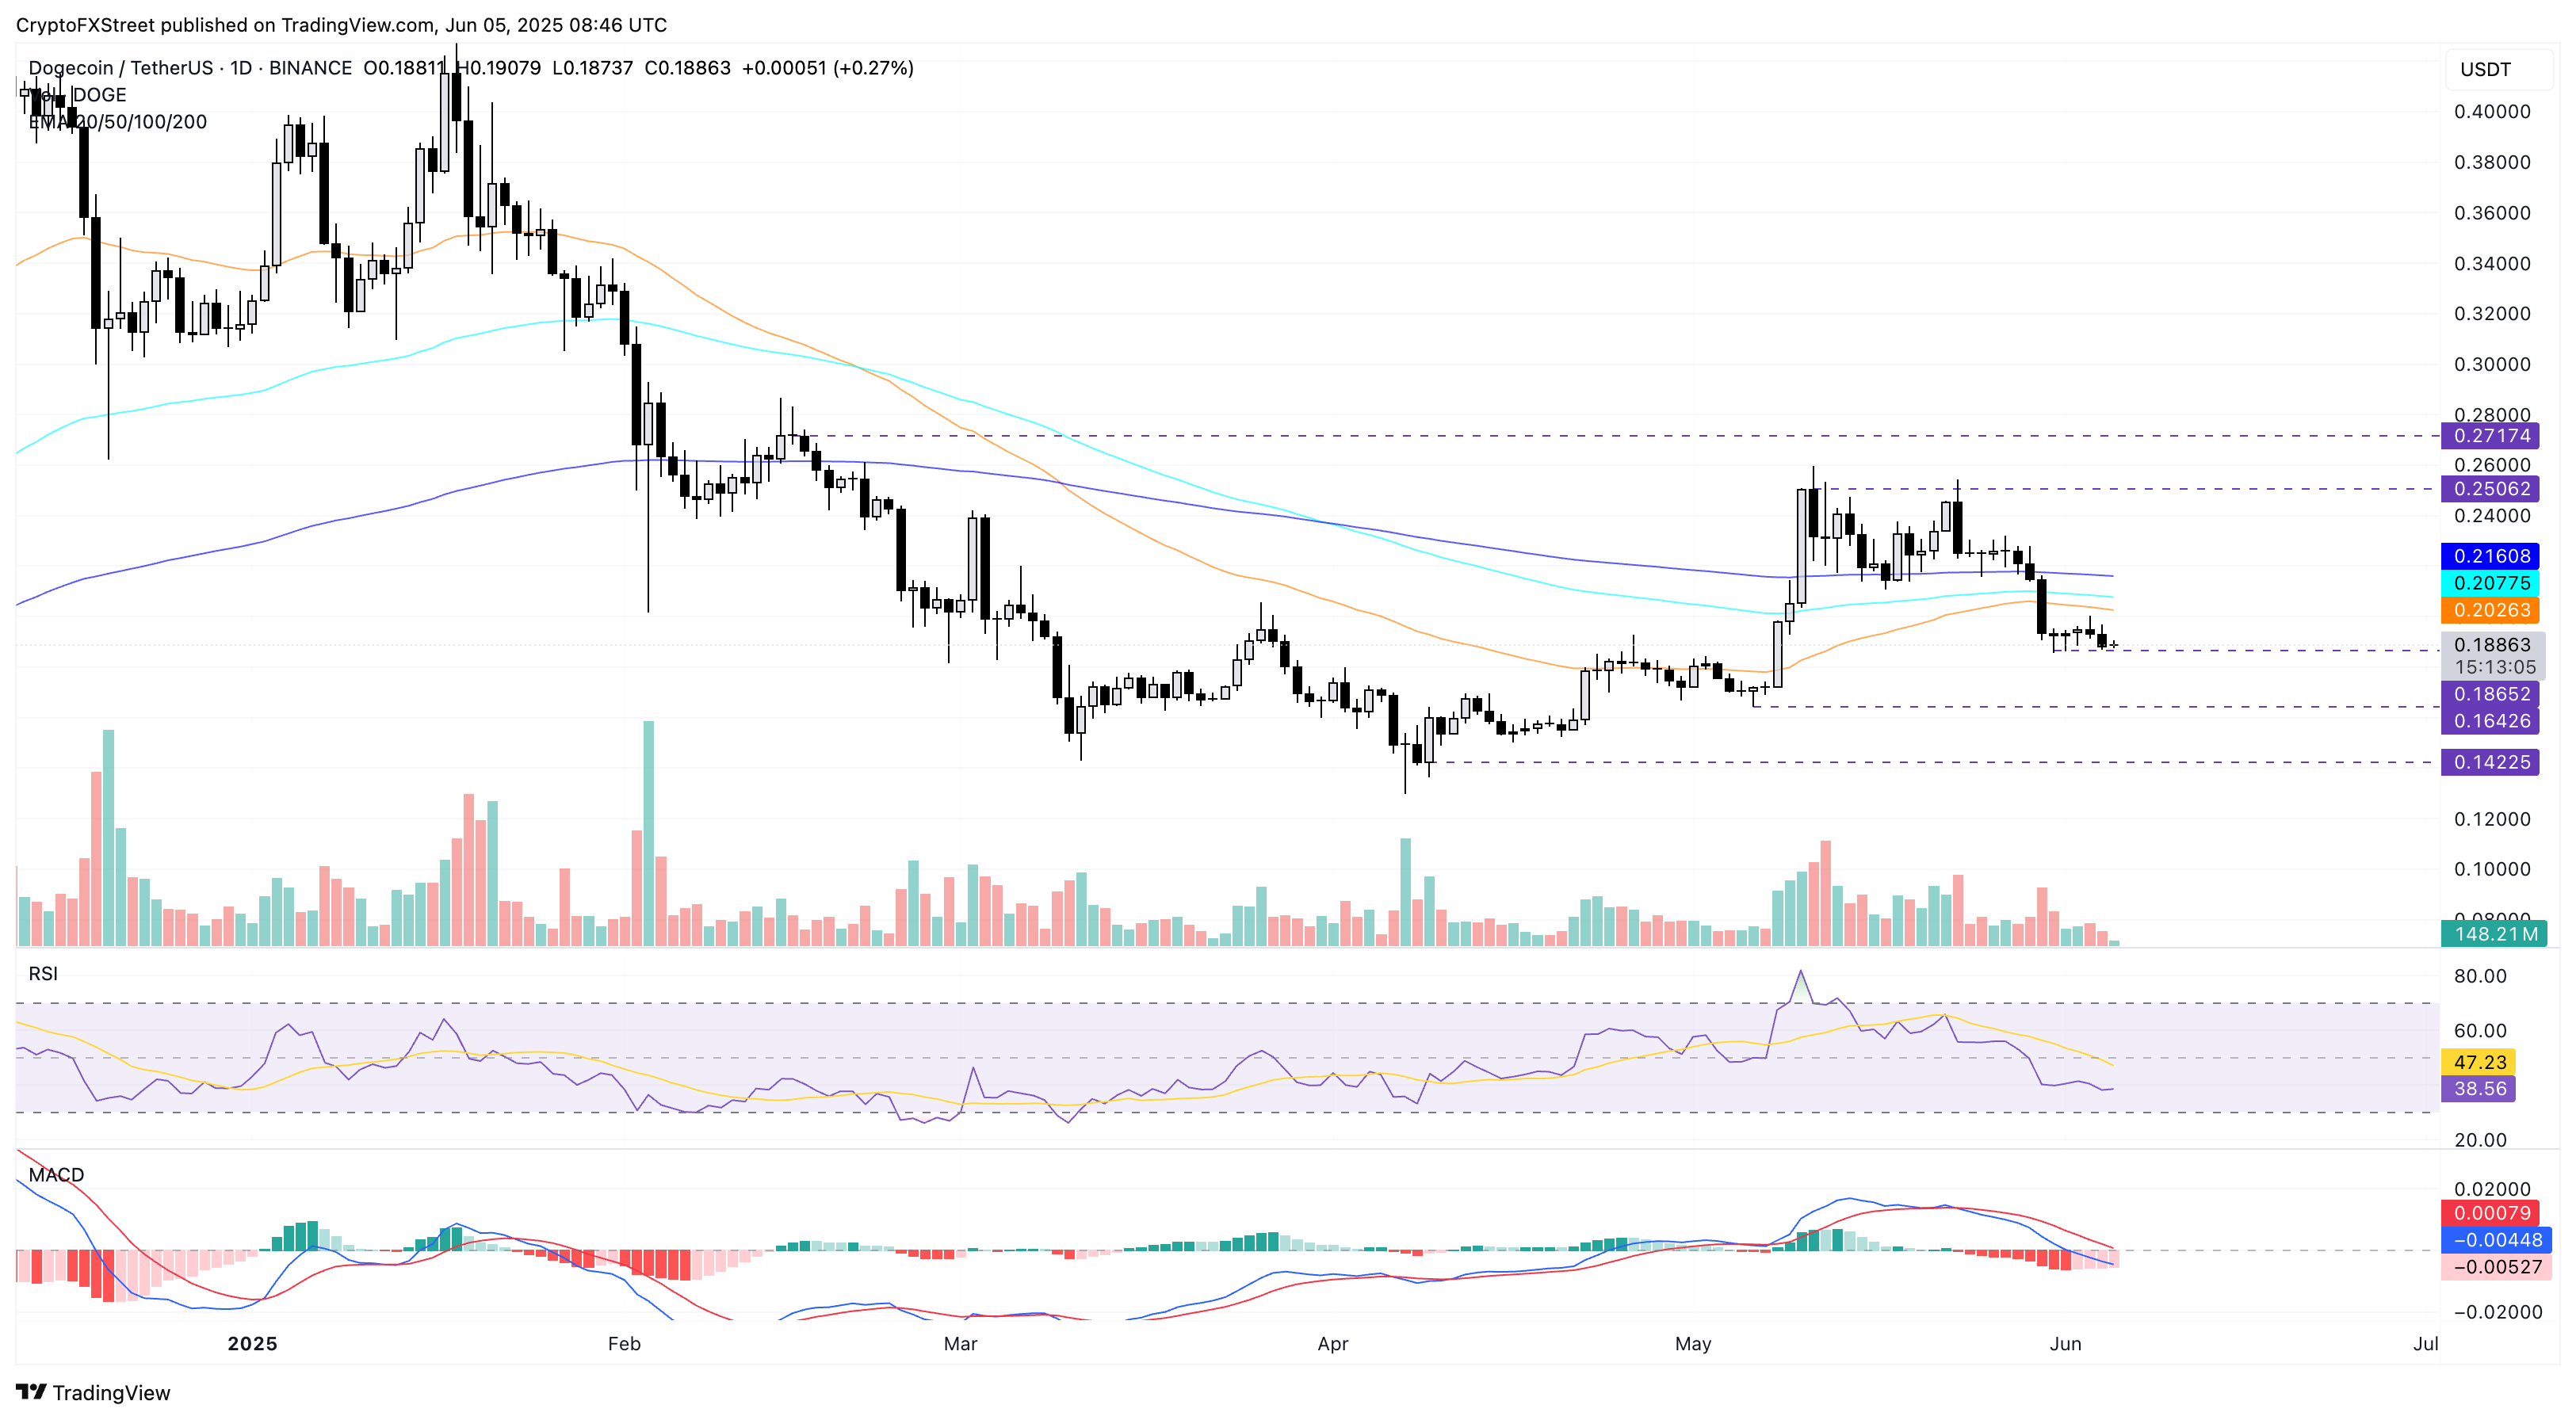
DOGE/USDT daily price chart. Source: Tradingview
On the contrary, a bullish reversal could face immediate opposition at the 50-day EMA at $0.2026.
Shiba Inu loses weekly gains, warns of steeper correction
At the time of writing, shiba inu trades at $0.00001281, experiencing a sudden pullback after a bullish start to the week. Amid increasing bearish momentum, SHIB extends the correction from the weekly high of $0.00001344, depleting the weekly gains and retesting the crucial support level of $0.00001266 (swing low in early May).
Currently, the support level acts as a line of defense, preventing a NEAR 8% drop to $0.00001168 if breached.
Supporting the downside risk, the MACD and its signal line fall deeper into the negative territory while the RSI at 39 approaches the oversold boundary. Hence, the momentum indicators suggest a bearish viewpoint.
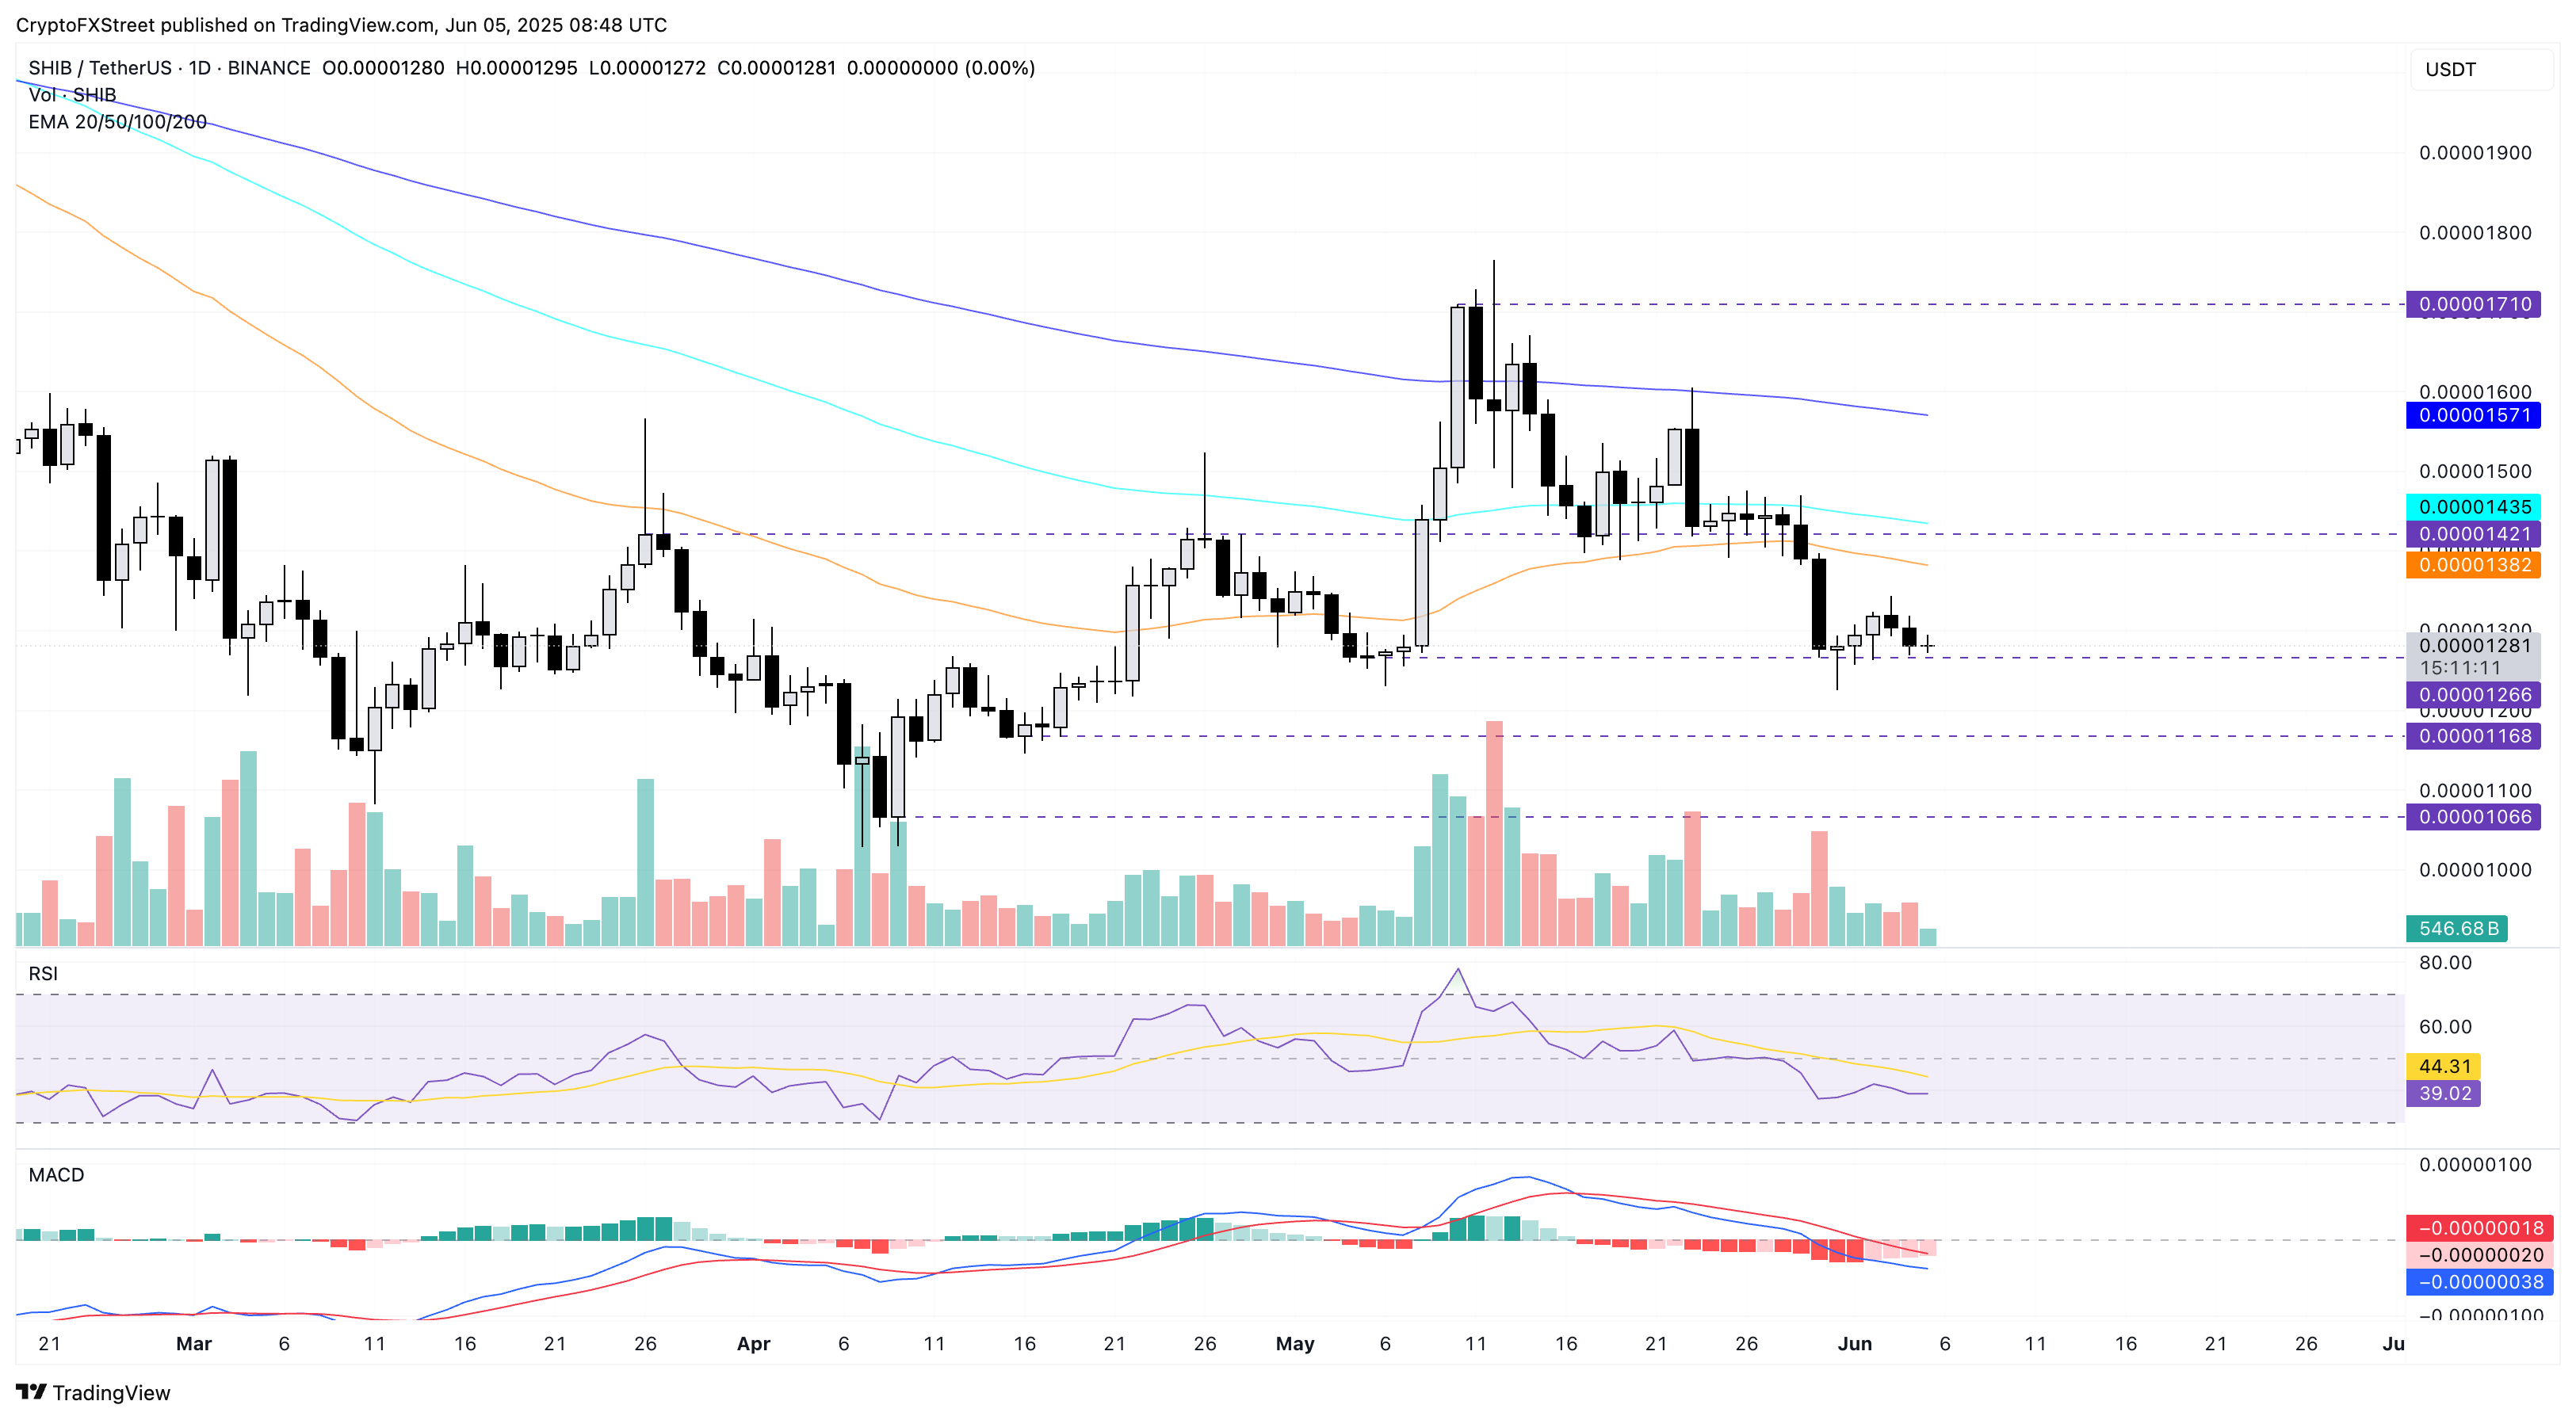
SHIB/USDT daily price chart. Source: Tradingview
However, if SHIB rebounds from the crucial support level, the 50-day EMA at $0.00001382 becomes the key resistance level.
Pepe hits a crossroads at the 50-day EMA
Pepe shares the same fate as other top meme coins, declining to a crucial support level at the $0.00001150 zone, aligning closely with the 50-day EMA at $0.00001146. The meme coin is down almost 10% from the weekly high at $0.00001296 set on Tuesday as the segment cools off.
At the time of writing, Pepe records a pullback of under 1%, while the long-tail candles indicate a high likelihood of bearish continuation. A closing below the 50-day EMA could increase pressure over the 200-day EMA at $0.00001108 to absorb the selling pressure.
If PEPE fractures this dynamic support, a pullback to the $0.000010 psychological level could be imminent.

PEPE/USDT daily price chart. Source: Tradingview
However, should the 50-day EMA provide a cushion to bounce off, the meme coin could rise towards the $0.00001550 resistance, marked by May’s highest closing price.
