Fartcoin Defies Market Skepticism With Quarterly Gains as $1.00 Floor Holds Strong

The meme coin that refuses to die—Fartcoin—is poised to close another quarter in the green, thanks to stubborn support at the psychological $1.00 level. Traders who dismissed it as a joke are now choking on the scent of unrealized gains.
The $1.00 Lifeline
Like a cockroach surviving nuclear winter, Fartcoin’s resilience at the dollar mark has baffled analysts. While ‘serious’ projects crumble under regulatory scrutiny, this gag asset keeps bouncing off its laughably simple support level—proving once again that crypto markets reward audacity over fundamentals.
A Lesson in Market Irony
Wall Street’s quant models never accounted for the power of internet absurdity. As institutional traders scramble to hedge their ‘respectable’ altcoin positions, Fartcoin hodlers—armed with nothing but memes and diamond hands—are quietly stacking profits. The ultimate middle finger to financial orthodoxy.
Love it or hate it, Fartcoin’s survival is a masterclass in market Darwinism. In a world where central banks print money like Monopoly coupons, maybe a currency backed by flatulence humor isn’t the worst store of value after all.
Fartcoin gears up for the first bullish quarter in 2025
Fartcoin is expected to post its first positive quarterly returns at the end of June, following negative returns in the first quarter (Q1). According to CryptoRank’s analytics data, Fartcoin’s second-quarter (Q2) returns stand at 132.5% compared to -51% seen in Q1.
The bullish outlook follows a remarkable 735% recovery to $1.64 from the April tariff-triggered crash, which tested support at $0.20. However, a 43% drop from recent highs subdued the performance in May, which closed at -13.4%.
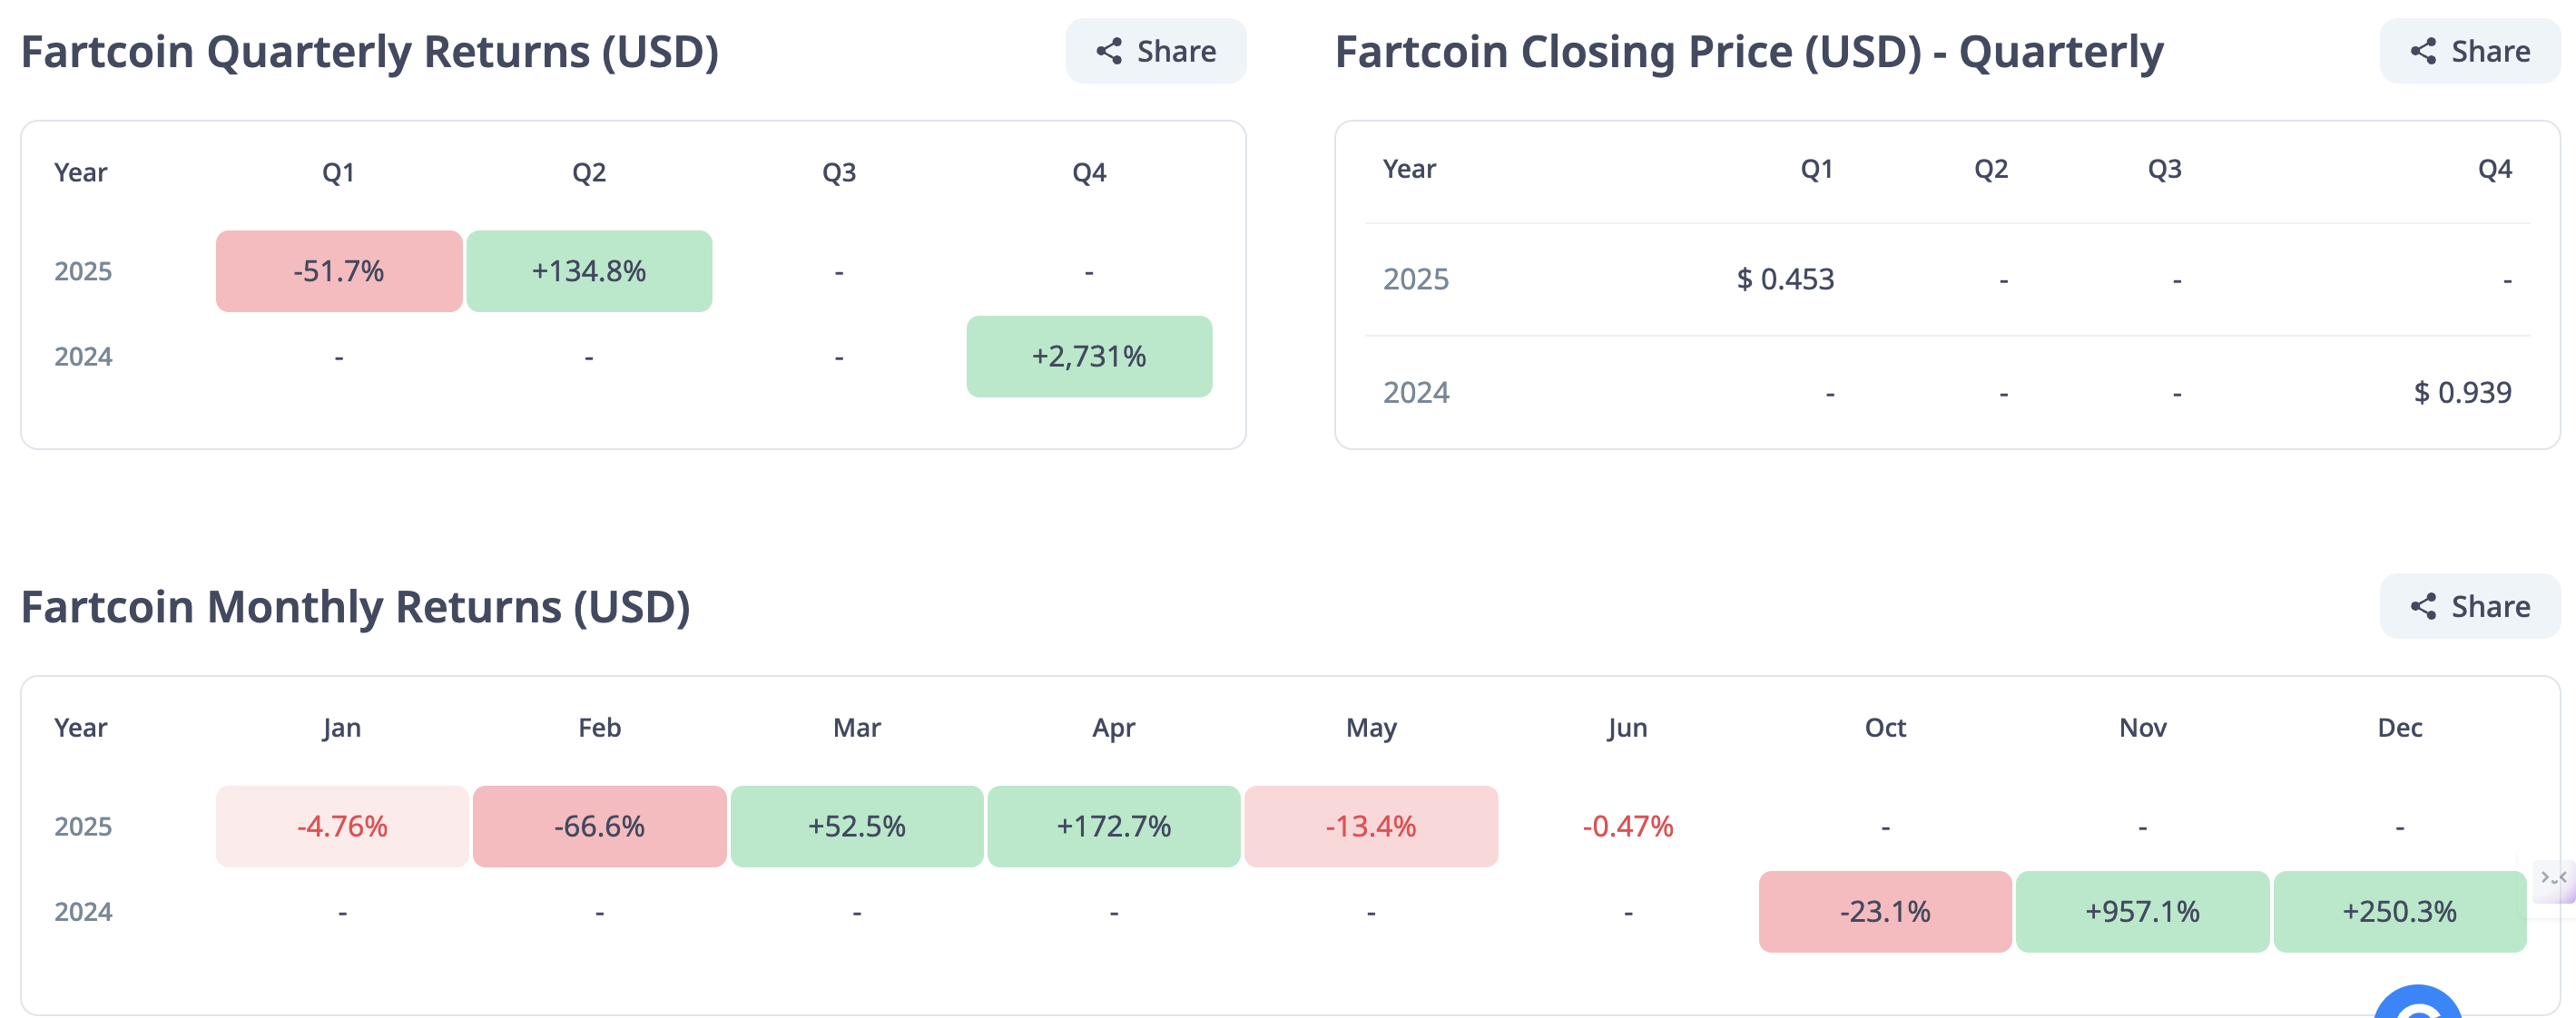
Fartcoin returns | Source: CryptoRank
Technical outlook: Fartcoin bulls defend $1.00 support, but for how long?
Fartcoin sits above the $1.00 level, a robust support level tested twice in May, and by extension, the 100-day Exponential Moving Average (EMA) at around $0.95.
A sell signal from the Moving Average Convergence Divergence (MACD) indicator underscores the bearish momentum. This signal occurred when the blue MACD line crossed below the red signal line on May 25, making Fartcoin shorts more attractive to traders.
The Relative Strength Index (RSI) downtrend below the 50 midline implies a stronger bearish grip. However, a reversal could ensue as the RSI approaches oversold territory, possibly prompting traders to buy the dip and anticipate a larger breakout beyond the hurdle at $1.64.
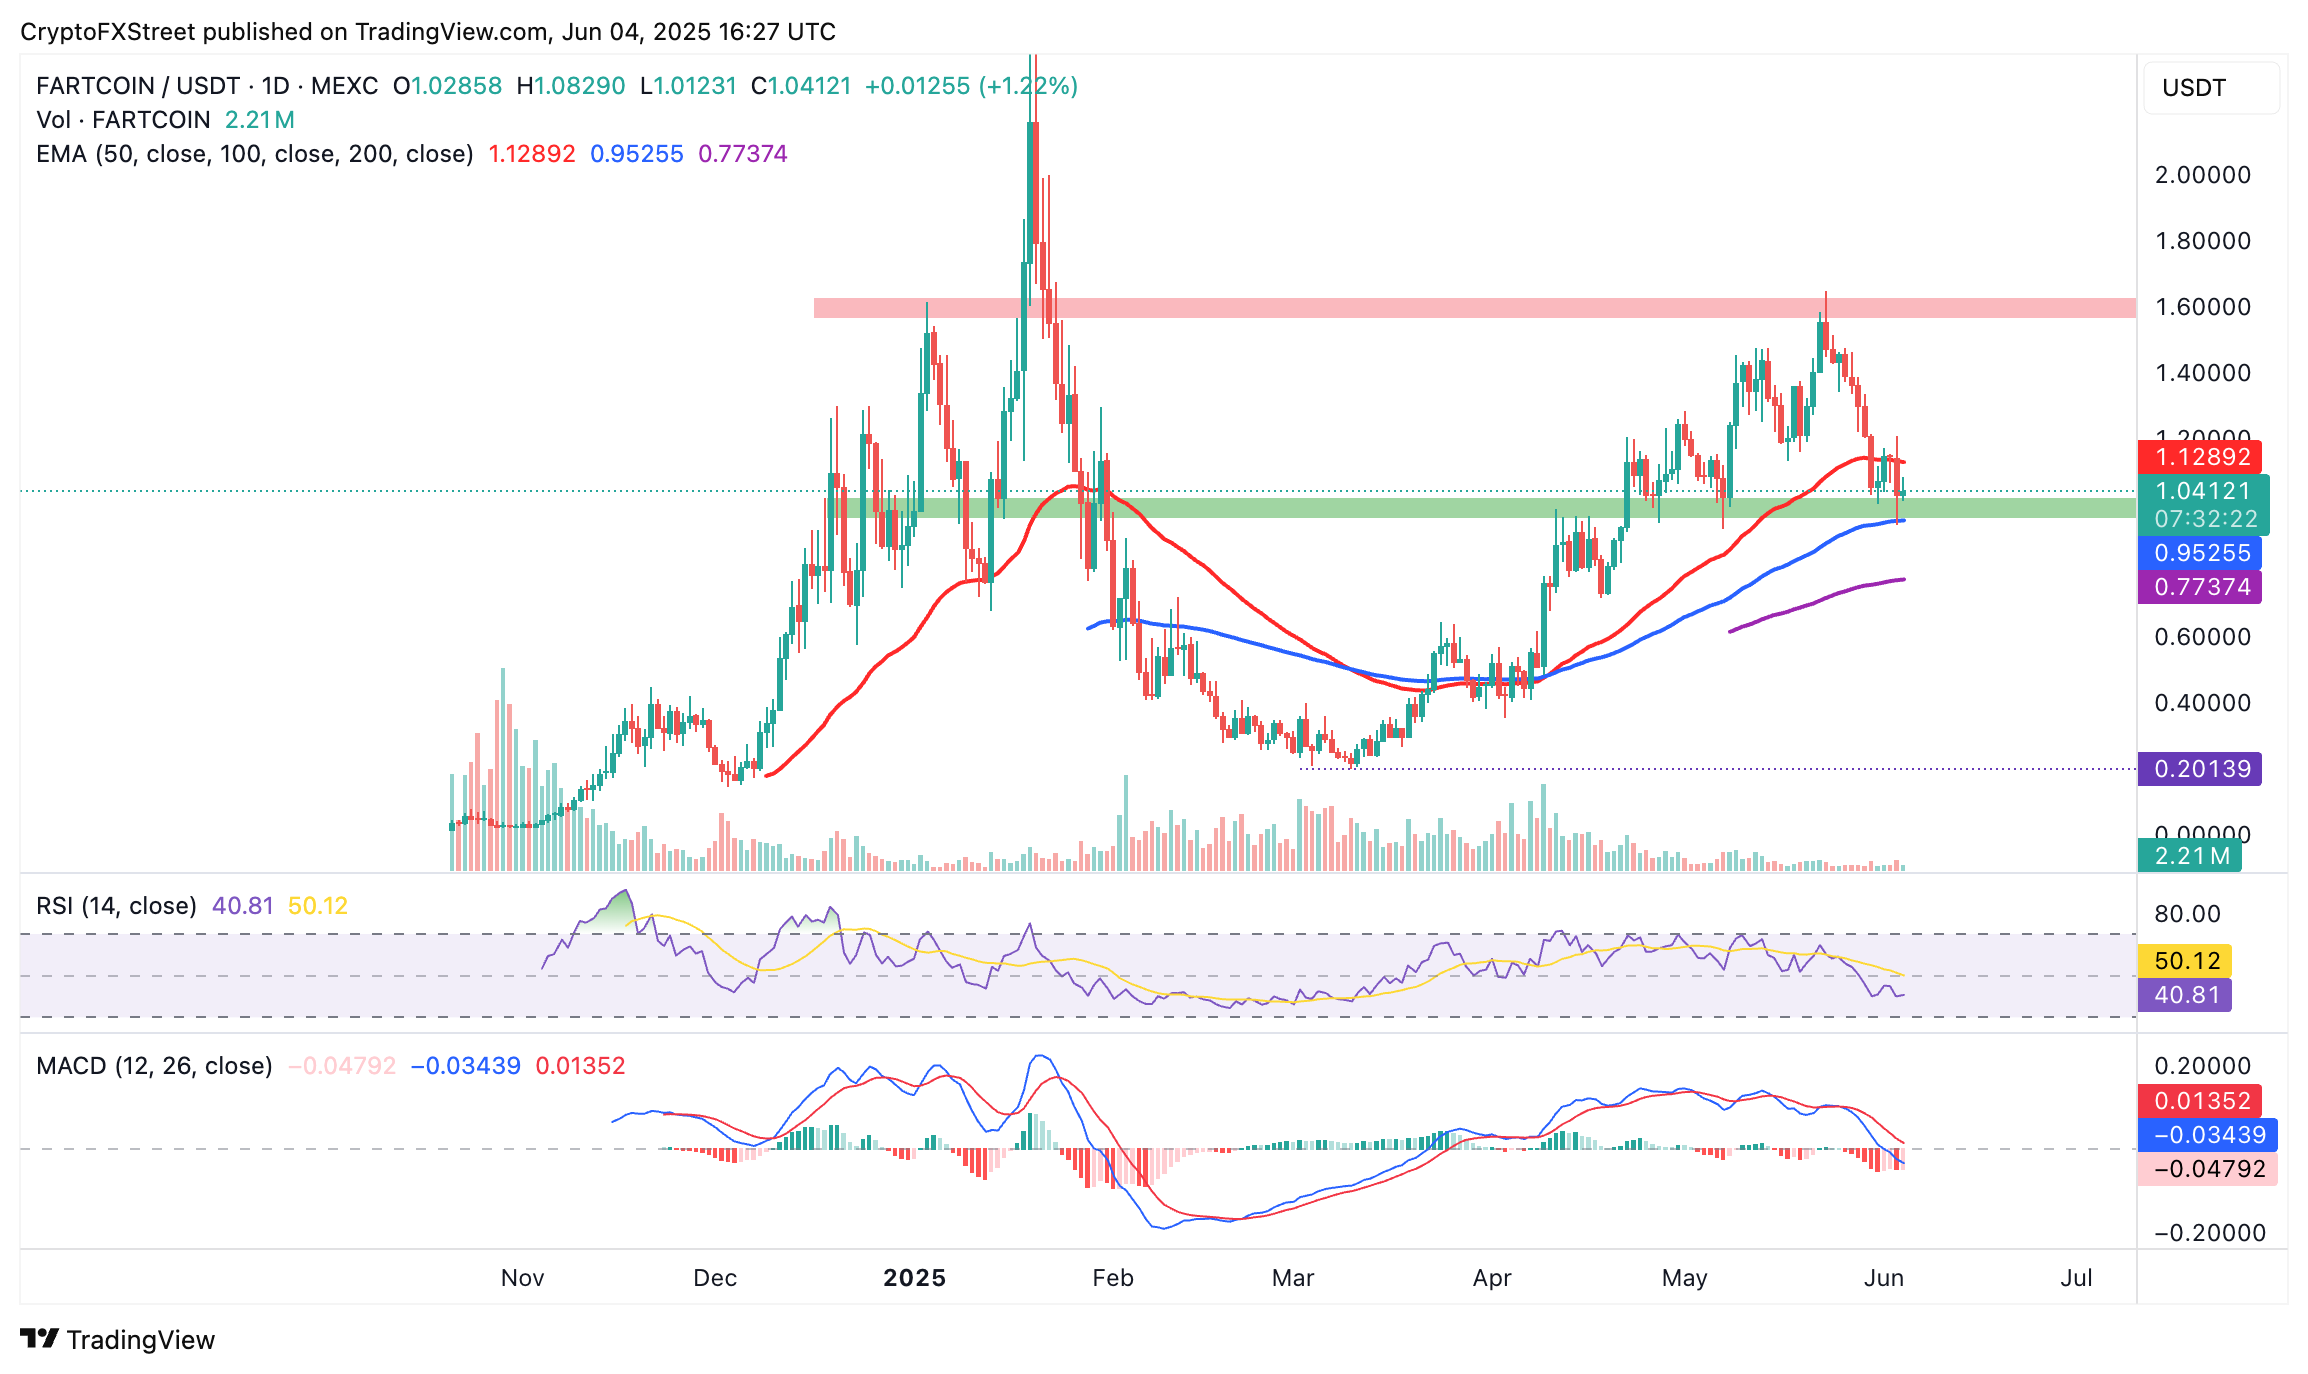
FARTCOIN/USDT daily chart
On the other hand, the rising volume in the derivatives market, while long position liquidations surge to $5.95 million over the past 24 hours, points to declining trader interest in Fartcoin.
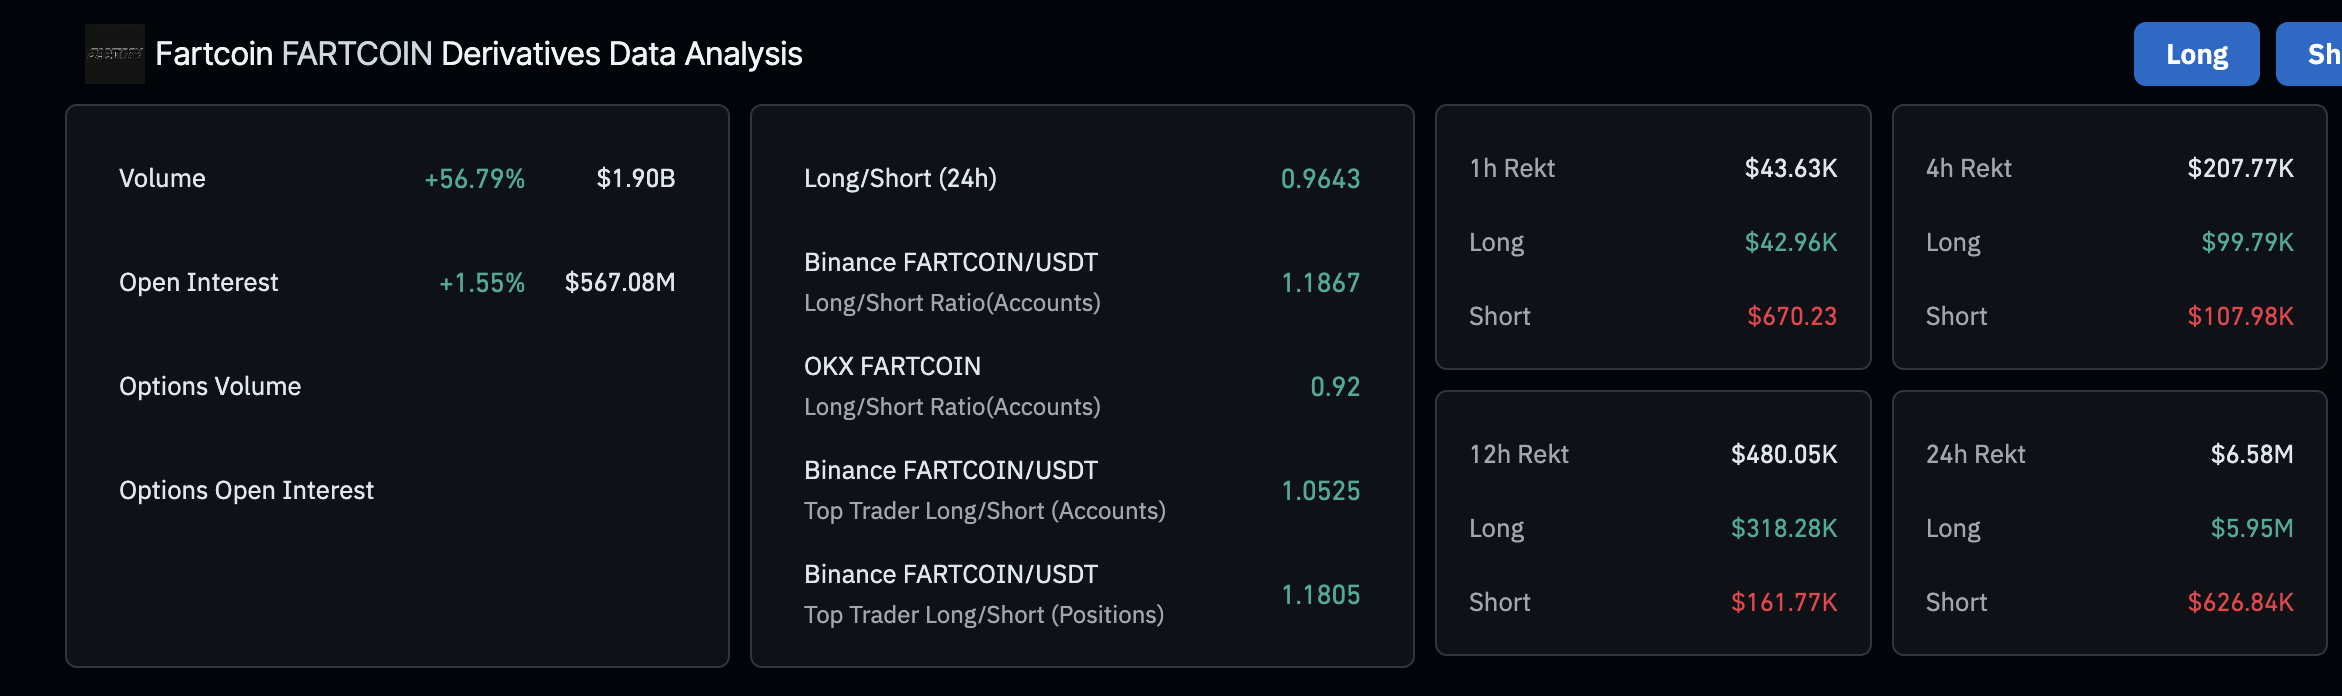
Fartcoin derivatives market data | Source: Coinglass
The subsequent 57% increase in trading volume to $1.90 billion implies that traders are being forced to close their long positions as FARTCOIN drops, contributing to sell-side pressure. Beyond the 100-day EMA support at $0.95, other key monitoring levels include the 200-day EMA at $0.77, which is 25.5% below the current market rate, and the demand area around $0.40, tested in early April.
Cryptocurrency metrics FAQs
What is circulating supply?
The developer or creator of each cryptocurrency decides on the total number of tokens that can be minted or issued. Only a certain number of these assets can be minted by mining, staking or other mechanisms. This is defined by the algorithm of the underlying blockchain technology. On the other hand, circulating supply can also be decreased via actions such as burning tokens, or mistakenly sending assets to addresses of other incompatible blockchains.
What is market capitalization?
Market capitalization is the result of multiplying the circulating supply of a certain asset by the asset’s current market value.
What is trading volume?
Trading volume refers to the total number of tokens for a specific asset that has been transacted or exchanged between buyers and sellers within set trading hours, for example, 24 hours. It is used to gauge market sentiment, this metric combines all volumes on centralized exchanges and decentralized exchanges. Increasing trading volume often denotes the demand for a certain asset as more people are buying and selling the cryptocurrency.
What is the funding rate?
Funding rates are a concept designed to encourage traders to take positions and ensure perpetual contract prices match spot markets. It defines a mechanism by exchanges to ensure that future prices and index prices periodic payments regularly converge. When the funding rate is positive, the price of the perpetual contract is higher than the mark price. This means traders who are bullish and have opened long positions pay traders who are in short positions. On the other hand, a negative funding rate means perpetual prices are below the mark price, and hence traders with short positions pay traders who have opened long positions.
