Pi Network Whale Doubles Down Amid Market Dip—Is This the Bottom?

A crypto whale just went all-in on Pi Network as prices tumble—either a genius move or a very expensive gamble.
While retail traders panic-sell, one deep-pocketed investor sees blood in the water. The aggressive accumulation comes as Pi Network sheds value, down XX% from its recent peak.
Market watchers are split: either this whale knows something we don't, or they're about to learn why 'buying the dip' only works in bull markets. Either way, their conviction puts every other 'HODLer' to shame.
Funny how these 'contrarian plays' always involve someone else's money.
Whale acquires 276 million PI coins in two months
According to PI Scan, a whale with blinders on has been constantly acquiring PI tokens for the last two months. The whale’s holdings have reached 276 million PI coins worth nearly $180 million.
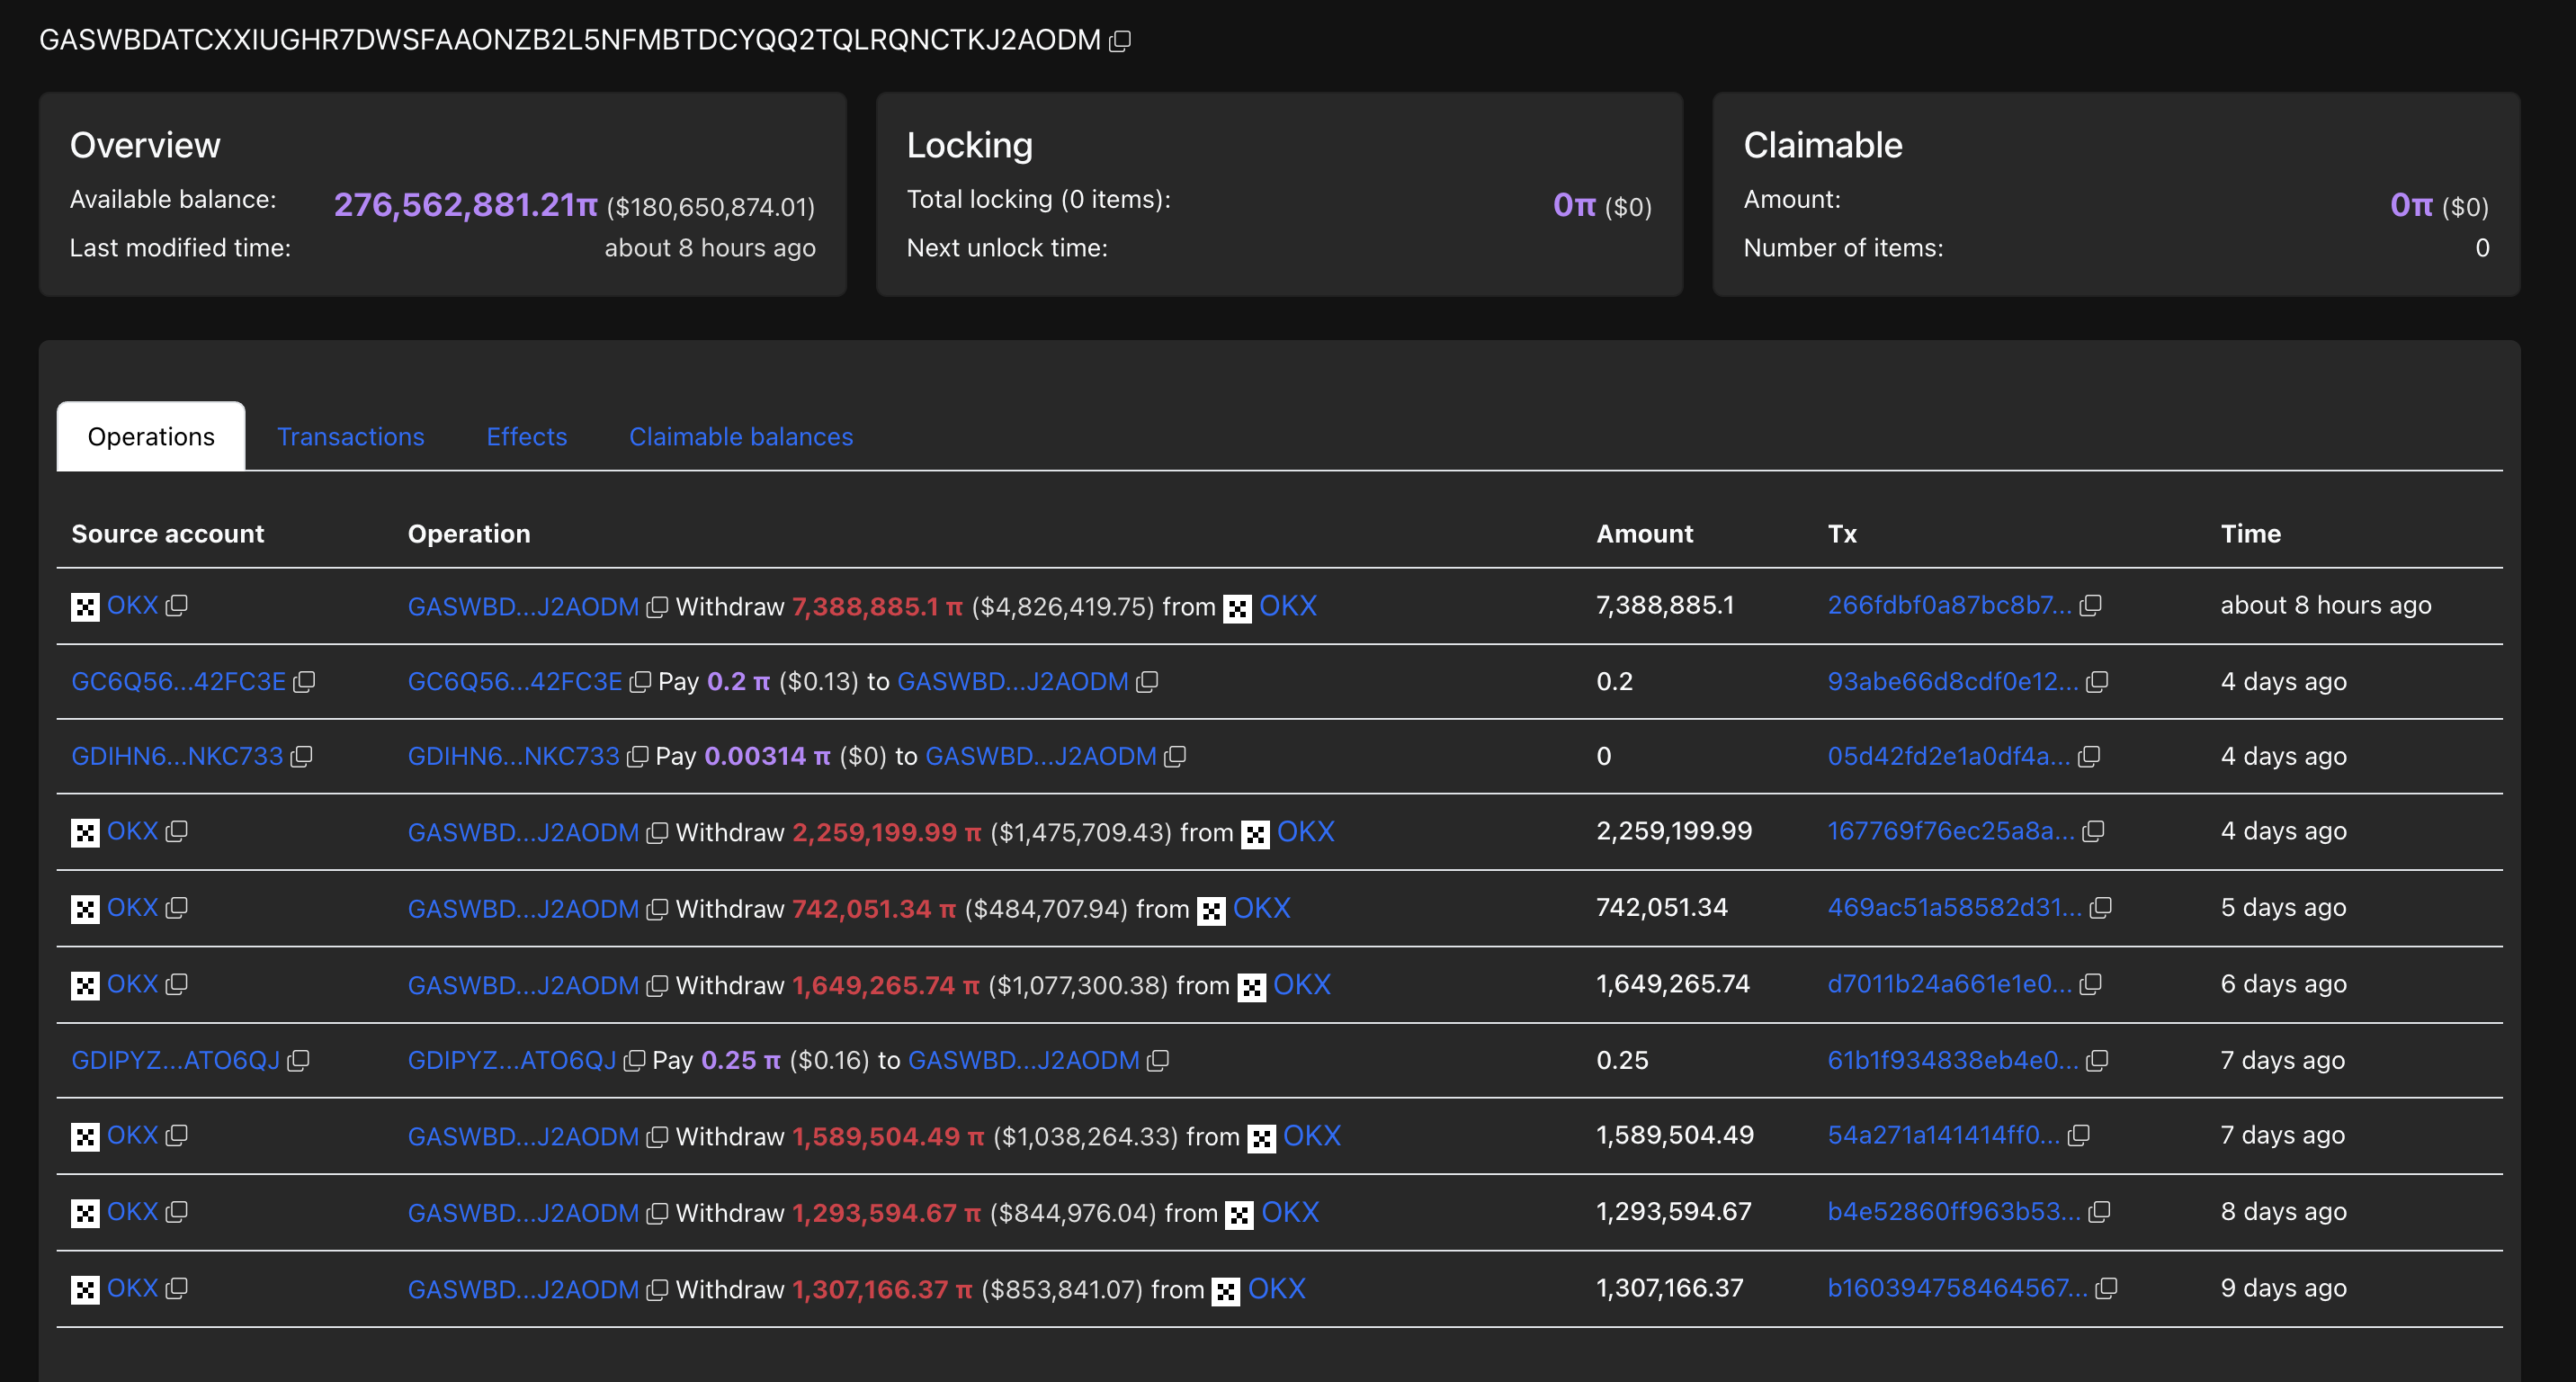
Whale account. Source: PIScan.io
Over the last seven days, multiple withdrawals from the OKX exchange have recorded an inflow of 13.62 million tokens. The most recent withdrawal of 7.38 million coins from OKX happened over 8 hours ago.
Pi Network lacks momentum for a range breakout
Pi Network’s sharp correction last week prolonged the fall from May’s high at $1.6700. The downswing accounts for 60% in just over three weeks and breaks under the $0.6500 support level.
Pi Network price marked its weekly low at $0.6106 on Saturday before taking a swing at the $0.6600 resistance level. At the time of writing, PI is trapped within a sideways range between $0.6285 and $0.6586, and trades at $0.6515.
The momentum indicators imply a mild surge in momentum, as the short-term recovery from $0.6106 has led to consolidation. The Relative Strength Index (RSI), which reads 47 on the 4-hour timeframe, suggests that the bearish momentum is gradually fading. Investors must remain prudent as RSI flattens out below the halfway line, alerting to a potential reversal.
The Moving Average Convergence/Divergence (MACD) indicator and its signal line rise towards the center line, signaling a gradual bullish shift in the underlying trend. However, similar to RSI, reversal risk looms as the positive histogram bars decline in intensity, often a precursor to bearish crossover.
The declining 4-hour, 50-period, 100-period, and 200-period Exponential Moving Averages (EMAs) have achieved bearish alignment with negative crossovers last week. A potential range breakout could face dynamic resistance at the 50-period EMA at $0.6779 before testing the $0.7137 resistance level, aligning with the 100-period EMA.
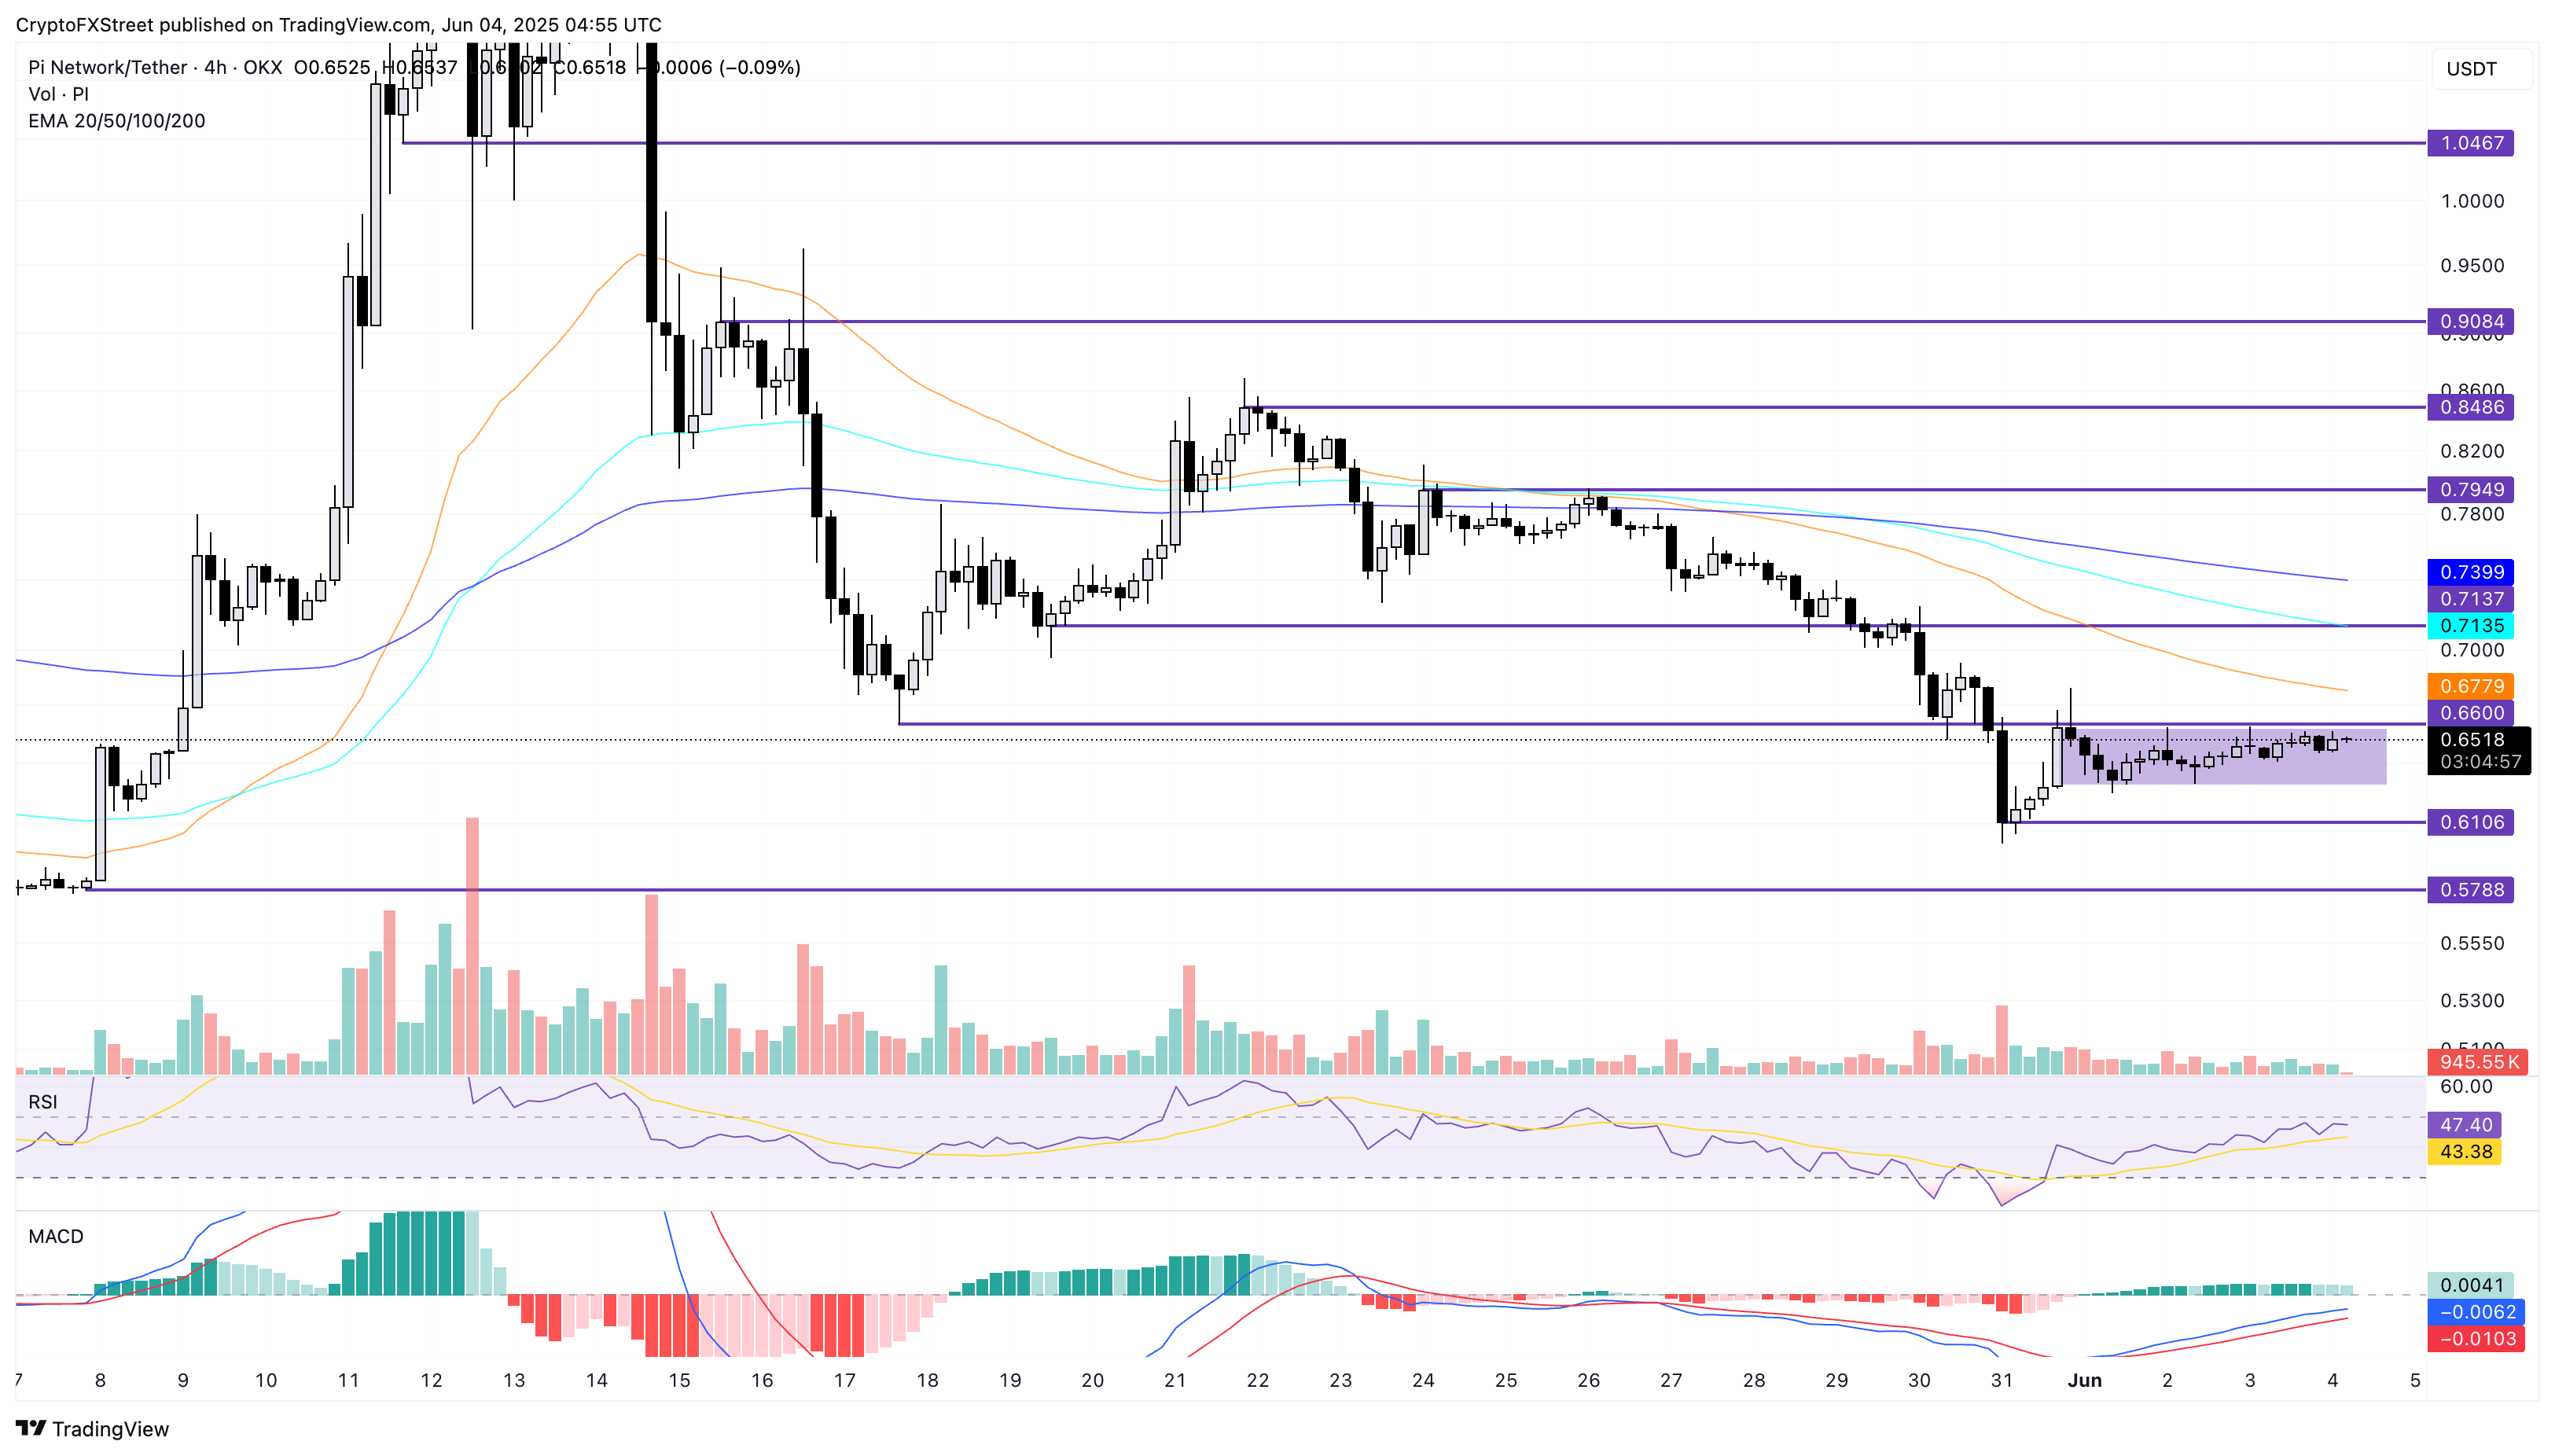
PI/USDT 4-hour price chart. Source: Tradingview
Conversely, a loss in momentum pushing a closing price below $0.6285, the range’s lower boundary, could risk a $0.6106 breakdown. In such a case, sideline traders could witness Pi Network price declining to the $0.5788 support floor.

Log in to Reply
Log in to comment your thoughtsComments
Related Articles
|Square
Get the BTCC app to start your crypto journey
Get started today Scan to join our 100M+ users