Defying Gravity: SKY, QNT, and FET Rip Higher Despite Crypto Risk-Off Mood

While the broader market flinches, these altcoins laugh in the face of caution—because fundamentals are apparently optional in crypto-land.
Quant (QNT) and Fetch.ai (FET) join SKY in a defiant rally, proving once again that 'risk management' is just a suggestion when FOMO takes the wheel. Traders pile in like it's 2021—because who needs sleep when you've got leverage?
Meanwhile, Bitcoin maximalists grumble into their spreadsheets. Some things never change.
Sky targets $0.10 with key resistance breakout
Sky (SKY) is trading at $0.080, experiencing a surge of over 3% as of the time of writing on Wednesday. The RWA token prints its fifth consecutive bullish candle on the daily chart as it bounces off a local support trendline (formed by connecting lows of February 10, March 12, and April 22).
The Moving Average Convergence/Divergence (MACD) indicator triggers a buy signal as the blue MACD line crosses above the red signal. Alongside the increasing volumes, a green histogram bar resurfaces, supporting the bullish outlook.
The Relative Strength Index (RSI) rises to 66, suggesting a robust bullish momentum at hand with room for growth. However, the RSI is approaching the overbought zone above 70, which warns investors to remain cautious.
A potential breakout of the immediate resistance at $0.082 could pump the SKY prices to the $0.10 psychological level.
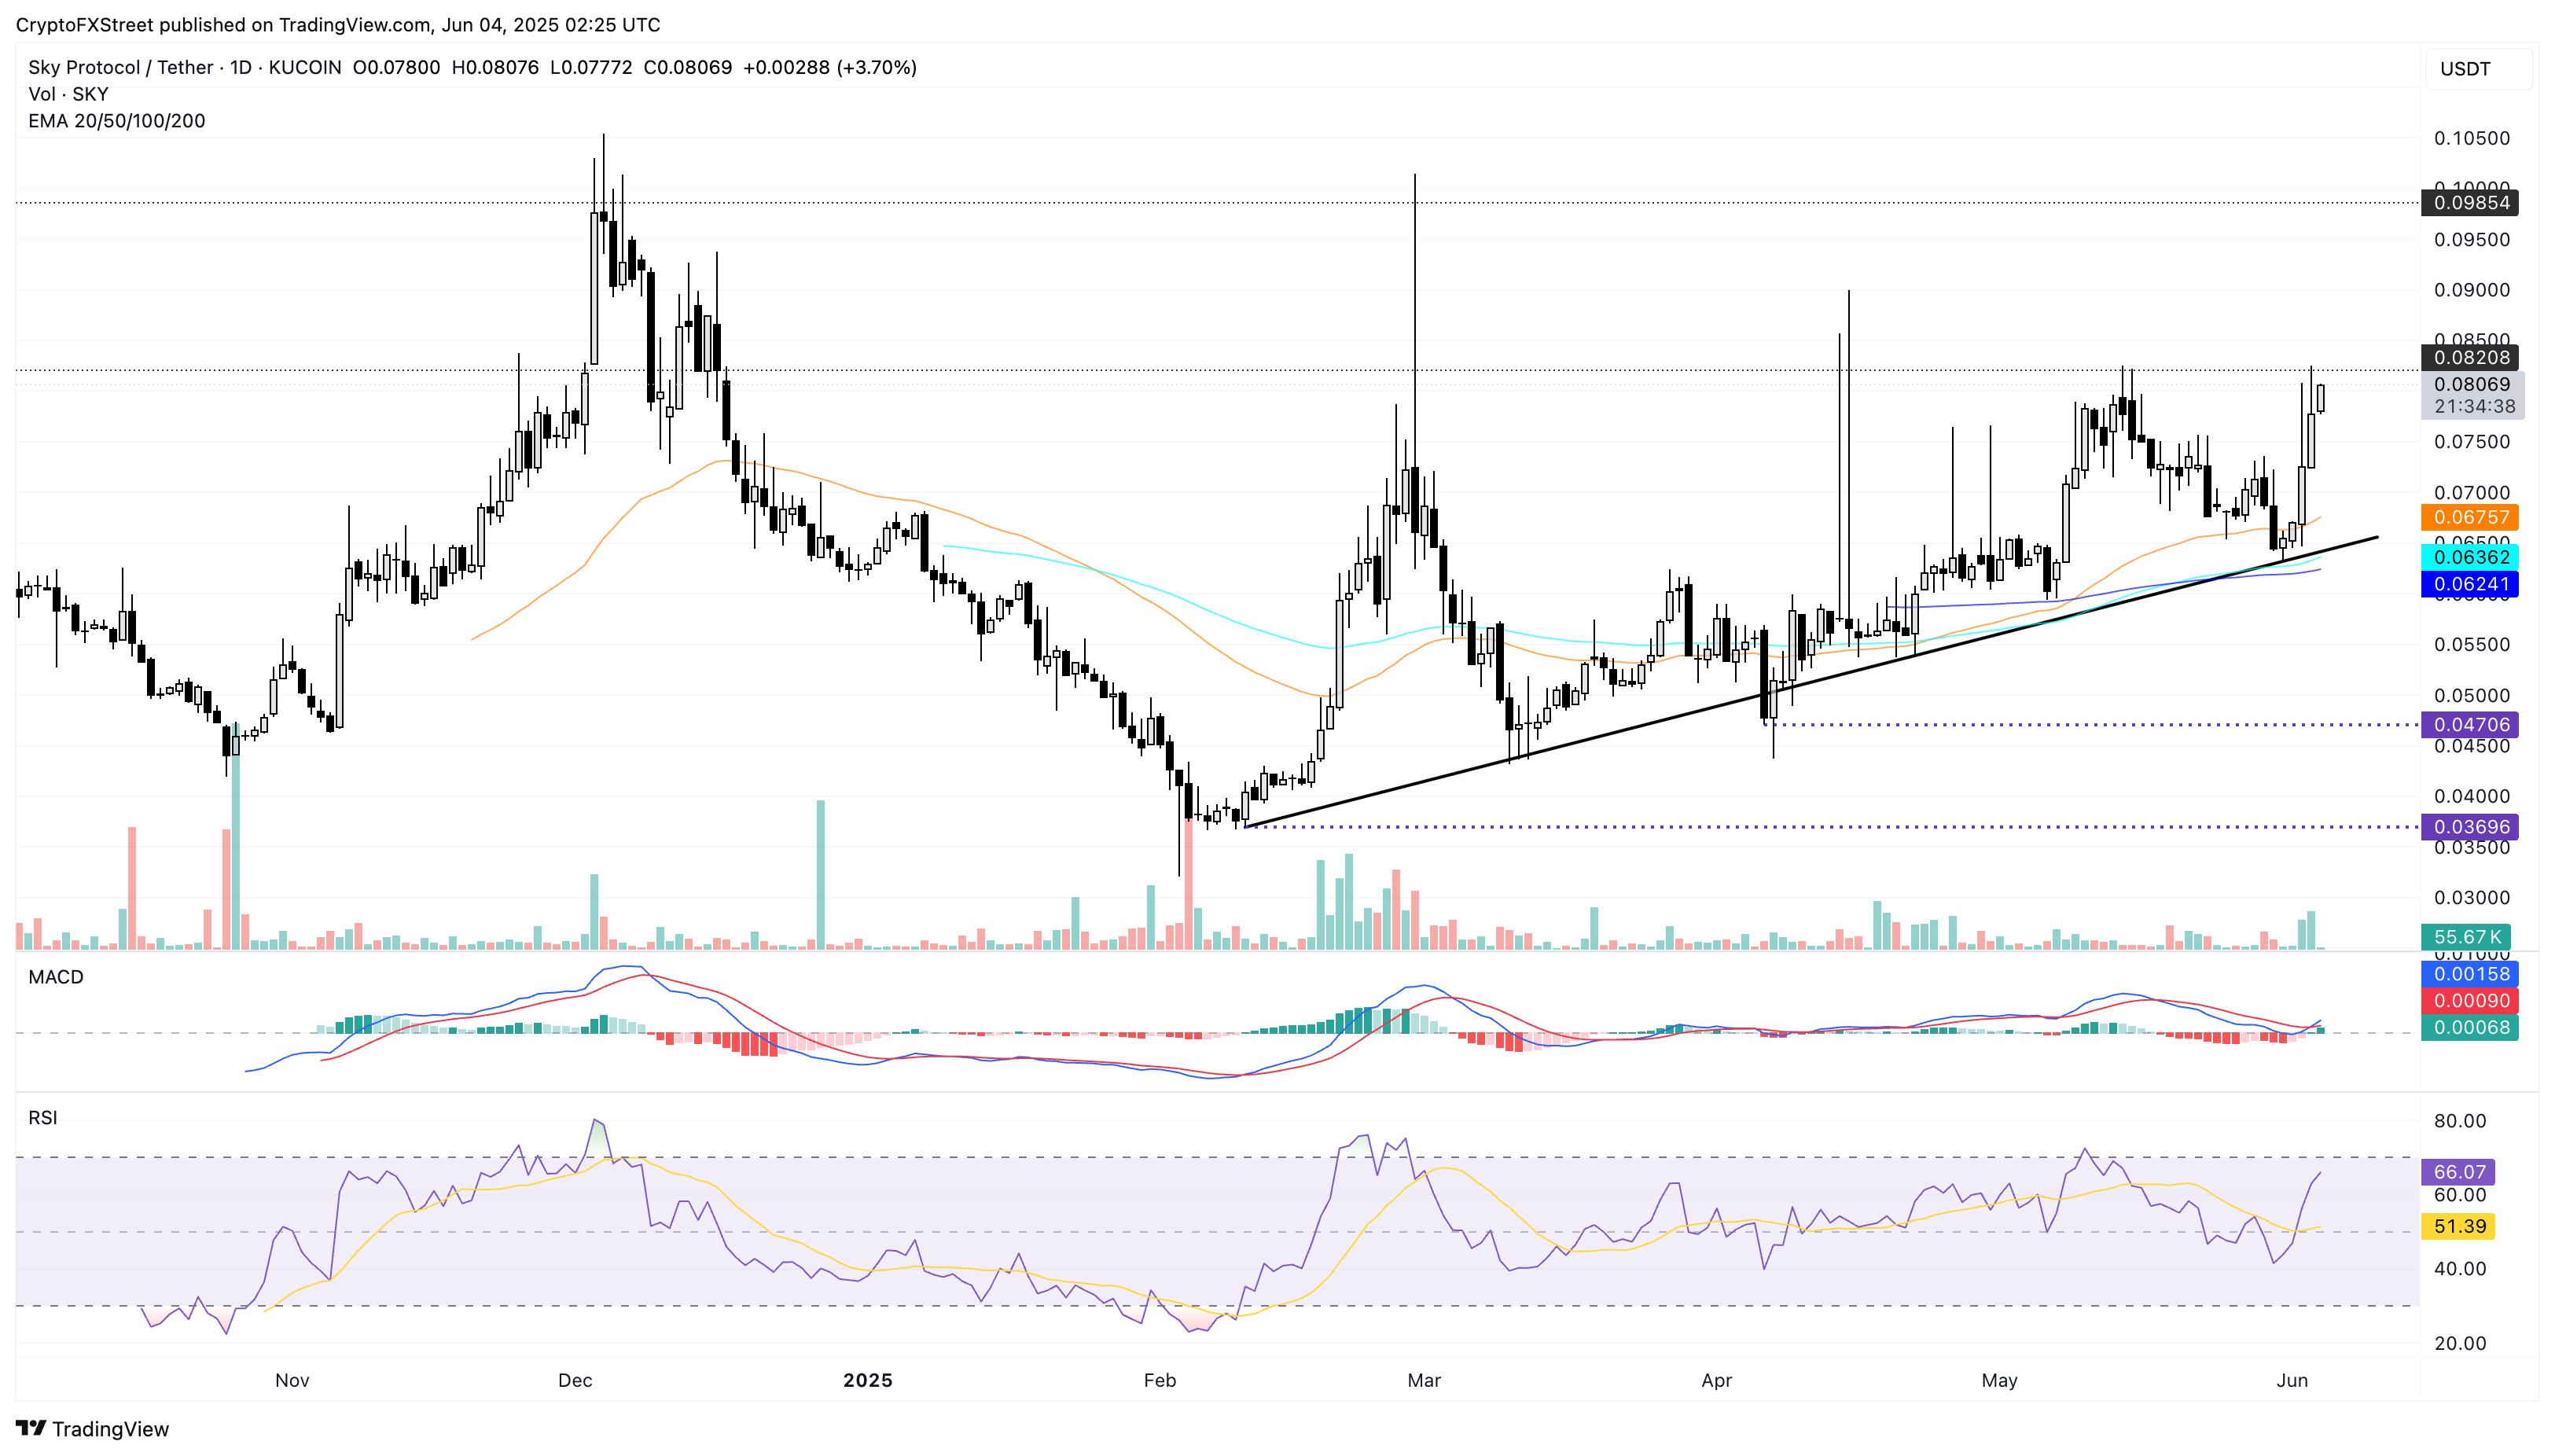
SKY/USDT daily price chart. Source: Tradingview
On the other hand, the 50-day and 200-day Exponential Moving Averages (EMAs) at $0.067 and $0.062, respectively, could absorb a high supply reversal.
Quant holds above key $100 support
Quant (QNT) trades at $116 at press time after a NEAR 8% rise on Tuesday to bounce off a crucial resistance-turned-support zone near $100. With the post-retest reversal, QNT aims to challenge the immediate resistance at $121.
The momentum indicators back a bullish outlook for the RWA token as RSI at 66 hovers under the overbought line, while the MACD and signal line maintain a positive alignment, overcoming the short-term volatility.
Additionally, the 100-day and 200-day EMAs give a bullish crossover, bolstering the trend reversal.
A potential breakout in Quant could reach the next key resistance at $143, highlighted by a short consolidation in early December.
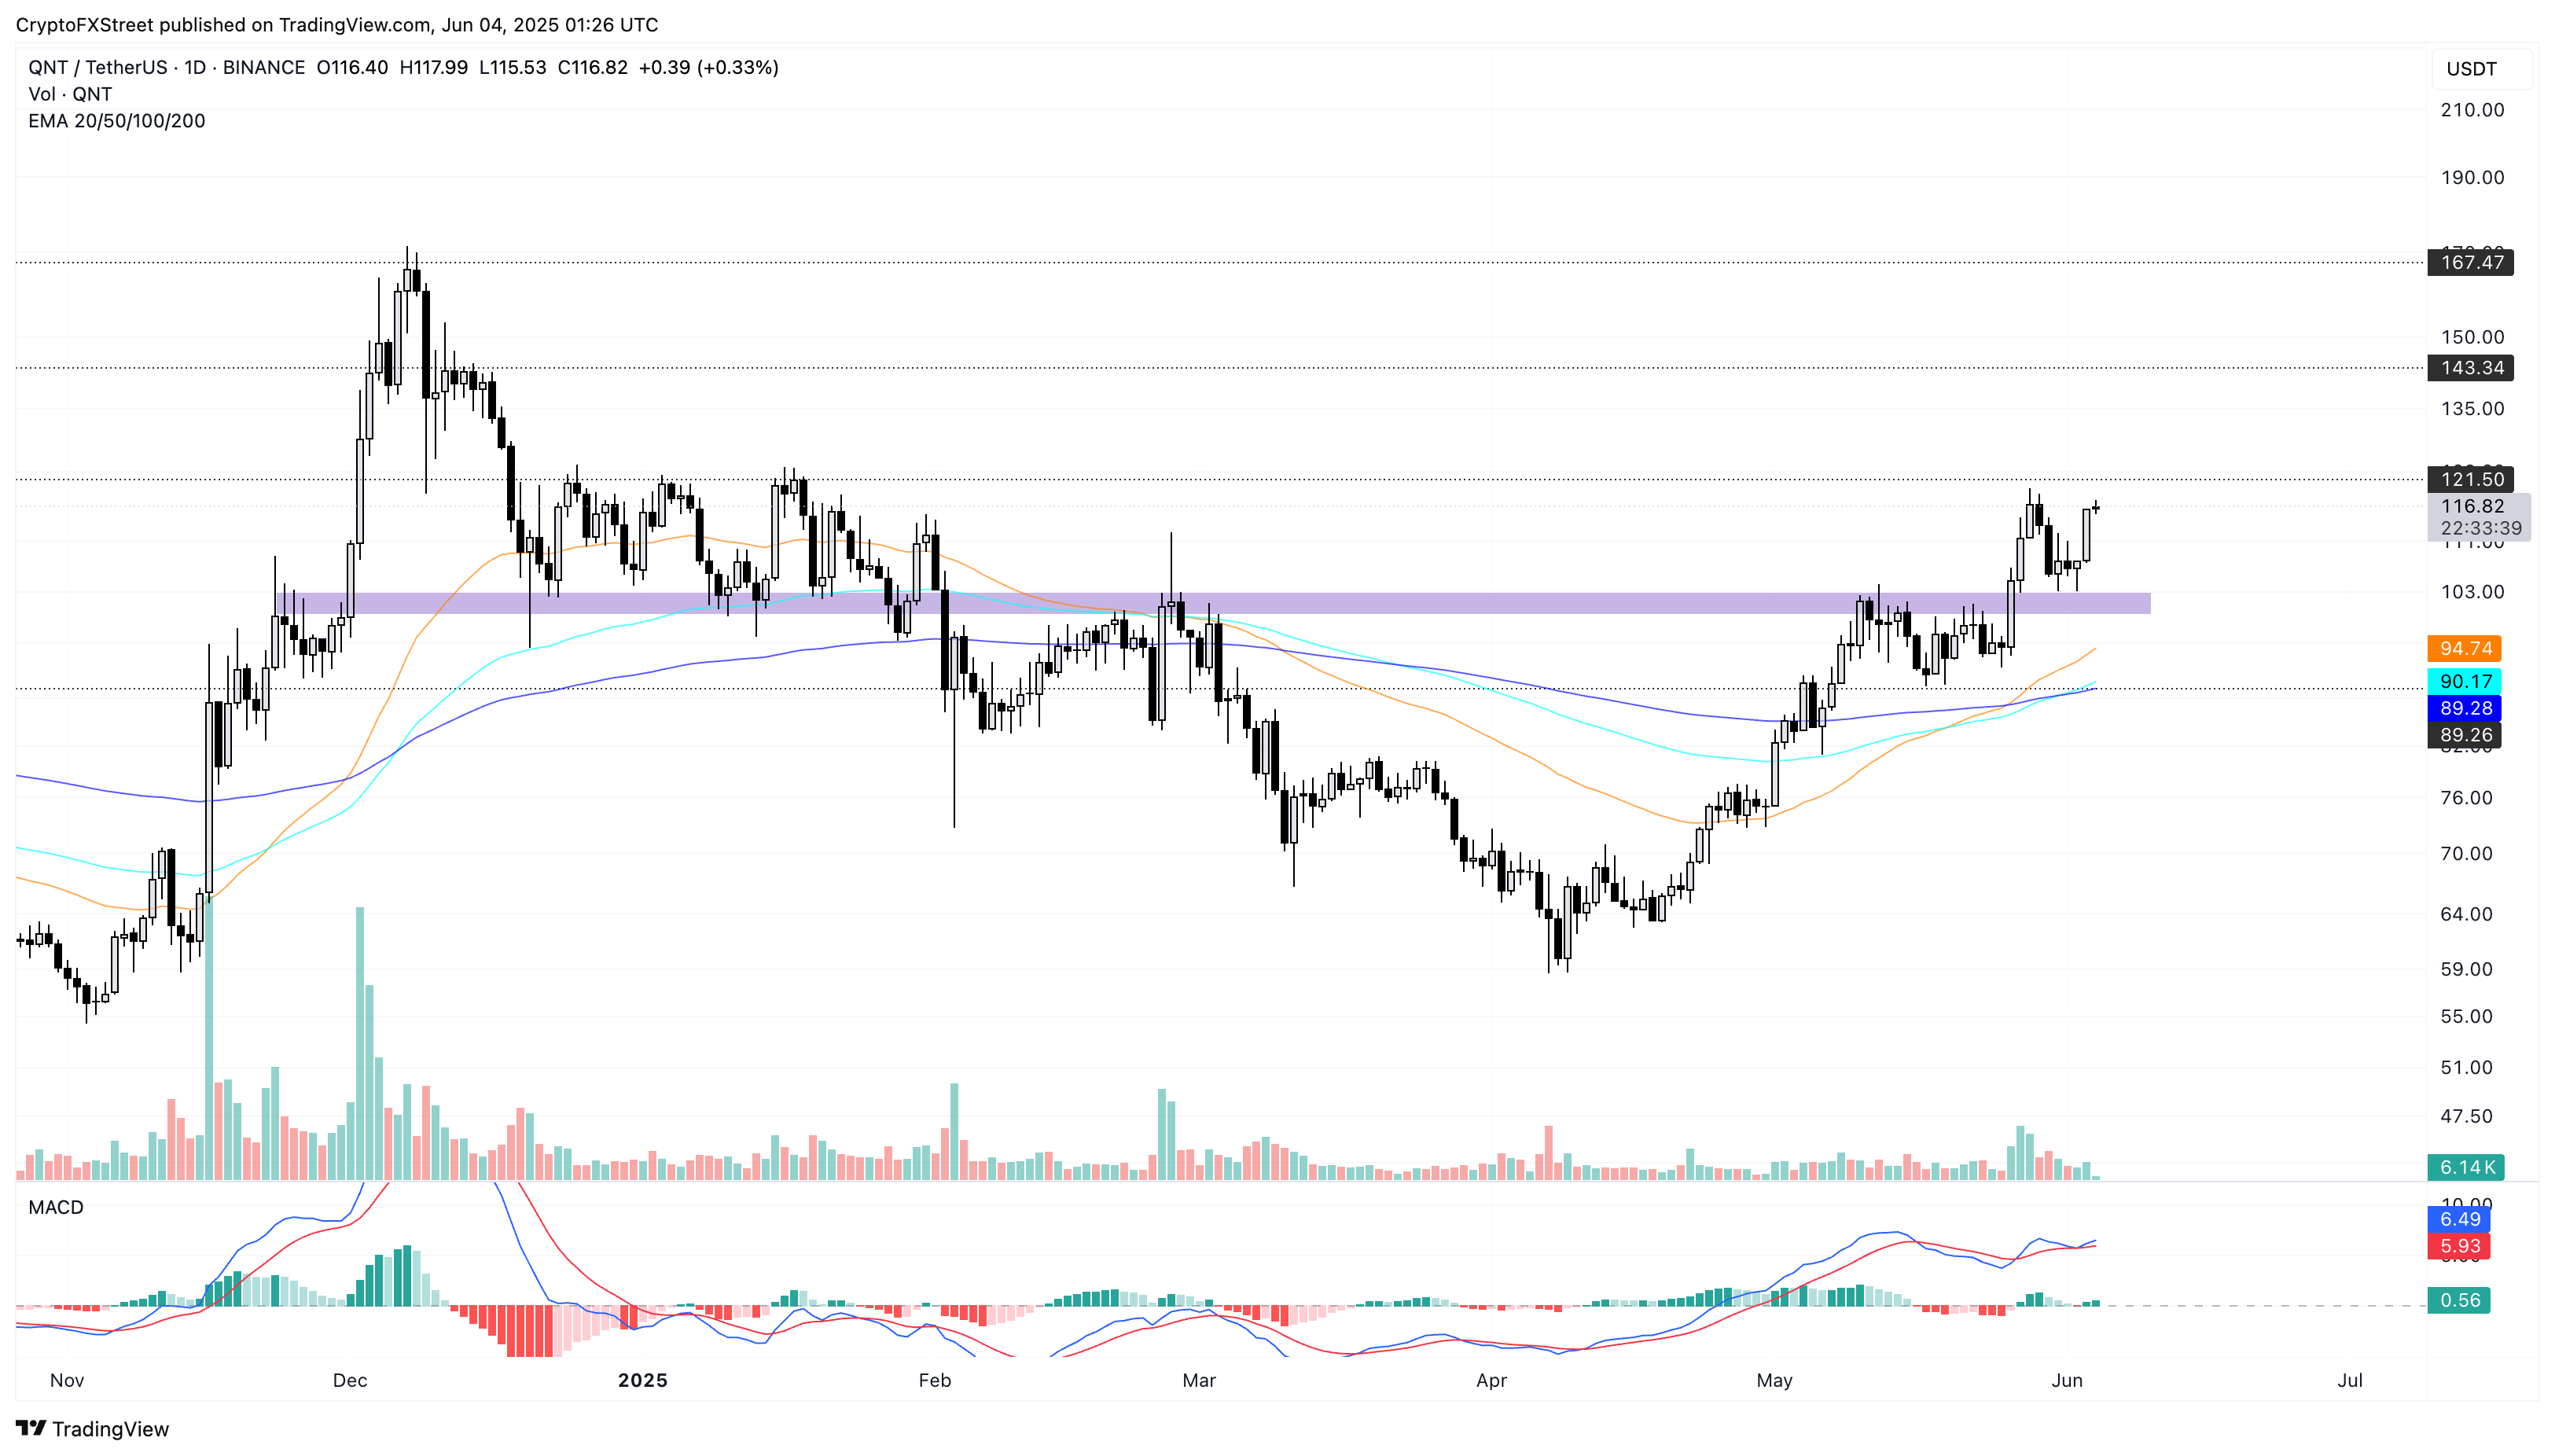
QNT/USDT daily price chart. Source: Tradingview
Conversely, a flip from $121 could result in a pullback to $100.
AI token FET eyes a reversal to $1
The Artificial Superintelligence Alliance (FET) holds the crucial grounds of a $0.70 support floor, with a reversal fueled by multiple long-tailed Doji candles during the weekend. The AI token has soared over 15% from the weekly low at $0.711, aiming to challenge the 200-day EMA at $0.886.
FET’s price action hints at a double bottom reversal as it marked a previous reversal from $0.70 on May 19. The neckline of the bullish pattern lies at the weekly high at $0.935.
The RSI indicator reveals a hidden bullish divergence, as it marks a lower low while FET bounces off $0.70 for the second time. Additionally, the MACD approaches its signal line, hinting at a potential bullish crossover.
A breakout rally above $0.935 could potentially reclaim the $1 mark by testing the January 31 opening price, which is just above $1.
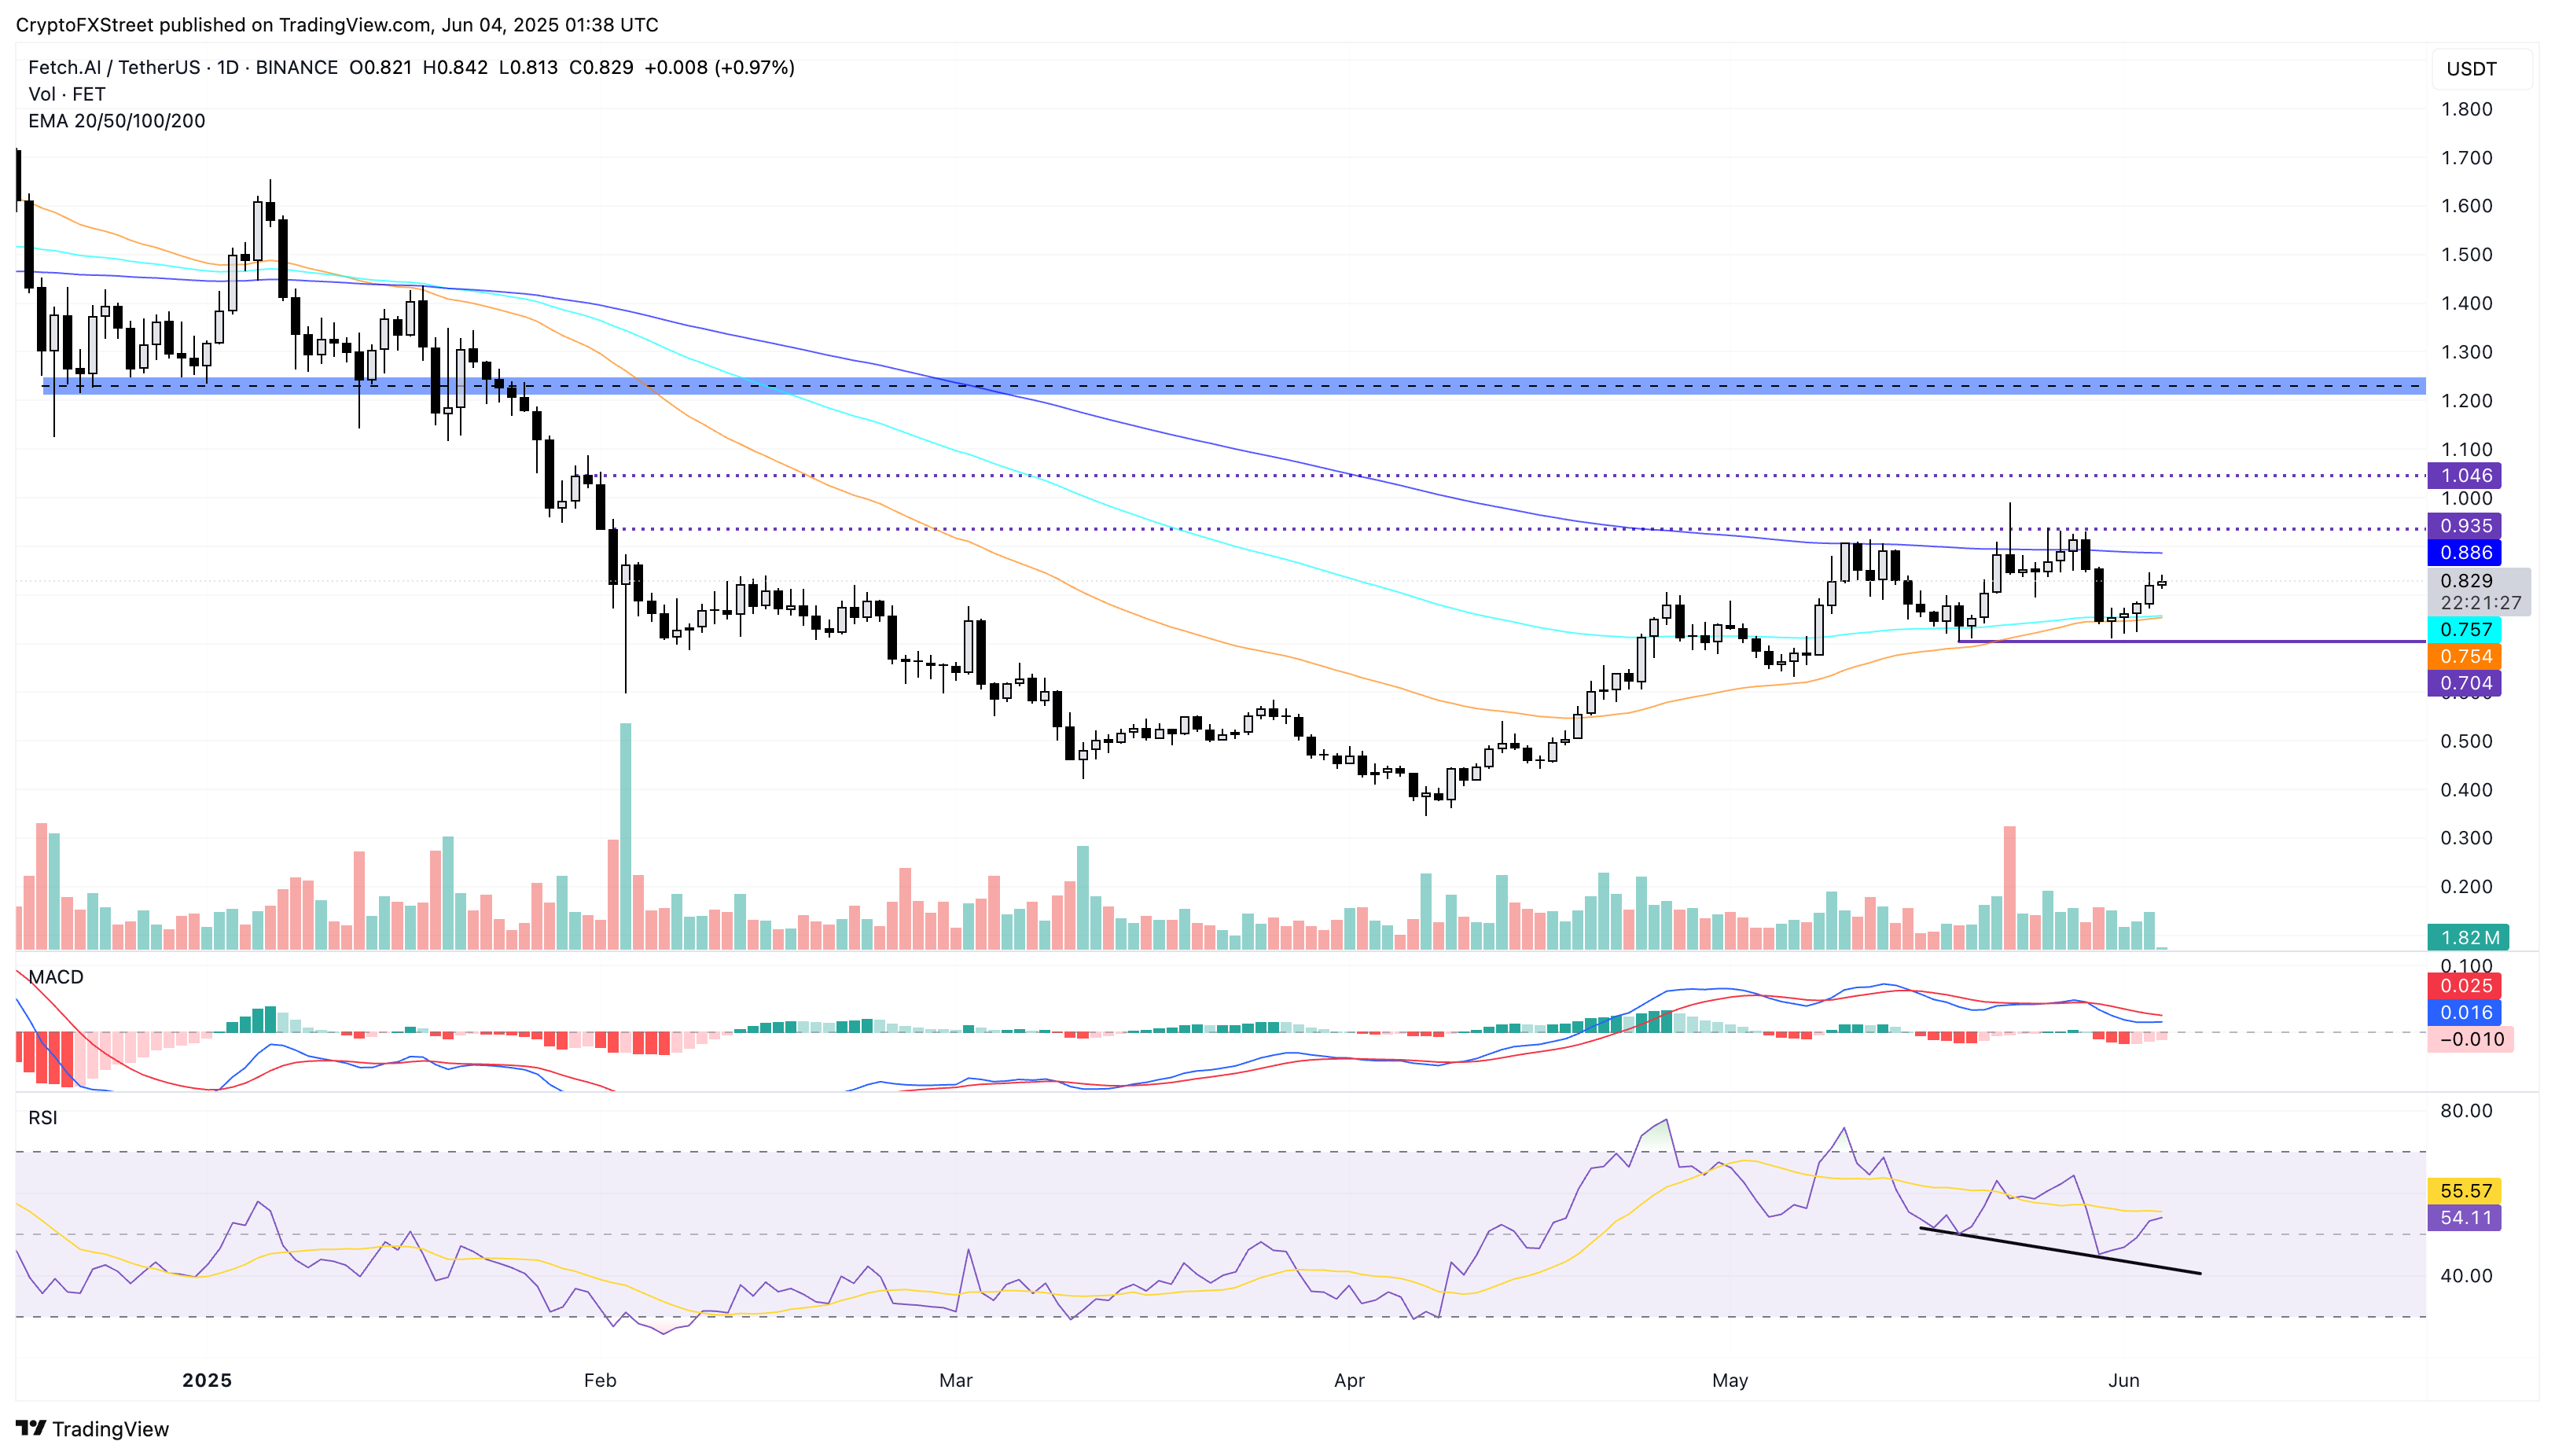
FET/USDT daily price chart. Source: Tradingview
On the flip side, a failure to cross above the $0.935 neckline could extend the consolidation above $0.70 with another pullback.

Log in to Reply
Log in to comment your thoughtsComments
Related Articles
|Square
Get the BTCC app to start your crypto journey
Get started today Scan to join our 100M+ users