Ethereum Breaks Losing Streak: Whales and ETF Demand Push ETH to First Monthly Gain of 2025

After months of bleeding, Ethereum finally flips the script—thanks to deep-pocketed whales and a surge in ETF inflows. The second-largest crypto by market cap claws its way back into the green, marking its first positive monthly close this year.
Whales Dive In
Oversized buys from institutional players and crypto whales snap up ETH at levels not seen since the last bull run. Guess even digital asset tycoons get FOMO.
ETFs Fuel the Fire
Newly approved spot Ethereum ETFs—Wall Street’s latest attempt to ’democratize’ finance while skimming fees—add rocket fuel to the rally. Because nothing says ’decentralization’ like a BlackRock prospectus.
Ethereum’s rebound sparks cautious optimism, but let’s see if it lasts longer than a crypto influencer’s attention span.
Ethereum returns to the limelight in May; whales and ETF investors fuel 46% rally
Ethereum is on track to finish May as its first positive month in 2025, with a monthly return of approximately 46%, according to data from Laevitas.ch. The switch to bullish momentum for ETH in the month follows the softening of tariff pressures after the US reached trade agreements with several countries, including the UK and China (temporarily).
The positive macroeconomic signs triggered bullish sentiment among ethereum whales, as addresses holding between 10K - 100K ETH grew their holdings from 16.50 million ETH to 17.62 million ETH in May — a 1.12 million ETH increase, representing ETH’s largest monthly whale buying pressure since July 2022.
-1748640070508.png)
ETH Balance by Holder Value. Source: CryptoQuant
A similar sentiment was evident across US spot Ethereum ETFs, which have recorded net inflows of $493.94 million so far in May, flipping their cumulative flows in 2025 positive. Notably, the products posted net inflows of $91.93 million on Thursday, stretching their streak to nine consecutive days of positive flows.
Ethereum’s open interest (OI) also surged by 43% in the month, rising from $12.18 billion to $17.53 billion. Open interest is the total amount of unsettled contracts in a derivatives market.
However, the OI growth is nuanced compared to the previous metrics, as investors have been building huge short positions — outweighing longs — on Binance, as evident in the chart below. This could be whales hedging their bets or pure short plays that predict a downtrend in ETH.
-1748640096437.png)
ETH Net Taker Volume (Binance). Source: CryptoQuant
Heading into the weekend, investors have returned to net buying, with Ethereum exchange flows shifting to net outflows of over 114,000 ETH on Friday, marking the end of a three-day inflow streak. In contrast to ETFs, exchange net outflows signal dominant buying pressure on the spot market.
%20-%20All%20Exchanges%20(6)-1748640116708.png)
ETH Exchange Netflows. Source: CryptoQuant
Ethereum Price Forecast: ETH tests ascending triangle support
Ethereum saw $117.76 million in futures liquidations in the past 24 hours, according to Coinglass data. The total amount of long and short liquidations is $98.61 million and $19.15 million, respectively.
ETH crossed below the rising trendline of an ascending triangle and the 14-day Exponential Moving Average (EMA) on Friday after seeing a rejection at the $2,750 key resistance the previous day.
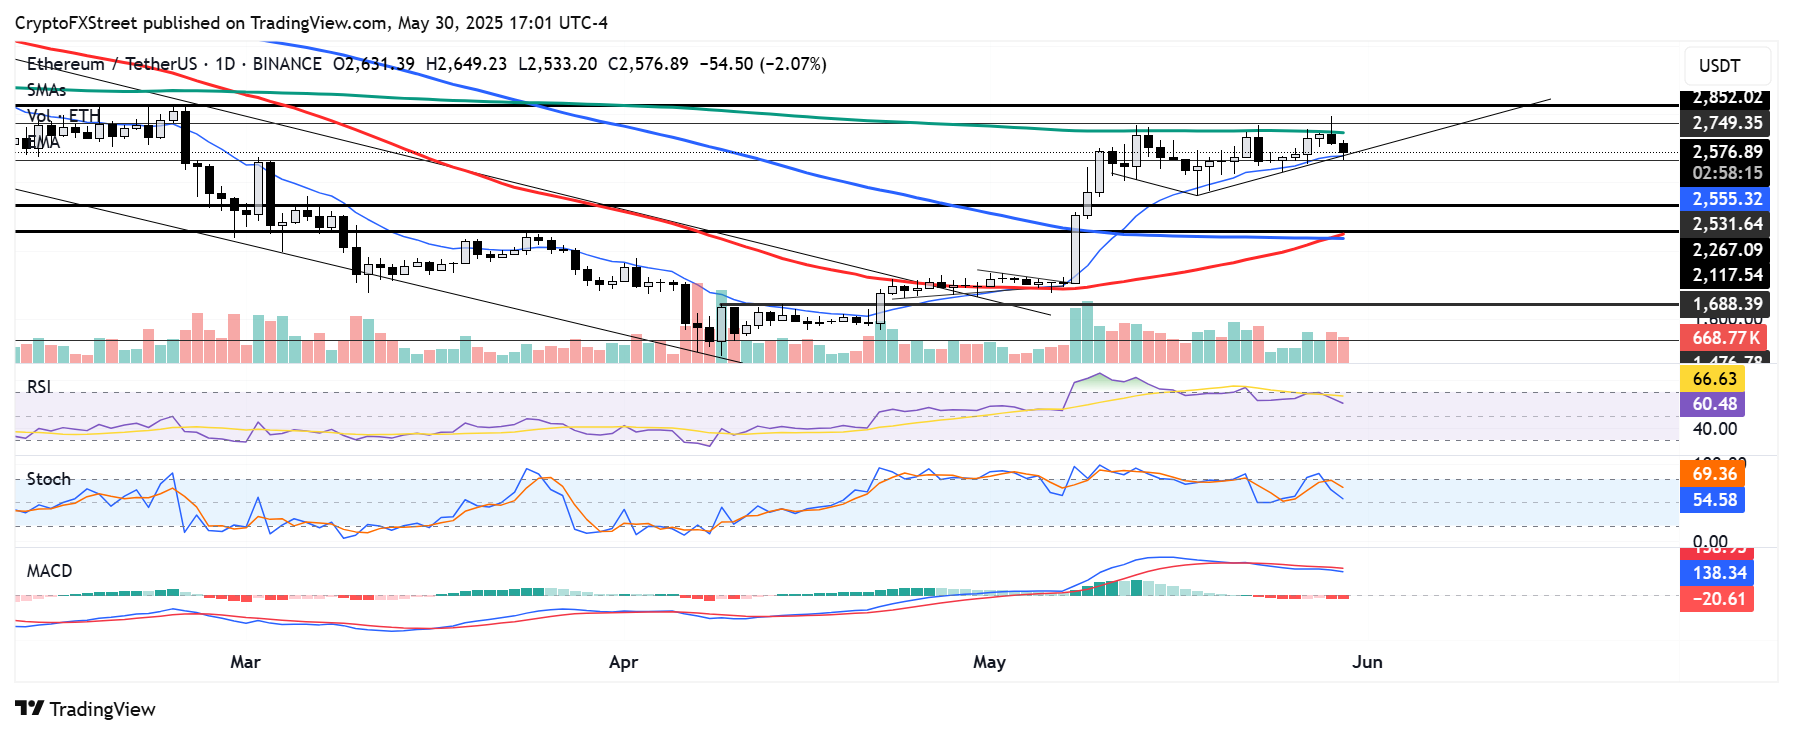
ETH/USDT daily chart
If ETH sustains a daily close below the triangle and loses the $2,500 level, it could stretch its decline to test the support range between $2,260 and $2,100. The support range is strengthened by a golden cross of the 50-day Simple Moving Average (SMA) above the 100-day SMA right below it.
On the upside, ETH must hold the support of the ascending triangle and sustain a firm MOVE above the $2,850 resistance to resume its uptrend.
The Relative Strength Index (RSI) and Stochastic Oscillator (Stoch) are above their neutral levels but trending downwards below their respective moving averages, indicating weakening bullish momentum.
