Solana (SOL) Eyes $383–561 Surge in Long-Term Elliott Wave Forecast

Solana’s price action is setting up for a potential mega-rally—if the Elliott Wave theorists are right. Here’s why traders are watching those key levels.
The Setup: Waves Pointing Up
SOL’s chart could be tracing a textbook bullish pattern, with the $383–561 zone acting as the next major magnet. Forget fundamentals—this is pure Fibonacci-fueled hopium.
Wall Street Meets Crypto Voodoo
Elliott Wave analysis—beloved by crypto traders and mocked by traditional finance—suggests SOL’s current consolidation is just a pit stop before liftoff. Then again, hedge funds still use tarot cards (sorry, ’technical models’) to predict oil prices.
The Trade: High Risk, Higher Reward?
Break past resistance, and the $561 target becomes plausible. Fail, and it’s another ’sorry bagholders’ tweetstorm. Either way—grab popcorn.
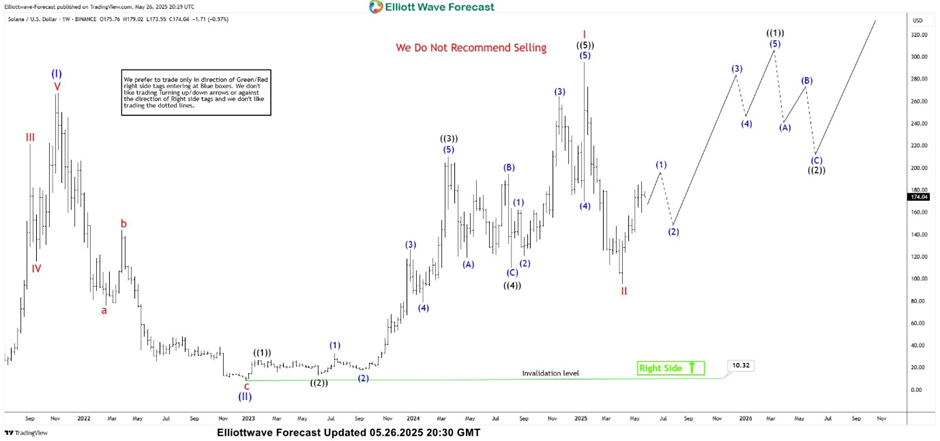
Solana (SOL) weekly Elliott Wave view
Solana weekly chart below suggests cycle from all time low ended at 267.52 on 8 November 2021. This was followed by a 3 waves pull back which ended in December 2022 around $10 mark. Rally then resumed again and SOL crypto went on to make a new high above November 2021 peak to create an incomplete bullish sequence. Rally from December 2022 low was impulsive with an extended wave (( 3 )) and ended in January 2025 at $295.31.
We then saw a sharp correction to $95.31 which ended on April 7, 2025. cryptocurrency has been rallying since April 7, 2025 low and is currently trading at $175.04. As far as January 2025 high remains intact, there is possibility of a double three correction lower before the rally resumes. However, we can see 5 waves up from April 7, 2025 low which supports the idea that low should hold for at least 1 more leg higher.
January 2025 high needs to break to confirm that next leg in the form of wave III of ( III) is in progress. Ideal targets for wave III of ( III) WOULD be $383 – $561 area which is 100 – 161.8 Fibonacci extension area of wave I related to wave II.
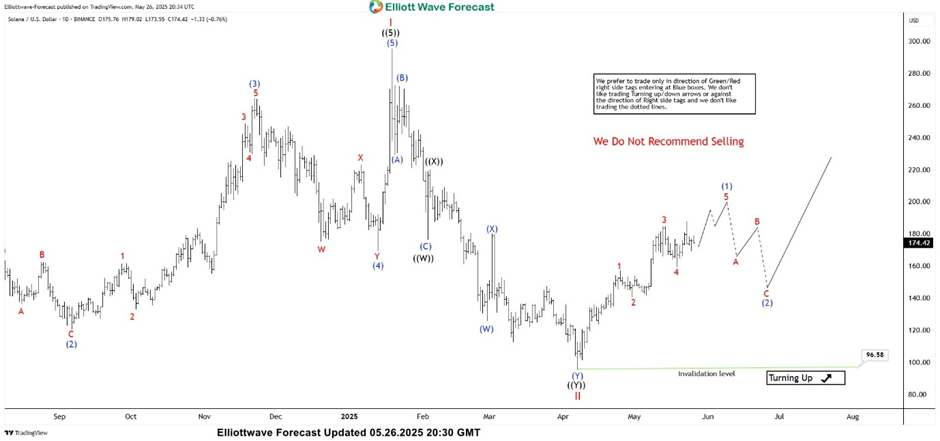
Solana (SOL) daily Elliott Wave view
Solana daily chart below shows rally from April 7, 2025 ($96.58) is already showing 5 waves up. However, while below wave 4 low, we can see further extension in wave 5. As dips hold above $96.58, expect the rally to continue for a new high above January 2025 peak or one more leg higher at least.