PancakeSwap Rockets to 60-Day High as Tokenomics 3.0 Burn Plan Ignites Rally

Defi’s favorite breakfast-flavored DEX just got leaner—and traders are feasting. PancakeSwap’s governance-approved ’Tokenomics 3.0’ slashes token supply, sending CAKE prices sizzling to levels not seen since March.
The upgrade—passed by voters who probably didn’t read the 37-page proposal—demonstrates crypto’s enduring love for artificial scarcity. Because nothing fixes a token’s woes like forcibly removing chunks of it from existence.
While the protocol celebrates its deflationary makeover, skeptics whisper about how this ’supply shock’ differs from last quarter’s ’supply adjustment’ and next month’s ’supply recalibration.’ Some things never change—except the circulating supply, apparently.
Tokenomics 3.0 boosts permanent token burn to 5.3 million CAKE per year
PancakeSwap revival comes into effect with the discussions of tokenomics 3.0 on April 8. As the implementation started on April 23, the platform unlocks all CAKE and veCAKE tokens while retiring the veCAKE and gauges voting.
In the first implementation phase, the daily emissions decreased to 20K CAKE from 29K CAKE as the ecosystem growth fund allocation was cut in half to nearly 3,250 CAKE per day from 6,500 CAKE, with the rest ending in the burn mechanism.
With phase 2 coming into effect this week, the daily emissions drop to 14,500 CAKE, further reducing the CAKE supply in circulation and a permanent burn of 5.3 million CAKE per year.
Hence, despite the unlocking of staked CAKE and veCAKE, the increased burning and lowered daily emissions help sustain the growth in spot prices.
Cake targets a triangle breakout run to $3.57
From a technical perspective, PancakeSwap teases a bullish engulfing candle on the daily chart and challenges the $2.77 supply zone, a crucial resistance that has resulted in multiple breakout failures in the first quarter.
Recent price action forms an ascending triangle pattern with a rising trendline formed by the April 7, May 5, and May 19 lows, and the upper boundary coincides with the $2.77 zone.
Tuesday’s jump revives the breakout chances. The 50-day (yellow) and 200-day (blue) Exponential Moving Averages (EMAs) signal a golden cross, reflecting the short-term price movement undermining the longer term price action.
Additionally, the Moving Average Convergence/Divergence (MACD) crosses above its signal line, signaling a positive crossover after a short-term volatile phase. The Relative Strength Index (RSI) at 67 spikes towards the overbought territory, suggesting a bullish momentum boost. Since February, the RSI has failed to decisively enter the overbought region as the CAKE spot price failed to overcome $2.77. A surge above 70 will increase the breakout chances at the risk of overbought conditions.
This key $2.77 level also coincides with the 50% Fibonacci level retraced from the December 8 high of $4.185 to the February 7 low at $1.354. A potential breakout could face further resistance at $3.57, aligning with the 78.6% Fibonacci level.
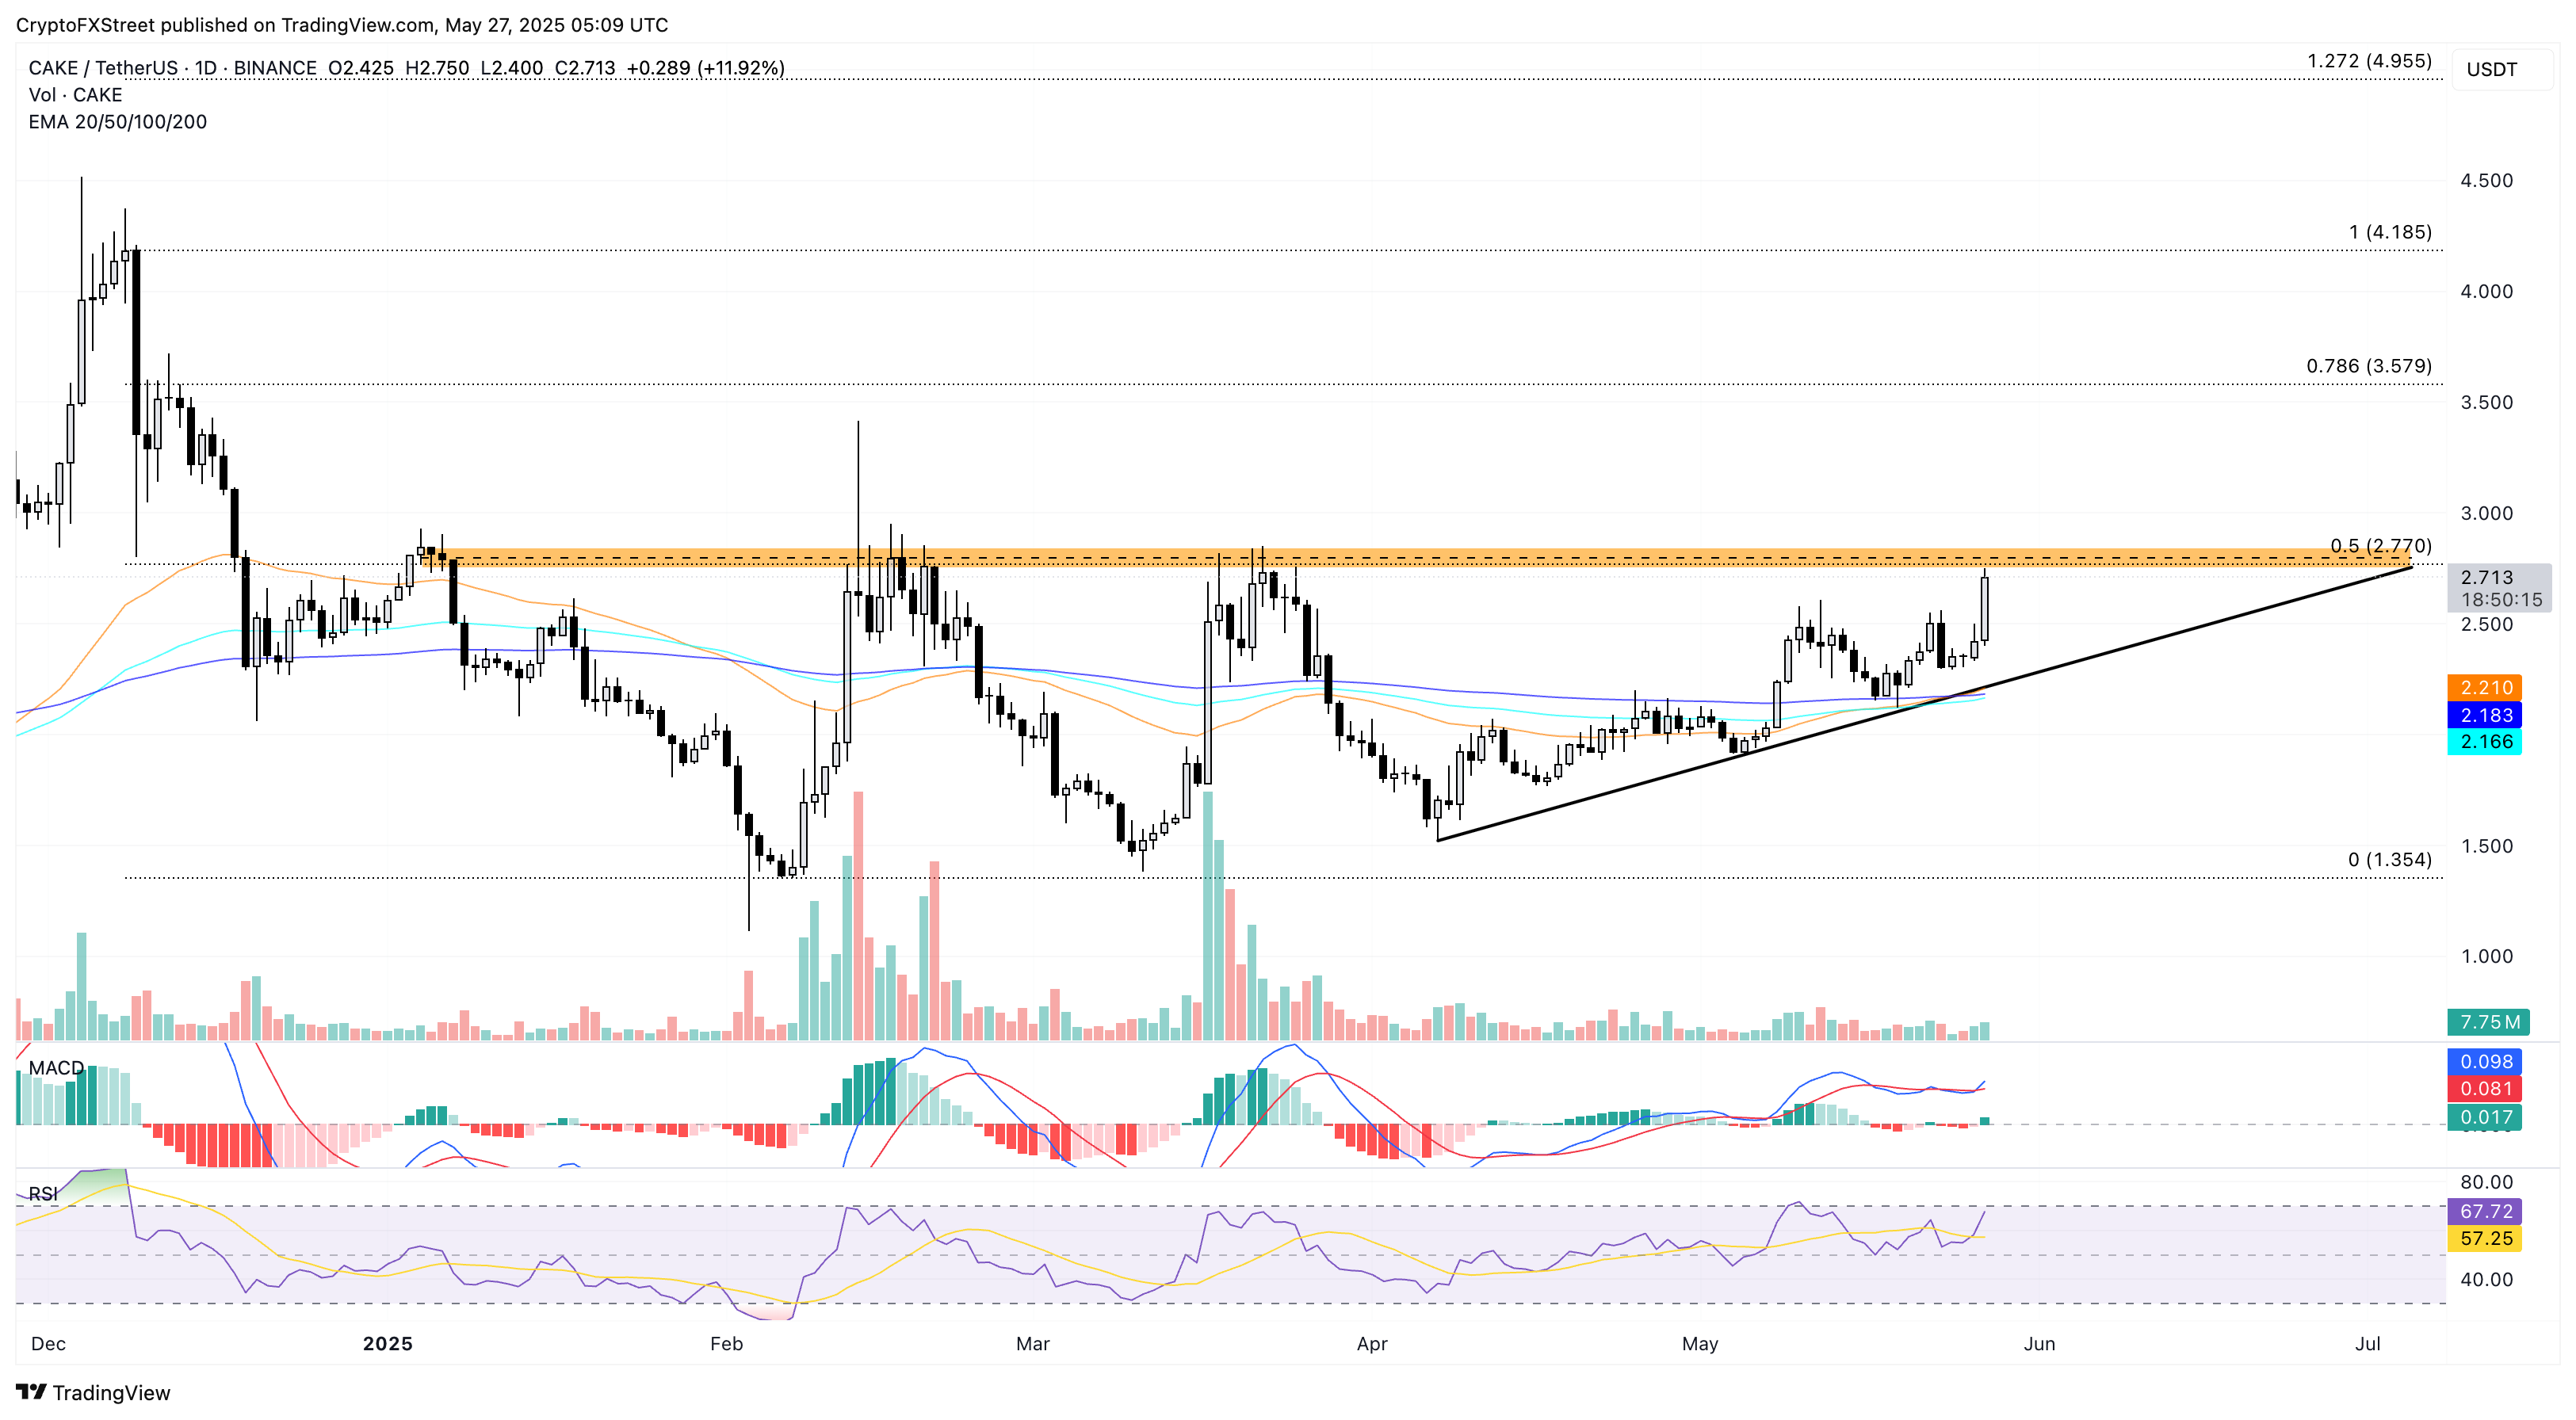
CAKE/USDT daily price chart. Source: Tradingview
Conversely, a reversal from the upper ceiling could retest the rising trendline NEAR the 200-day EMA at $2.183.
Derivatives support breakout rally
Amid the positive technical outlook, Coinglass derivatives data showcase rising traders’ interest in CAKE. The open interest (OI) is up by 50% in the last 24 hours, reaching $68.42 million alongside the OI-weighted at 0.0038%, reflecting the traders’ growing bullish intent.
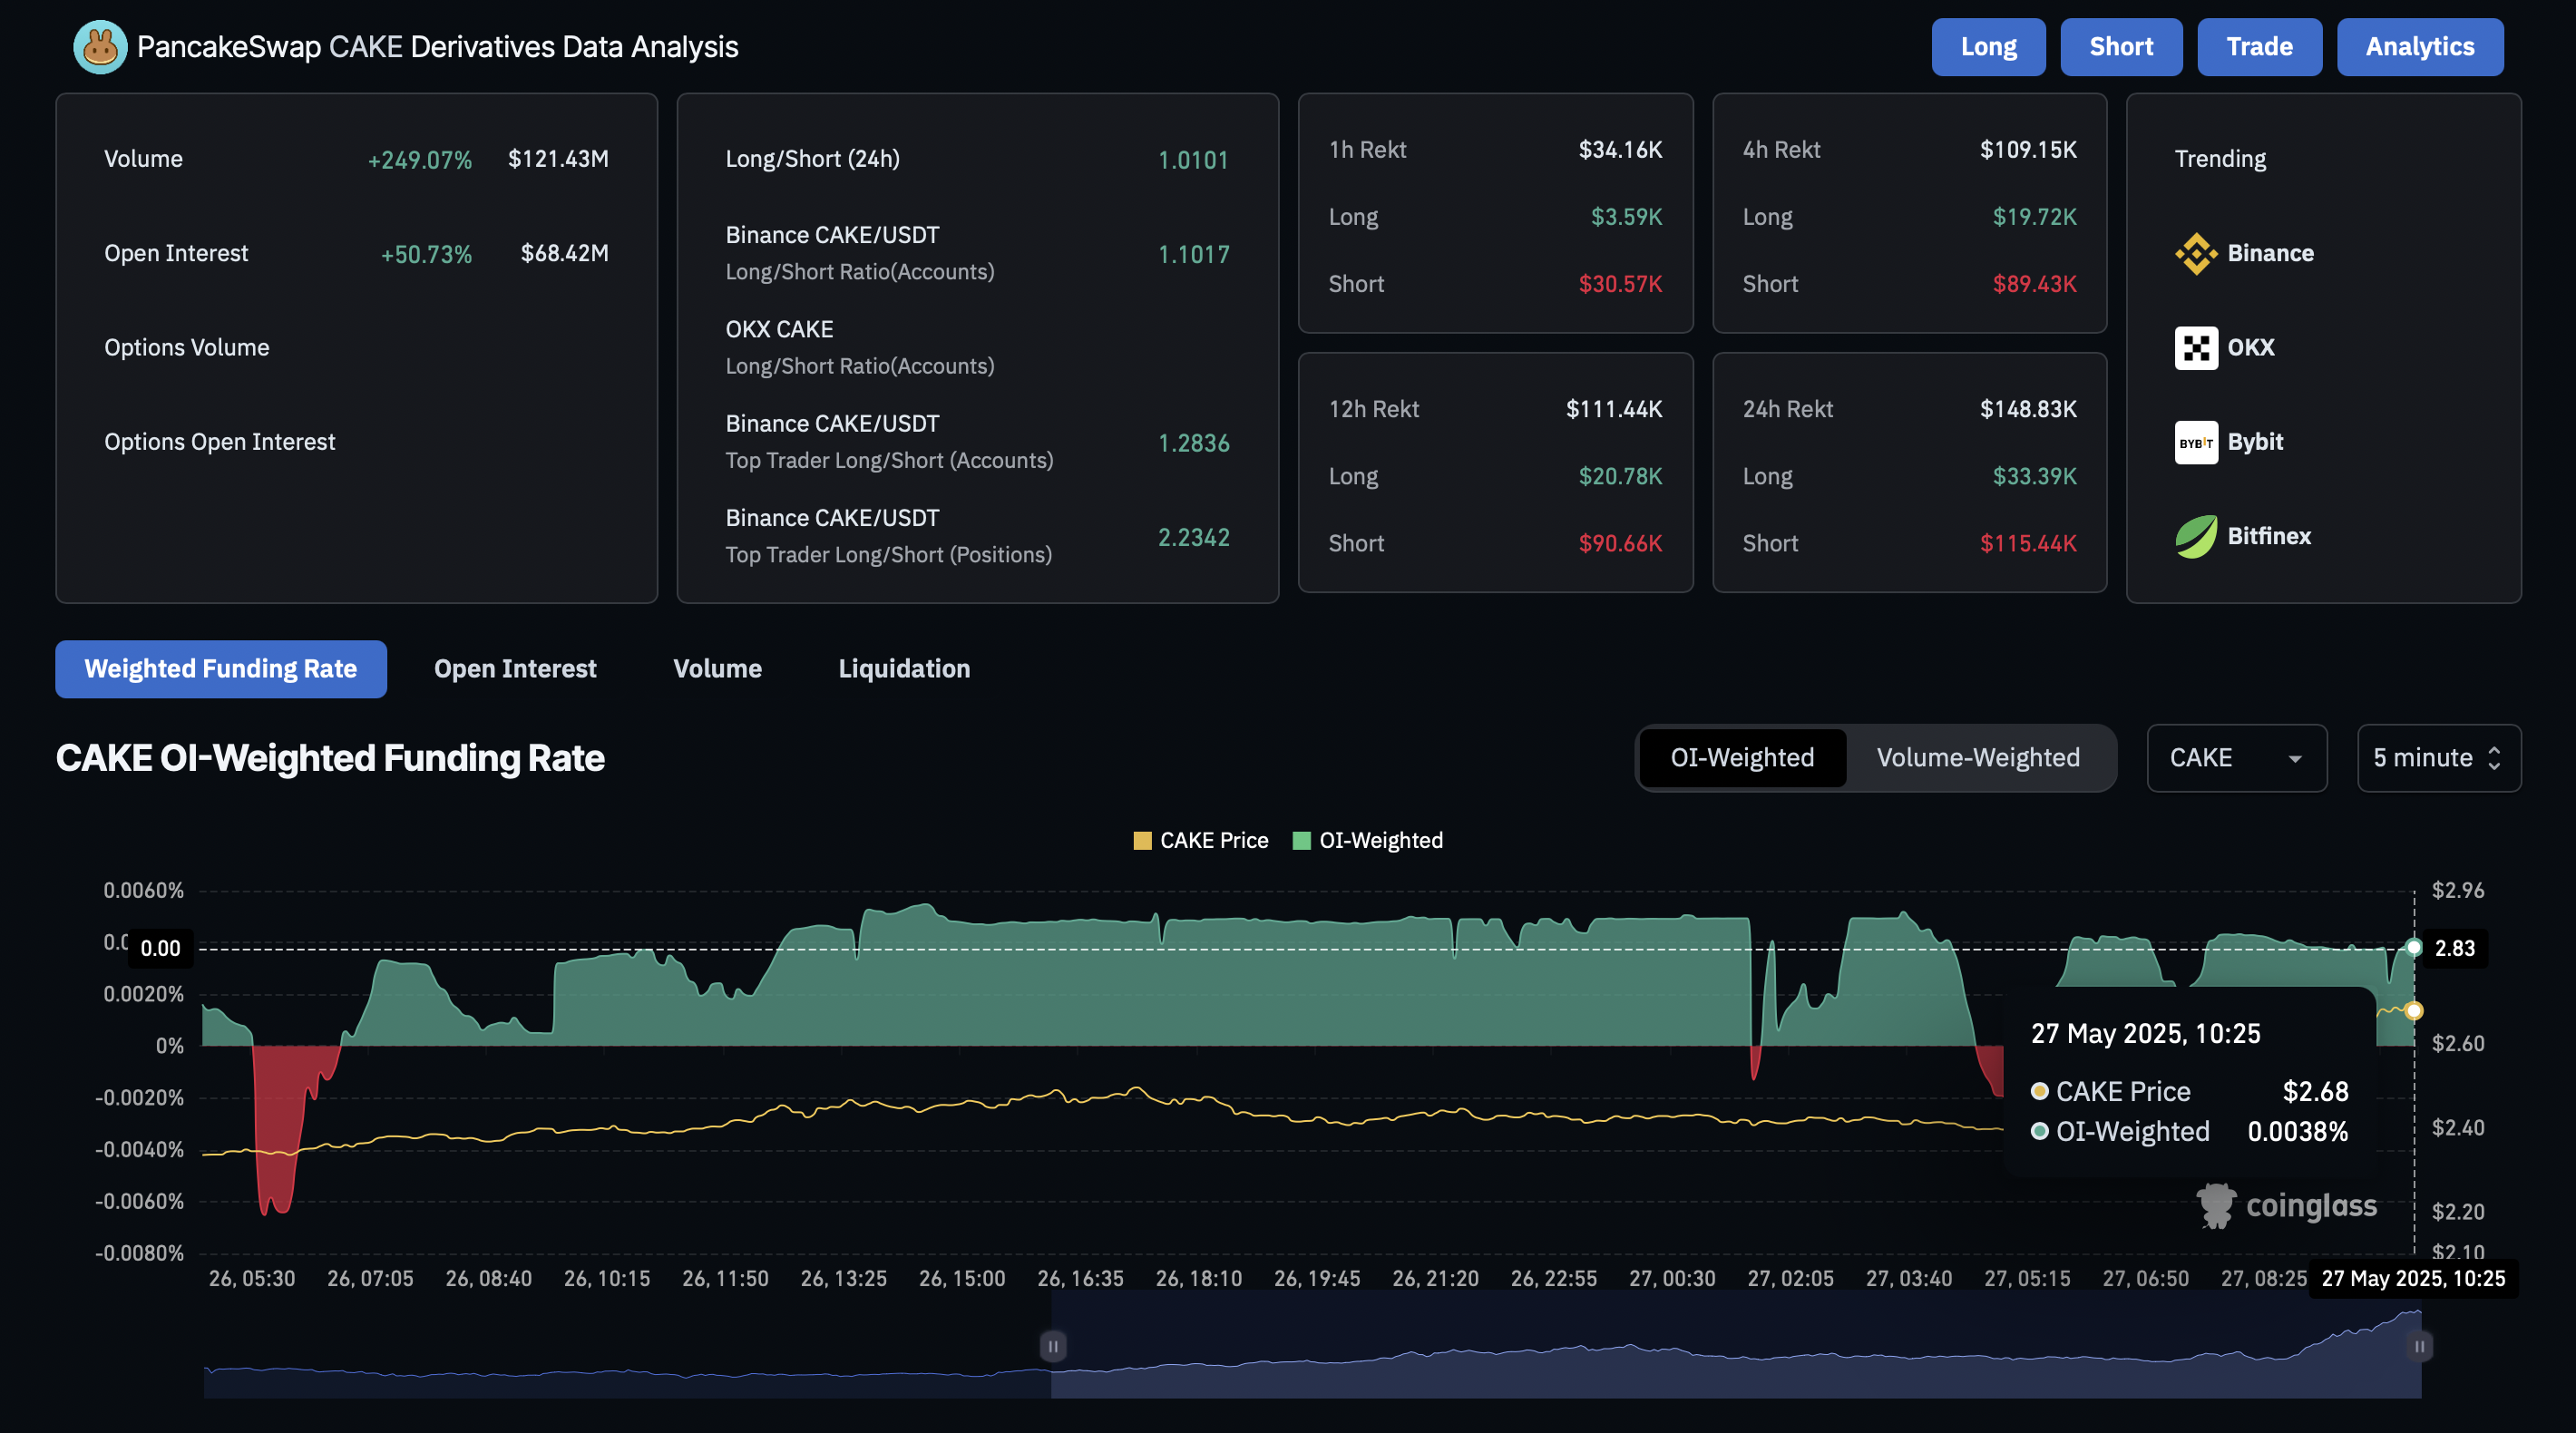
CAKE derivatives data. Source: Coinglass.
Additionally, the 24-hour liquidation data shows that $115K worth of bearish positions have been wiped out compared to $33K in long liquidation, suggesting a bullish narrative.

Log in to Reply
Log in to comment your thoughtsComments
Related Articles
|Square
Get the BTCC app to start your crypto journey
Get started today Scan to join our 100M+ users