Ethereum Bulls Charge Back: ETH Reclaims $2,500 Amid Surging Demand

Ethereum shakes off bearish pressure as buyers swarm back—propelling ETH past the critical $2,500 psychological barrier. Here’s why traders aren’t surprised (and why Wall Street still doesn’t get it).
The Rebound Playbook: After weeks of sideways action, ETH’s breakout signals renewed institutional interest—or maybe just degens front-running the next ETF rumor. Either way, the charts don’t lie.
Liquidity Games: With shorts getting squeezed above $2,450, the path of least resistance points north. CEX data shows spot buying volumes spiking 37% since yesterday—because nothing fuels FOMO like round-number milestones.
Macro Paradox: Traditional investors keep waiting for ’regulation clarity’ while crypto natives stack ETH at these ’discount’ levels. Spoiler: the smart money already moved.
As ETH tests its 200-day MA, one thing’s clear: the market’s pricing in more than just technicals. Layer 2 adoption? Staking yields? Or just traders bored of watching BTC dominate? Either way—welcome back to volatility season. (Just don’t tell the SEC).
Ethereum price today: $2,580
- Ethereum exchange supply plunged to its lowest since August 2024, indicating dominant bullish momentum.
- Whales continue their buying pressure, expanding their balance by over 670K ETH in the past nine days.
- ETH continues consolidating near the $2,500 key level amid a lack of directional bias.
Ethereum (ETH) saw a 2% gain in the early Asian session on Thursday, recovering the $2,500 key level after whales stepped on the gas with their buying pressure.
Ethereum supply on exchanges shrinks following whale demand
Ethereum’s supply on exchanges extended its decline to 18.73 million ETH on Wednesday, indicating sustained spot market buying pressure. Since the metric began a downtrend on April 24, more than 1 million ETH have left exchanges to private wallets for potential long-term holding. As a result, ETH’s supply on exchanges has reached its lowest level since August 2024.
The reduced exchange supply partly explains why ETH’s price has maintained an upward trajectory since the same date.
-1747882240100.png)
ETH Exchange Reserve. Source: CryptoQuant
Similar to previous weeks, whales with a balance of 10K-100K continued leading the buying activity, growing their holdings by a net of 670K ETH in the past nine days. However, smaller holders have been distributing, with their total balance declining by 110K ETH during the same period.
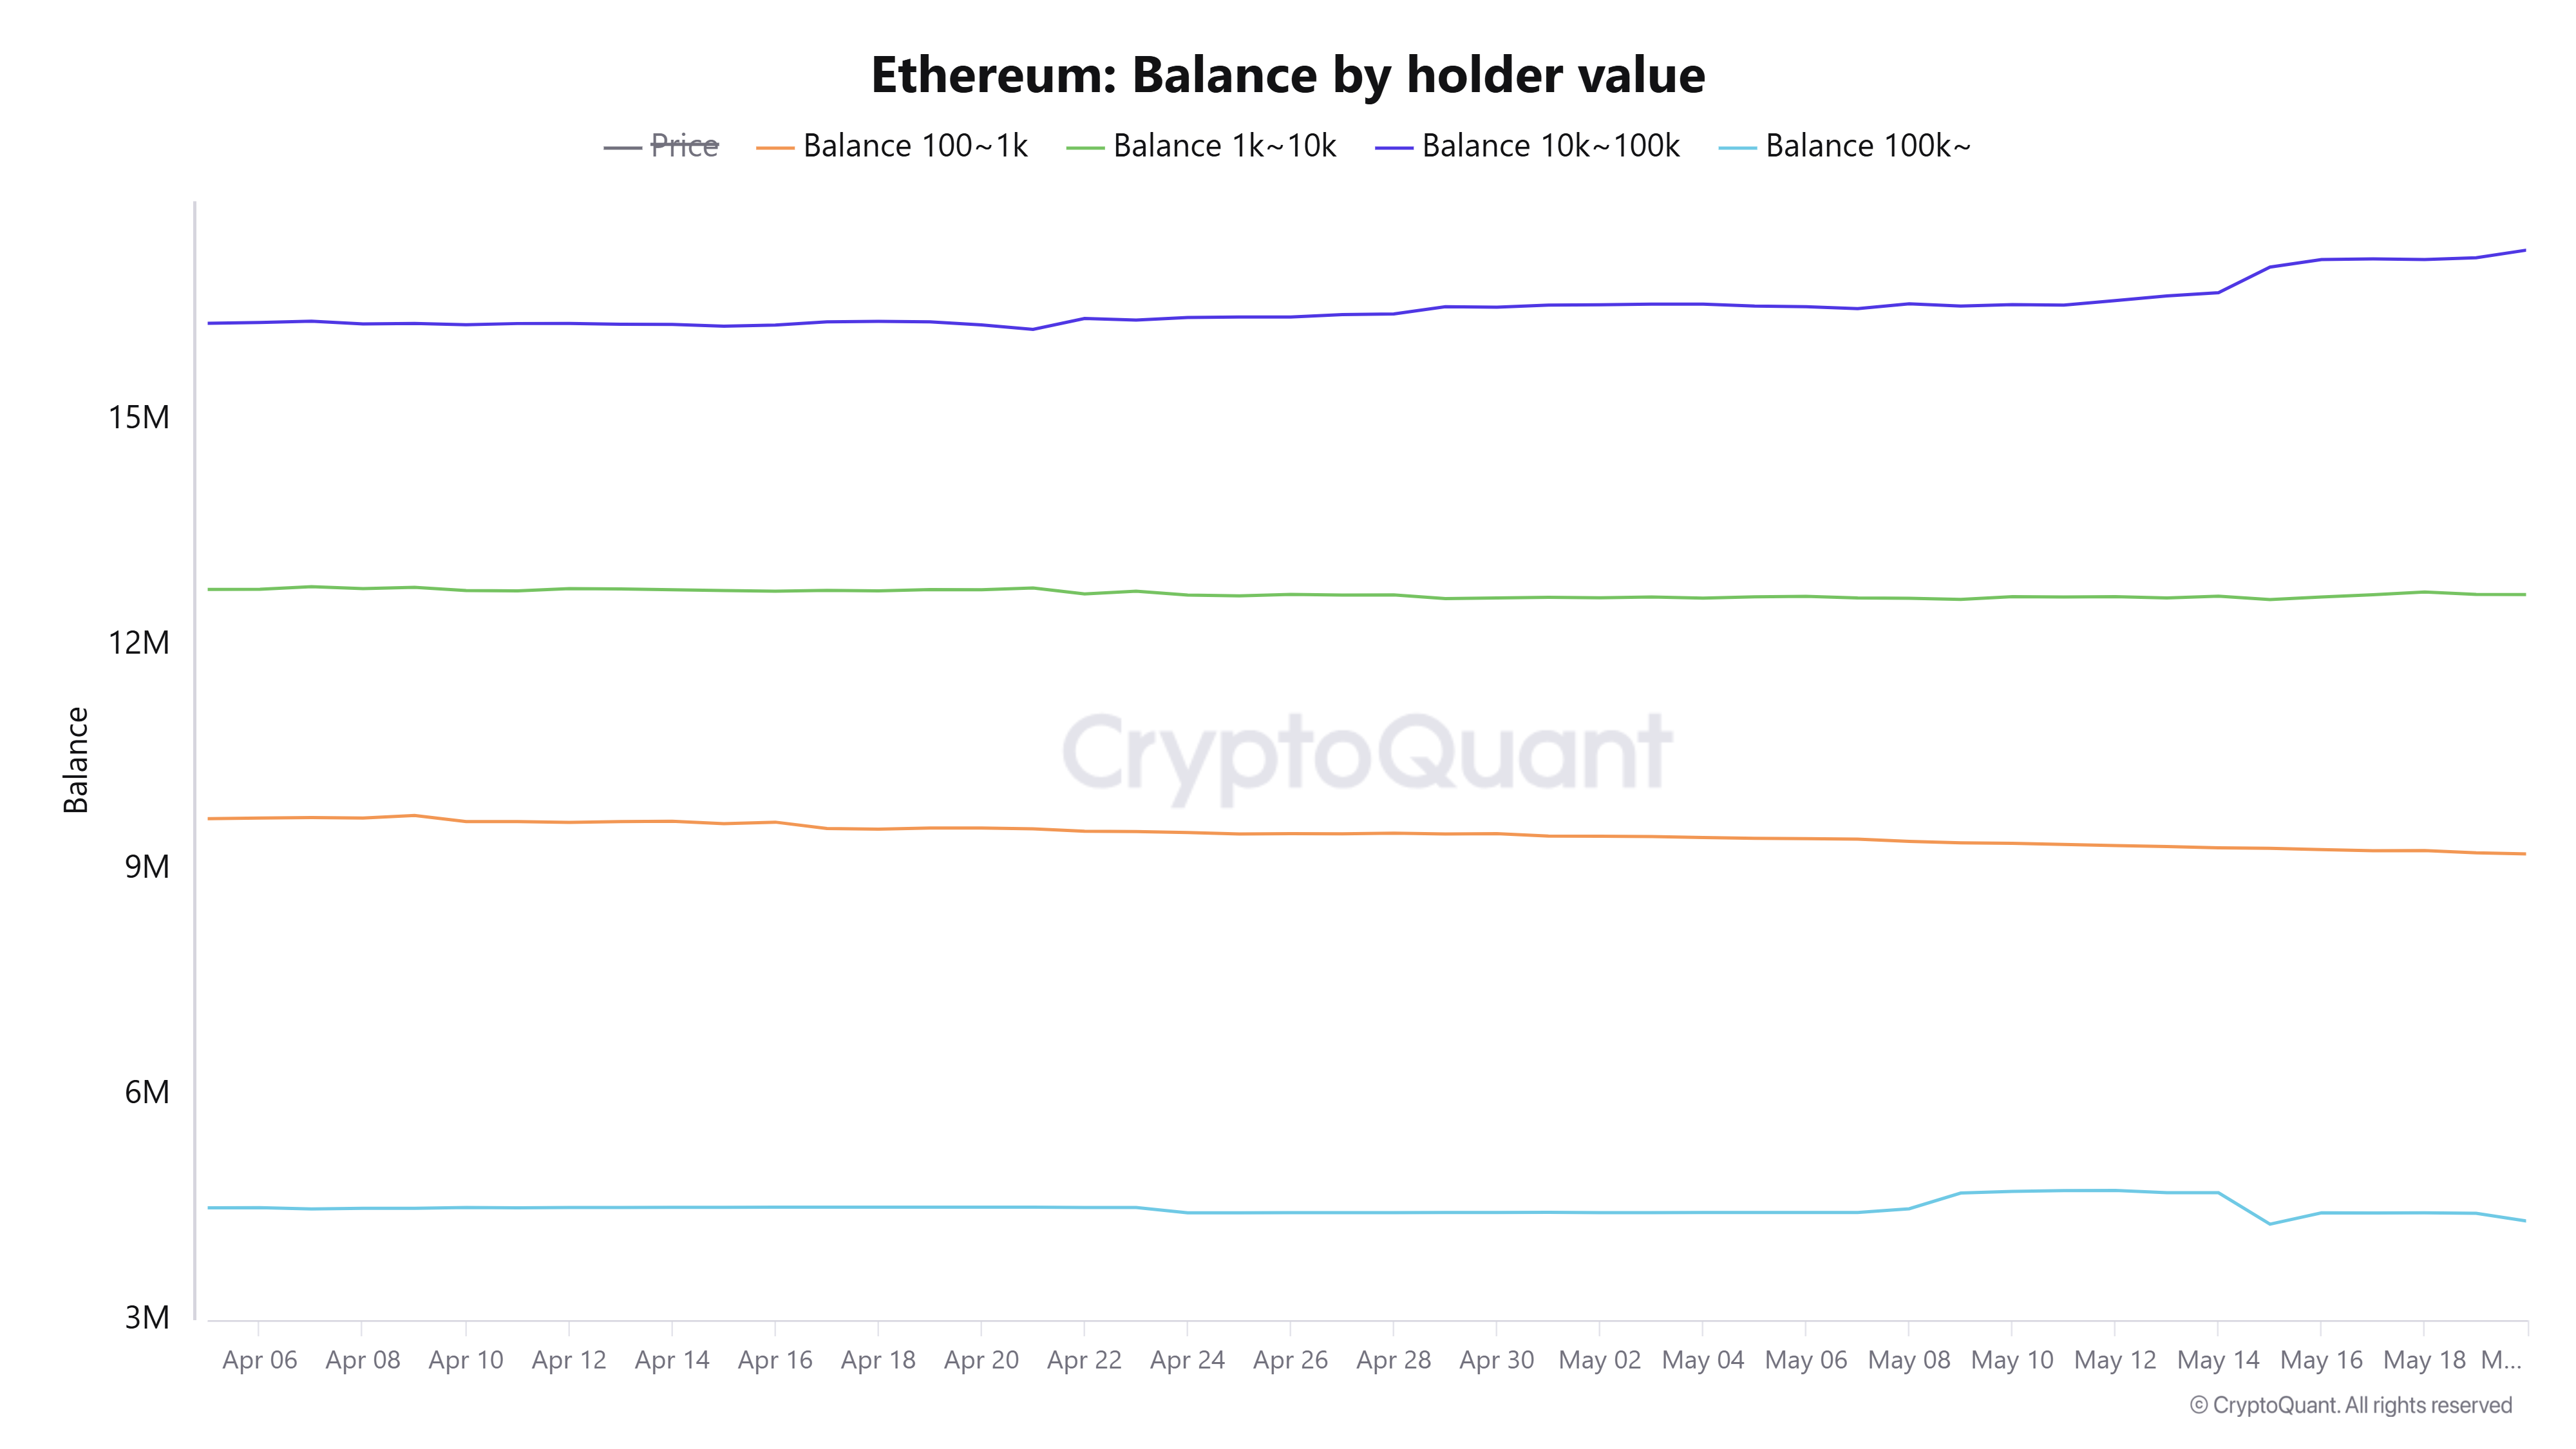
ETH Balance by Holder Value. Source: CryptoQuant
Despite dominant spot buying pressure, ETH continues to move range-bound NEAR the $2,500 mark. ETH Futures Bubble Maps show increased trading volume whenever prices move below or above $2,500, making it a critical level that could define the top altcoin’s next major trend.
-1747882311891.png)
ETH Futures Volume Bubble Map. Source: CryptoQuant
Meanwhile, search interest for ethereum has picked up pace again near the 60-point mark, up from 45 on May 17 but down from the 100-point level seen during the May 8 - 9 rally. This indicates that intense retail excitement isn’t leading ETH’s price, leaving room for a more robust price growth.
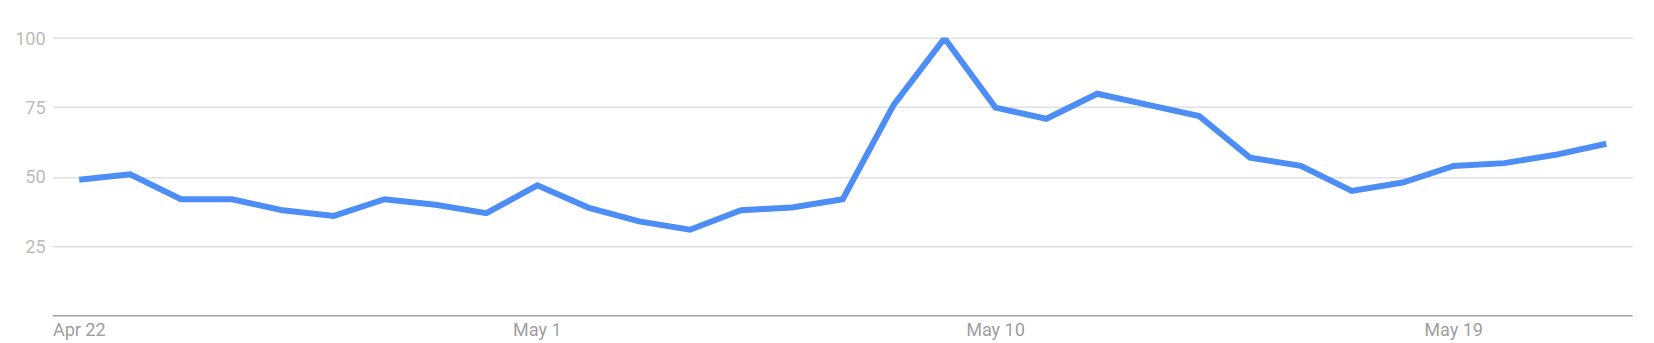
ETH Search Interest. Source: Google Trends
Ethereum Price Forecast: ETH awaits catalyst amid lack of directional bias
Ethereum experienced $106.52 million in futures liquidations in the past 24 hours, per Coinglass data. The total amount of liquidated long and short positions is $56.20 million and $50.32 million, respectively.
After closing near $2,500 on Tuesday, ETH briefly surged above $2,600 on Wednesday but saw a rejection just below the 200-day Simple Moving Average (SMA). The top altcoin is up 2% at the time of writing as bulls look to maintain a firm MOVE above the $2,500 level.
ETH needs a high volume move above the $2,850 resistance or below the $2,260 - $2,100 range to establish its next direction. A move above $2,850 could see ETH rally toward the $3,250 resistance, while a breakdown below $2,100 could send its price to the $1,688 support.
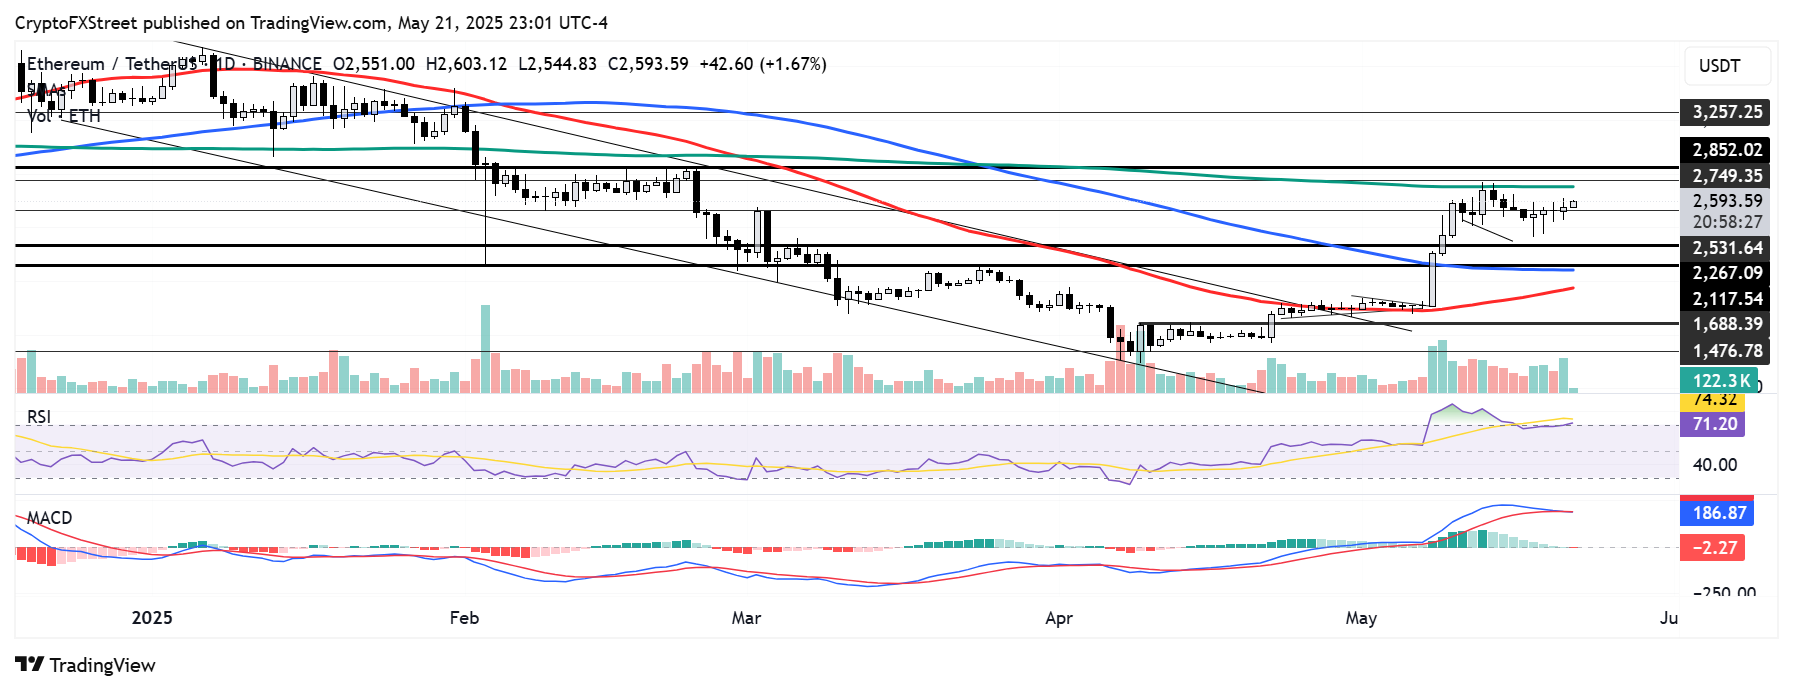
ETH/USDT daily chart
The Relative Strength Index (RSI) continued its horizontal trend near the overbought region line, indicating slight weakness in the bullish momentum. Meanwhile, the Moving Average Convergence Divergence (MACD) is testing its moving average line as its histogram bars are about to flip negative. A successful cross below will signal rising downward pressure.
