Dogwifhat Joins Meme Coin Frenzy—Analysts Eye 75% Surge to $1.74
Another day, another meme coin defies gravity. Dogwifhat (WIF) rockets alongside its speculative peers, flirting with a $1.74 target—a 75% moonshot that’d make even degen traders blink.
Pump-first fundamentals? Check. Zero utility? Obviously. But who needs balance sheets when you’ve got vibes and a chart that only goes up? Just don’t mention the last guys left holding the bag.
Dogwifhat rally surges past key $1.00 mark
The dogwifhat derivatives market highlights renewed interest in the meme coin, as Open Interest increases by over 10% in the past 24 hours to approximately $408 million, according to CoinGlass data.
OI represents the number of outstanding contracts that have not been settled, such as futures and options. Increase in OI alongside trading volume, as seen with WIF’s NEAR 10% surge to $1.73 billion, hints at growth in trader interest, influx of fresh money and heightened participation.

Dogwifhat derivatives data | Source: Coinglass
The surge in short position liquidations to $1.44 million compared to longs at approximately $996,000 over the past 24 hours signals intense market volatility, with bearish traders facing heavier losses as WIF’s price soars past $1.00.
This imbalance, combined with rising OI and trading volume, underscores growing bullish sentiment and potential for further upside.
Dogwifhat confirms bull flag pattern breakout
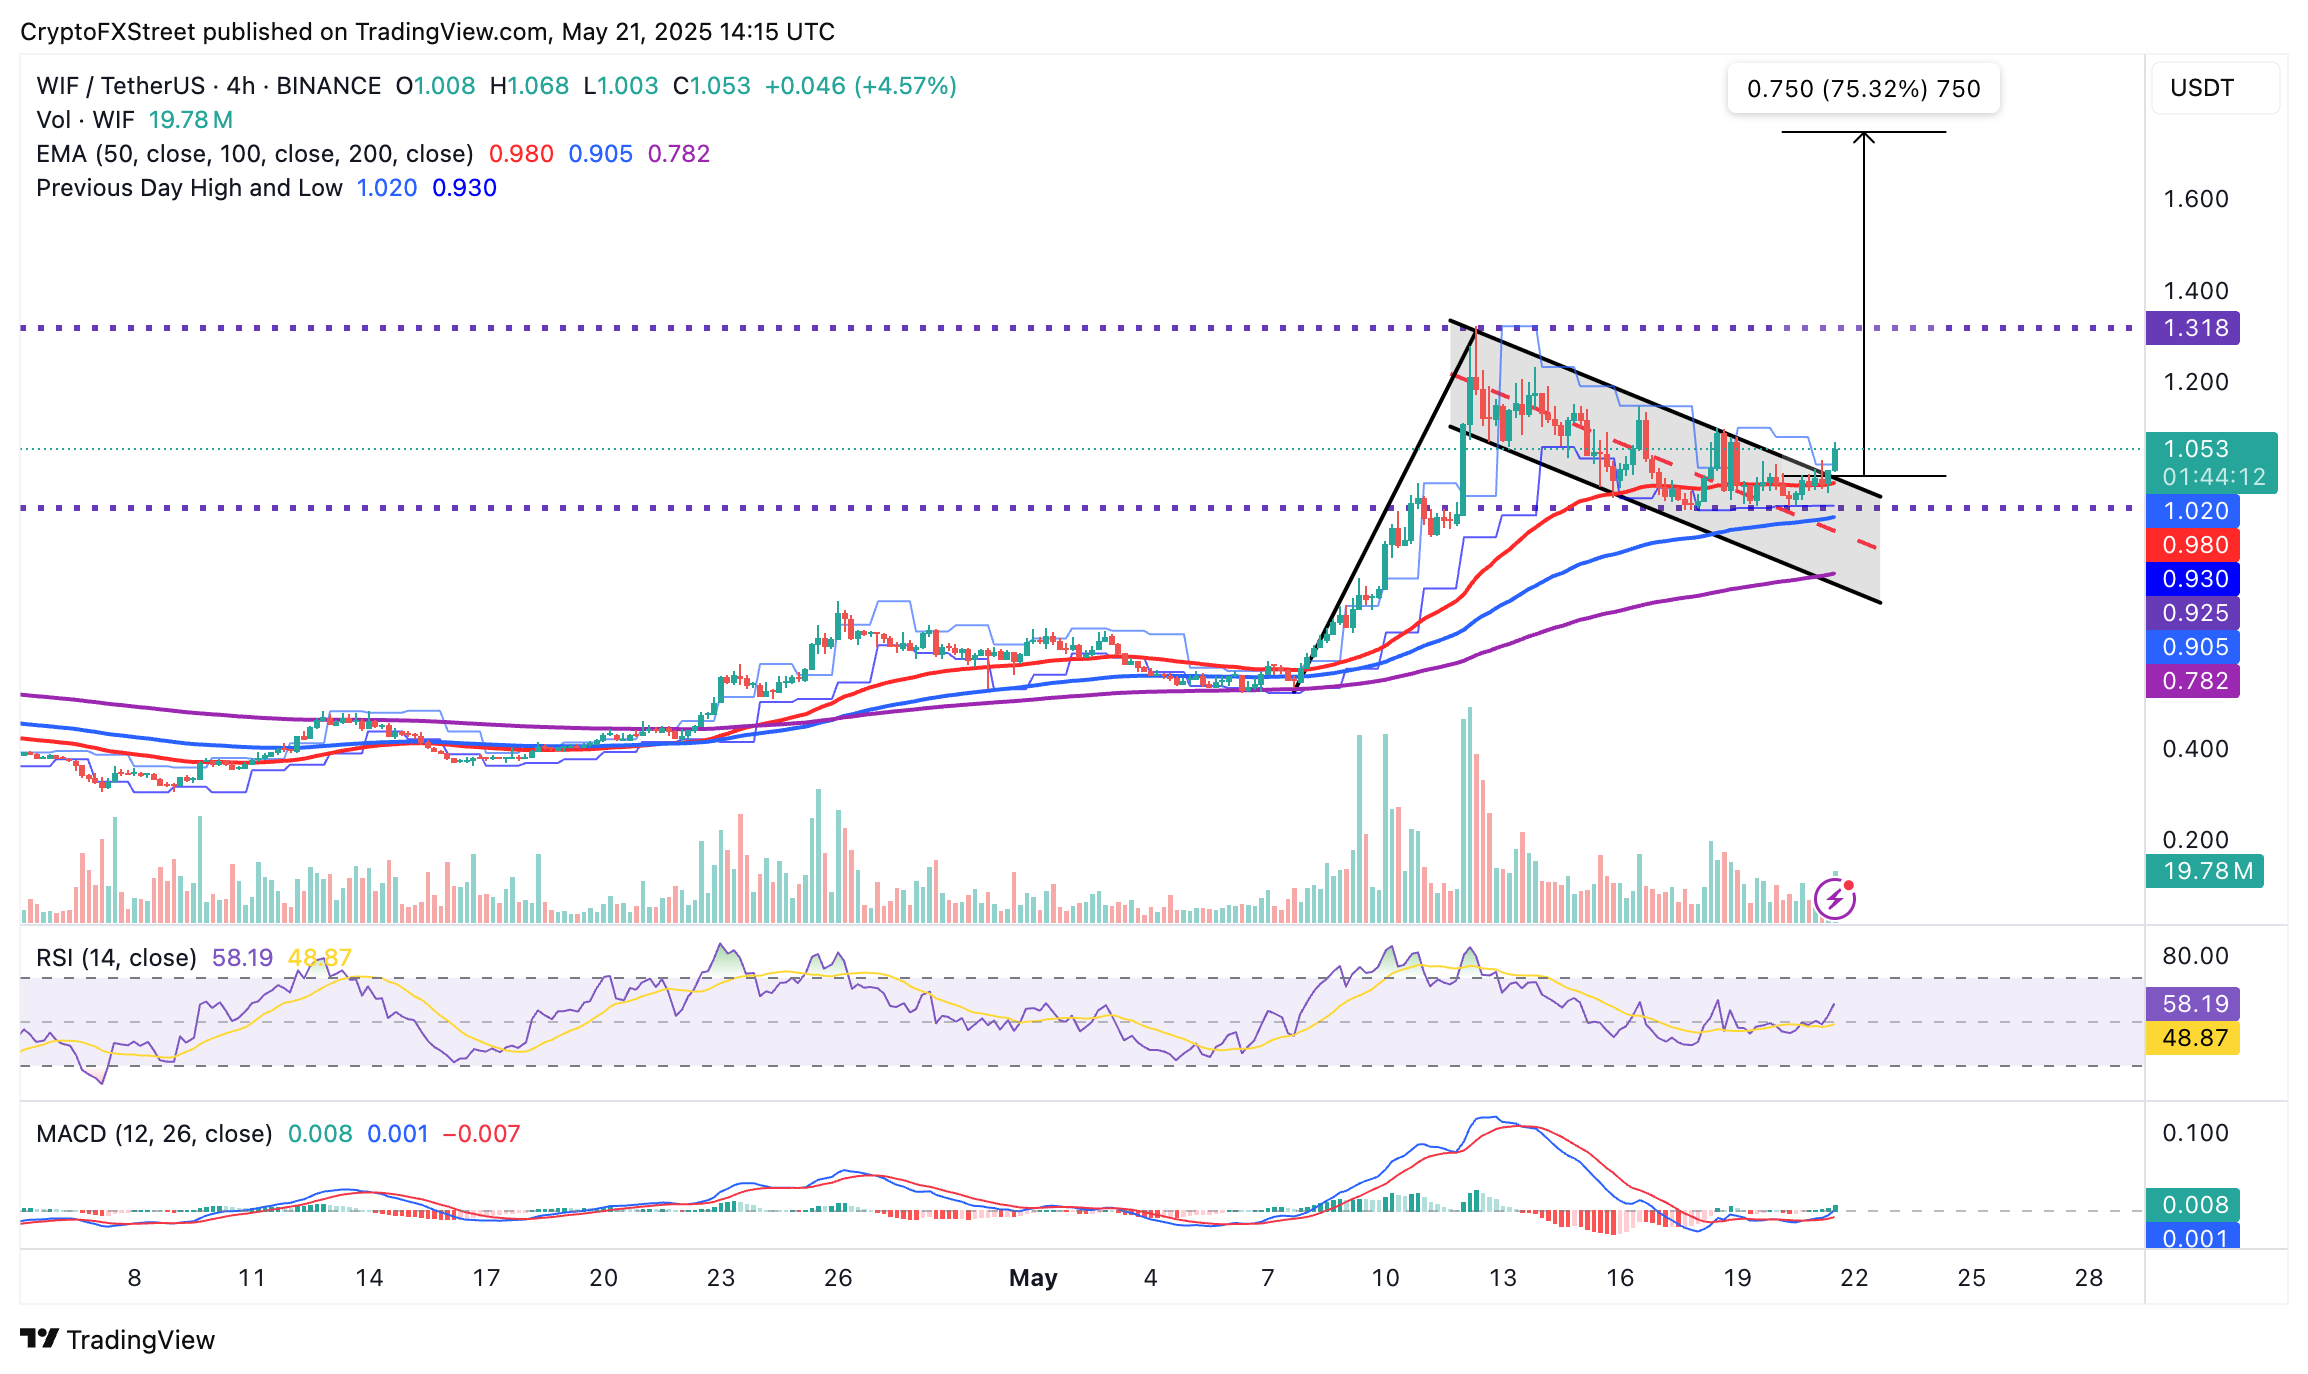
Dogwifhat’s price hovers slightly above $1.00 at the time of writing, buoyed by a recent break above the bull flag pattern illustrated on the four-hour chart below. The breakout comes after WIF tested support at $0.92, slightly below its current short-term support offered by the 50-day Exponential Moving Average (EMA) at around $0.98.
A bull flag is a bullish continuation pattern that typically forms after a sharp upward price movement, represented by the ‘flagpole’ followed by a consolidation period highlighted by the “flag.”
The 75% breakout target to $1.74 is calculated by measuring half the height of the flagpole and extrapolating that distance upward from the breakout point.

WIF/USDT 4-hour chart
Meanwhile, the Relative Strength Index (RSI) indicator at 58 hints at room for upside growth; however, if it approaches 70, traders must be cautious of overbought conditions, which are often a precursor to trend reversals.
The Moving Average Convergence Divergence (MACD) indicator’s bullish crossover supports the strong tailwind on Dogwifhat. The expanding green histogram bars above the centre line reinforce the bullish momentum.
Still, traders should monitor the RSI for potential overbought conditions and the MACD indicator for a plausible bearish crossover likely to signal a trend reversal or even consolidation due to the likelihood of profit taking and bullish exhaustion.
Cryptocurrency metrics FAQs
What is circulating supply?
The developer or creator of each cryptocurrency decides on the total number of tokens that can be minted or issued. Only a certain number of these assets can be minted by mining, staking or other mechanisms. This is defined by the algorithm of the underlying blockchain technology. On the other hand, circulating supply can also be decreased via actions such as burning tokens, or mistakenly sending assets to addresses of other incompatible blockchains.
What is market capitalization?
Market capitalization is the result of multiplying the circulating supply of a certain asset by the asset’s current market value.
What is trading volume?
Trading volume refers to the total number of tokens for a specific asset that has been transacted or exchanged between buyers and sellers within set trading hours, for example, 24 hours. It is used to gauge market sentiment, this metric combines all volumes on centralized exchanges and decentralized exchanges. Increasing trading volume often denotes the demand for a certain asset as more people are buying and selling the cryptocurrency.
What is the funding rate?
Funding rates are a concept designed to encourage traders to take positions and ensure perpetual contract prices match spot markets. It defines a mechanism by exchanges to ensure that future prices and index prices periodic payments regularly converge. When the funding rate is positive, the price of the perpetual contract is higher than the mark price. This means traders who are bullish and have opened long positions pay traders who are in short positions. On the other hand, a negative funding rate means perpetual prices are below the mark price, and hence traders with short positions pay traders who have opened long positions.

