Solana Price Alert: SOL Shows Bearish Fractals—20% Drop Incoming?

Solana’s charts flash red as key support levels crumble—traders brace for potential double-digit losses. The ’Ethereum killer’ suddenly looks mortal.
Technical indicators scream sell: descending triangle pattern confirms, RSI dips below 40, and spot volumes dry up. Meanwhile, Bitcoin maximalists dust off their ’I told you so’ memes.
Last week’s bullish momentum? Gone faster than a VC’s promises during a bear market. The 30-day correlation coefficient with BTC now at 0.89—when Bitcoin sneezes, SOL gets pneumonia.
Silver lining? Solana’s 500 TPS throughput still hums along... not that it matters when traders panic-sell during Fed Chair testimony. Watch the $120 level—break that, and we’re testing December lows. As always in crypto: fundamentals are for losers until suddenly they’re not.
Solana shows a bearish bias in momentum indicators
Solana price faced rejection around the $184.13 daily resistance level on May 14 and declined nearly 10% until Saturday. However, it recovered slightly the next day after finding support around its 200-day EMA at $162.42. This level roughly coincides with the daily support at $160 and the ascending trendline (drawn by joining multiple low levels since April 7), and a breakdown indicates a bearish trend. At the time of writing on Monday, it trades down at around $165.40, approaching its critical support zone.
If SOL continues its correction and closes below $160 on a daily basis, it could extend the decline by 14.6% from its current levels to retest its May 6 low of $141.41.
The Relative Strength Index (RSI) on the daily chart reads 54, pointing toward its neutral level of 50, indicating fading bullish momentum. If the RSI moves below its neutral level of 50, it would give rise to strong bearish momentum and a sharp fall in solana prices. The Moving Average Convergence Divergence (MACD) indicator is also switching to a bearish crossover on the daily chart. If the crossover occurs, it would confirm another sell signal.
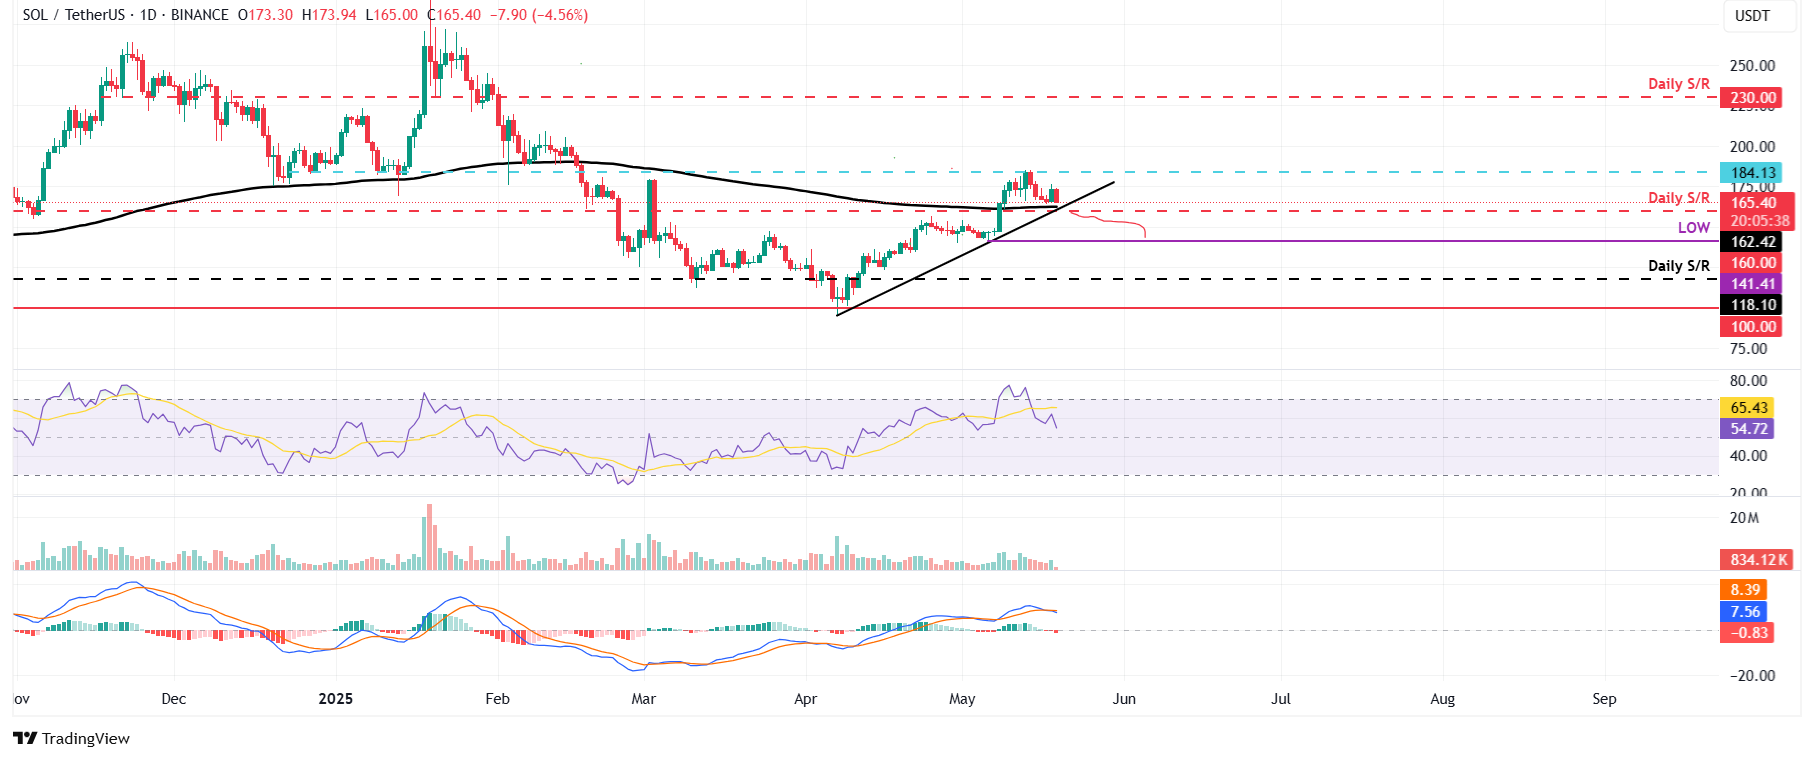
SOL/USDT daily chart
Another sign of a bearish outlook. According to Coinglass’s data, SOL’s long-to-short ratio reads 0.85, the lowest level over a month. This ratio below one reflects bearish sentiment in the markets as more traders are betting on Solana’s price to fall.
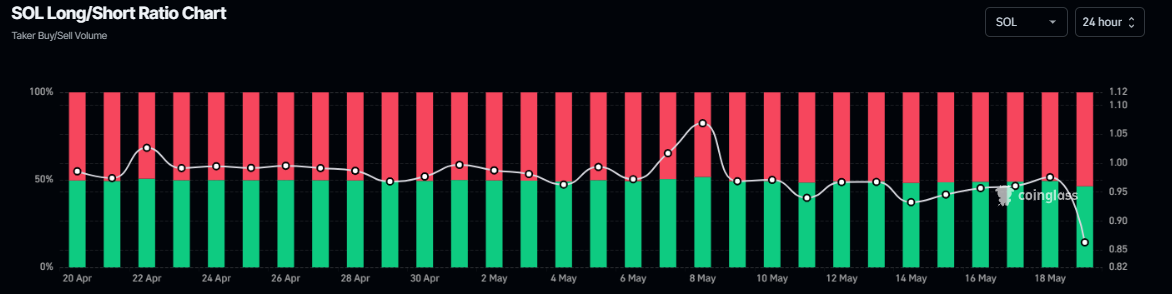
Solana Long-to-short ratio chart. Source: Coinglass
However, if SOL finds support around the daily level at $160 and recovers, it could extend the recovery toward the next daily resistance at $184.13.
