Crypto Bulls Charge: Bitcoin Eyes $105K Breakout as Ethereum Holds Line and XRP Aims for $3

Bitcoin’s chart flashes a megaphone pattern—classic bull signal—as institutional money floods in faster than a hedge fund manager chasing performance fees. The $105K target now looks conservative.
Ethereum clings to its 200-day moving average like a lifeline. Lose this level, and the ’ultrasound money’ narrative starts sounding tinny. Hold it? ETH 2.0 stakers might finally get their champagne moment.
XRP’s grinding recovery hits overdrive—if it clears the $1.50 wall, $3 becomes plausible. Just don’t mention the SEC case unless you enjoy watching traders’ eye twitches.
Meanwhile, traditional finance bros still think ’stablecoins’ are diet cola brands. Their loss.
Bitcoin’s key resistance at $105,000 may decide the next move
Bitcoin faced resistance at around $105,000 on Sunday, declining by 2% until the next day. However, BTC recovers slightly on Tuesday and retests the $105,000 level. At the time of writing on Wednesday, it trades down to around $103,600.
If BTC continues its pullback, it could extend the decline to retest the psychological support level at $100,000.
The Relative Strength Index (RSI) on the daily chart reads 69, slipping below its overbought level of 70 and pointing downwards, indicating a weakening bullish momentum. If the RSI continues to decline and moves below the neutral level of 50, it would lead to a sharp fall in Bitcoin prices.
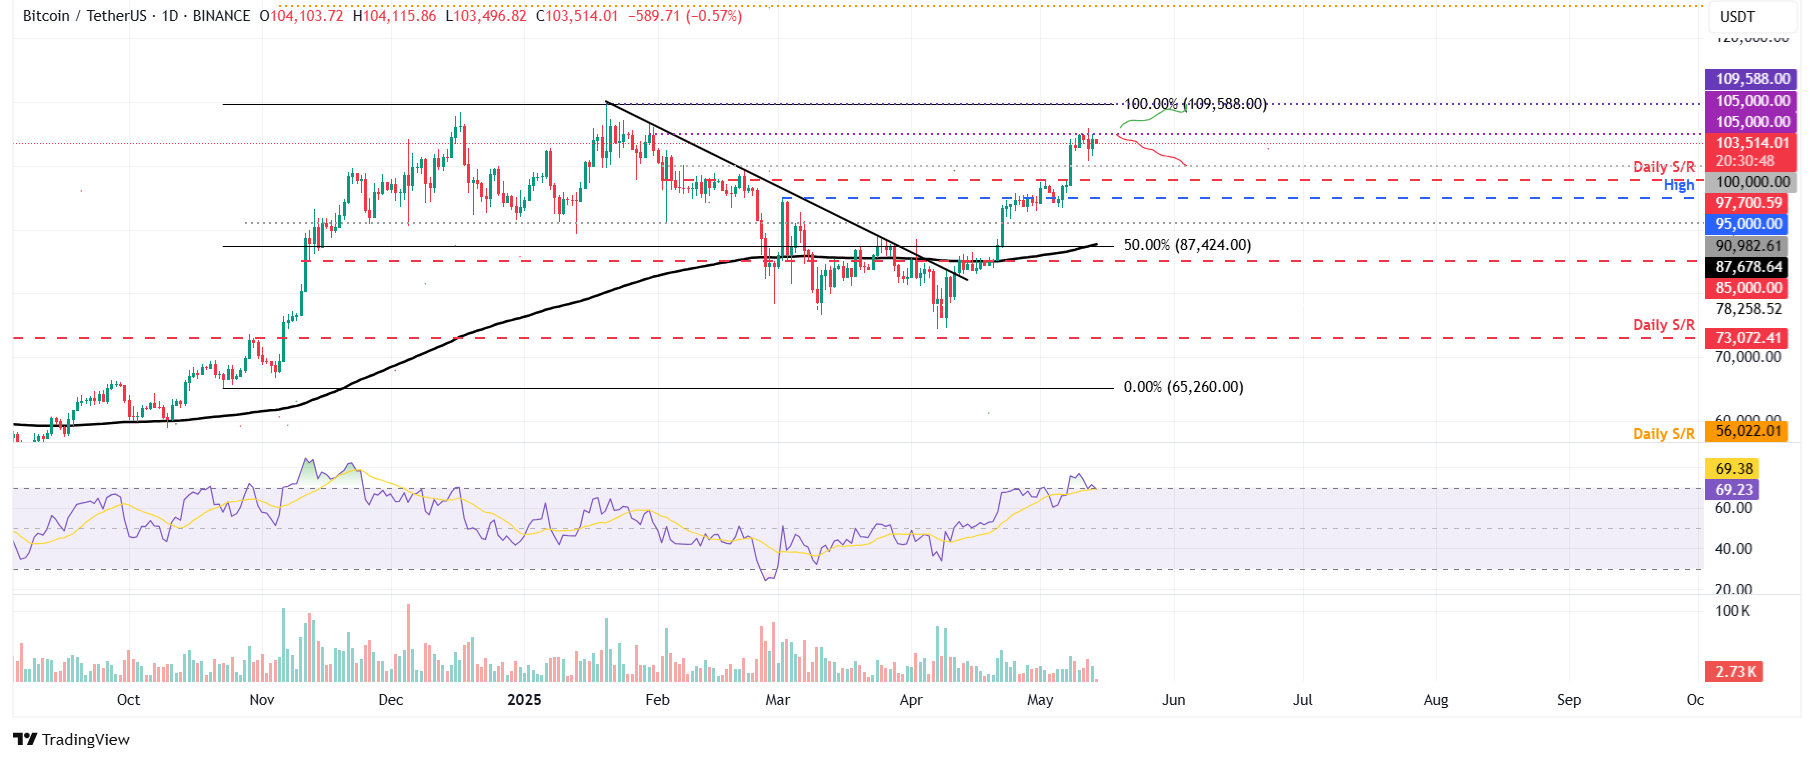
BTC/USDT daily chart
However, if BTC recovers and closes above the $105,000 resistance level, it could open the door for a rally toward the all-time high of $109,588 set on January 20.
Ethereum finds support around its 200-day EMA
Ethereum price retested and found support around its 200-day Exponential Moving Average (EMA) around $2,436 on Monday and rallied 7.38% the next day. At the time of writing on Wednesday, it hovers at around $2,640.
If the 200-day EMA at $2,436 continues to hold as support, it could extend the rally to retest its key psychological level at $3,000.
The RSI on the daily chart reads 78 above its overbought levels of 70, indicating strong bullish momentum. However, traders should be cautious as the chances of a pullback are high due to its overbought condition. Another possibility is that the RSI remains above its overbought level of 70 and continues its upward trend.
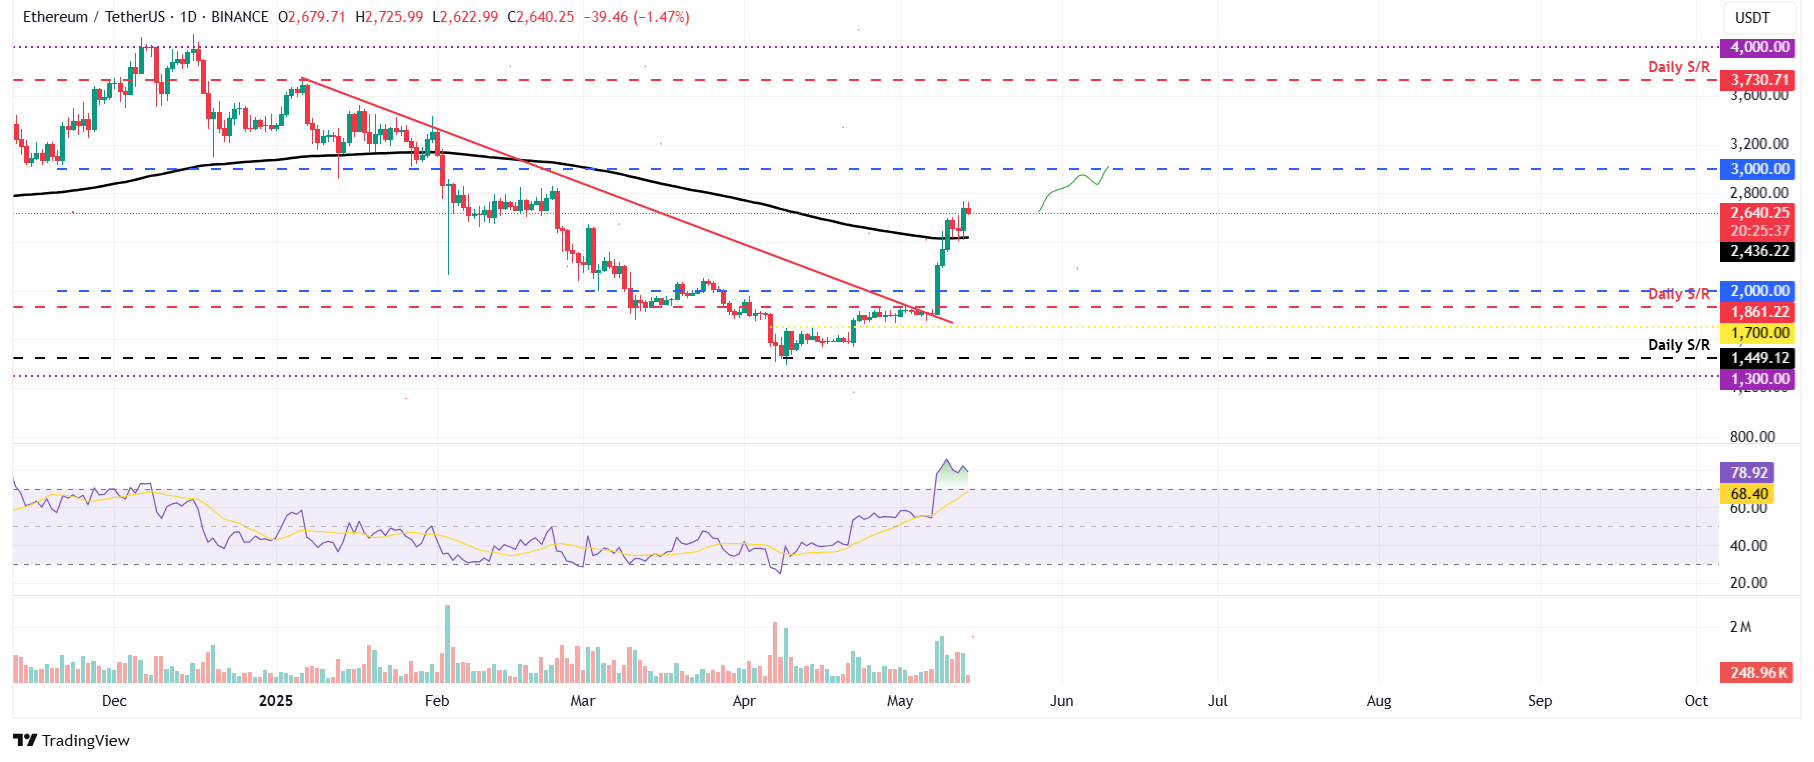
ETH/USDT daily chart
On the other hand, if ETH faces a pullback, it could find support around its 200-day EMA at around $2,436.
XRP bulls could rally if it closes above the $2.72 resistance
XRP price broke and closed above its 50-day EMA level at $2.26 on April 8 and rallied 21% until Tuesday. At the time of writing on Wednesday, it hovers at around $2.55.
If XRP continues its upward trend and closes above its daily resistance at $2.72, it could trigger a rally toward the psychological $3.00 barrier.
However, the RSI on the daily chart reads 66, rejecting from its overbought levels at 70 on Tuesday, indicating fading bullish momentum. The RSI must MOVE above its current levels for the bullish momentum to be sustained.
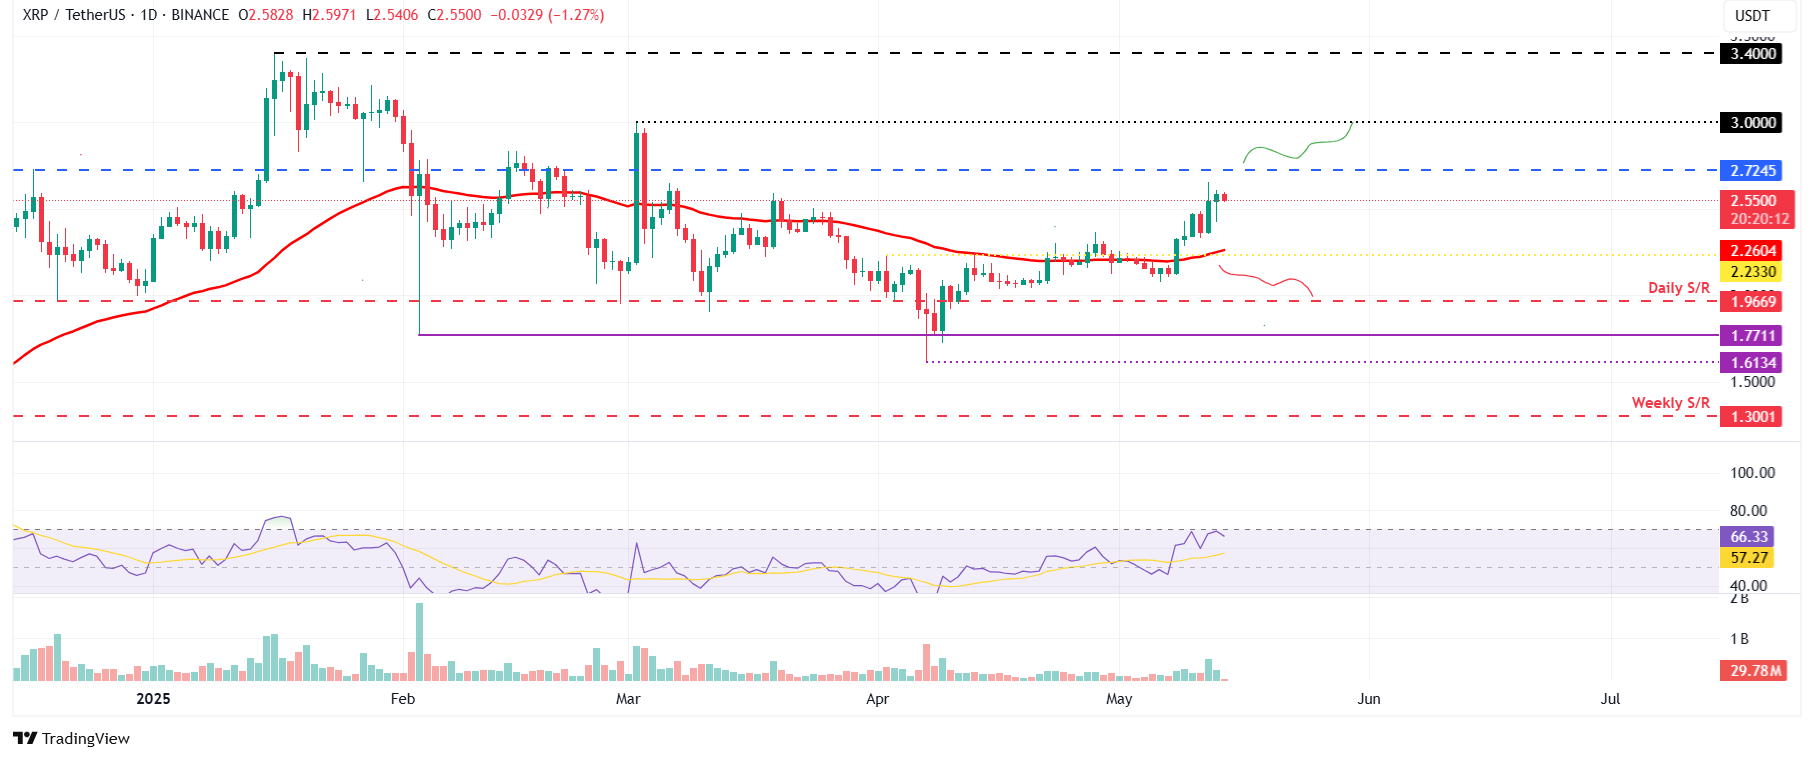
XRP/USDT daily chart
Conversely, if XRP faces a pullback, it could extend the correction toward its 50-day EMA at $2.26.
Cryptocurrency metrics FAQs
What is circulating supply?
The developer or creator of each cryptocurrency decides on the total number of tokens that can be minted or issued. Only a certain number of these assets can be minted by mining, staking or other mechanisms. This is defined by the algorithm of the underlying blockchain technology. On the other hand, circulating supply can also be decreased via actions such as burning tokens, or mistakenly sending assets to addresses of other incompatible blockchains.
What is market capitalization?
Market capitalization is the result of multiplying the circulating supply of a certain asset by the asset’s current market value.
What is trading volume?
Trading volume refers to the total number of tokens for a specific asset that has been transacted or exchanged between buyers and sellers within set trading hours, for example, 24 hours. It is used to gauge market sentiment, this metric combines all volumes on centralized exchanges and decentralized exchanges. Increasing trading volume often denotes the demand for a certain asset as more people are buying and selling the cryptocurrency.
What is the funding rate?
Funding rates are a concept designed to encourage traders to take positions and ensure perpetual contract prices match spot markets. It defines a mechanism by exchanges to ensure that future prices and index prices periodic payments regularly converge. When the funding rate is positive, the price of the perpetual contract is higher than the mark price. This means traders who are bullish and have opened long positions pay traders who are in short positions. On the other hand, a negative funding rate means perpetual prices are below the mark price, and hence traders with short positions pay traders who have opened long positions.

Log in to Reply
Log in to comment your thoughtsComments
Related Articles
|Square
Get the BTCC app to start your crypto journey
Get started today Scan to join our 100M+ users