Pi Network, KAS, PNUT Defy Market Gravity as Altcoins Rally on Risk-On Frenzy

Move over, blue chips—today’s action is in the altcoin trenches. Pi Network leads a ragtag squad of outperformers as traders ditch caution for moonshot bets.
The usual suspects (with a twist)
PI’s 24% surge smells like a classic ’buy the rumor’ play—mainnet hype meets FOMO. Meanwhile, KAS and PNUT ride coattails with double-digit gains, because nothing fuels crypto rallies like seeing your neighbor get rich faster.
Wall Street’s loss is crypto’s gain
With traditional markets choking on inflation data, degenerates—sorry, ’visionary investors’—are piling into high-beta alts. The irony? These same tokens would’ve been laughed out of a 2021 pitch meeting.
Memo to the ’smart money’: your hedge funds are bleeding while a token named after breakfast spreads 20x. The future’s unevenly distributed—and it’s wearing a degen ponzi disguise.
Pi Network’s price explodes as trader confidence soars
Pi Network’s price upholds a strong bullish momentum backed by a favourable macro environment and anticipation ahead of a major ecosystem announcement expected on May 14.
The token has, in the last 12 days, rallied 105% to trade at $1.26 at the time of writing. PI’s position above the 50- and 100 Exponential Moving Averages (EMAs) on the 12-hour chart implies that the uptrend could last longer than anticipated.
A buy signal from the Moving Average Convergence Divergence (MACD) indicator encourages traders to hold their positions. Moreover, the expanding green histograms above the centre line reveal growing bullish momentum for PI, likely to break the immediate resistance at $1.35 and extend the up leg to $1.80, a seller congestion level tested last in March.
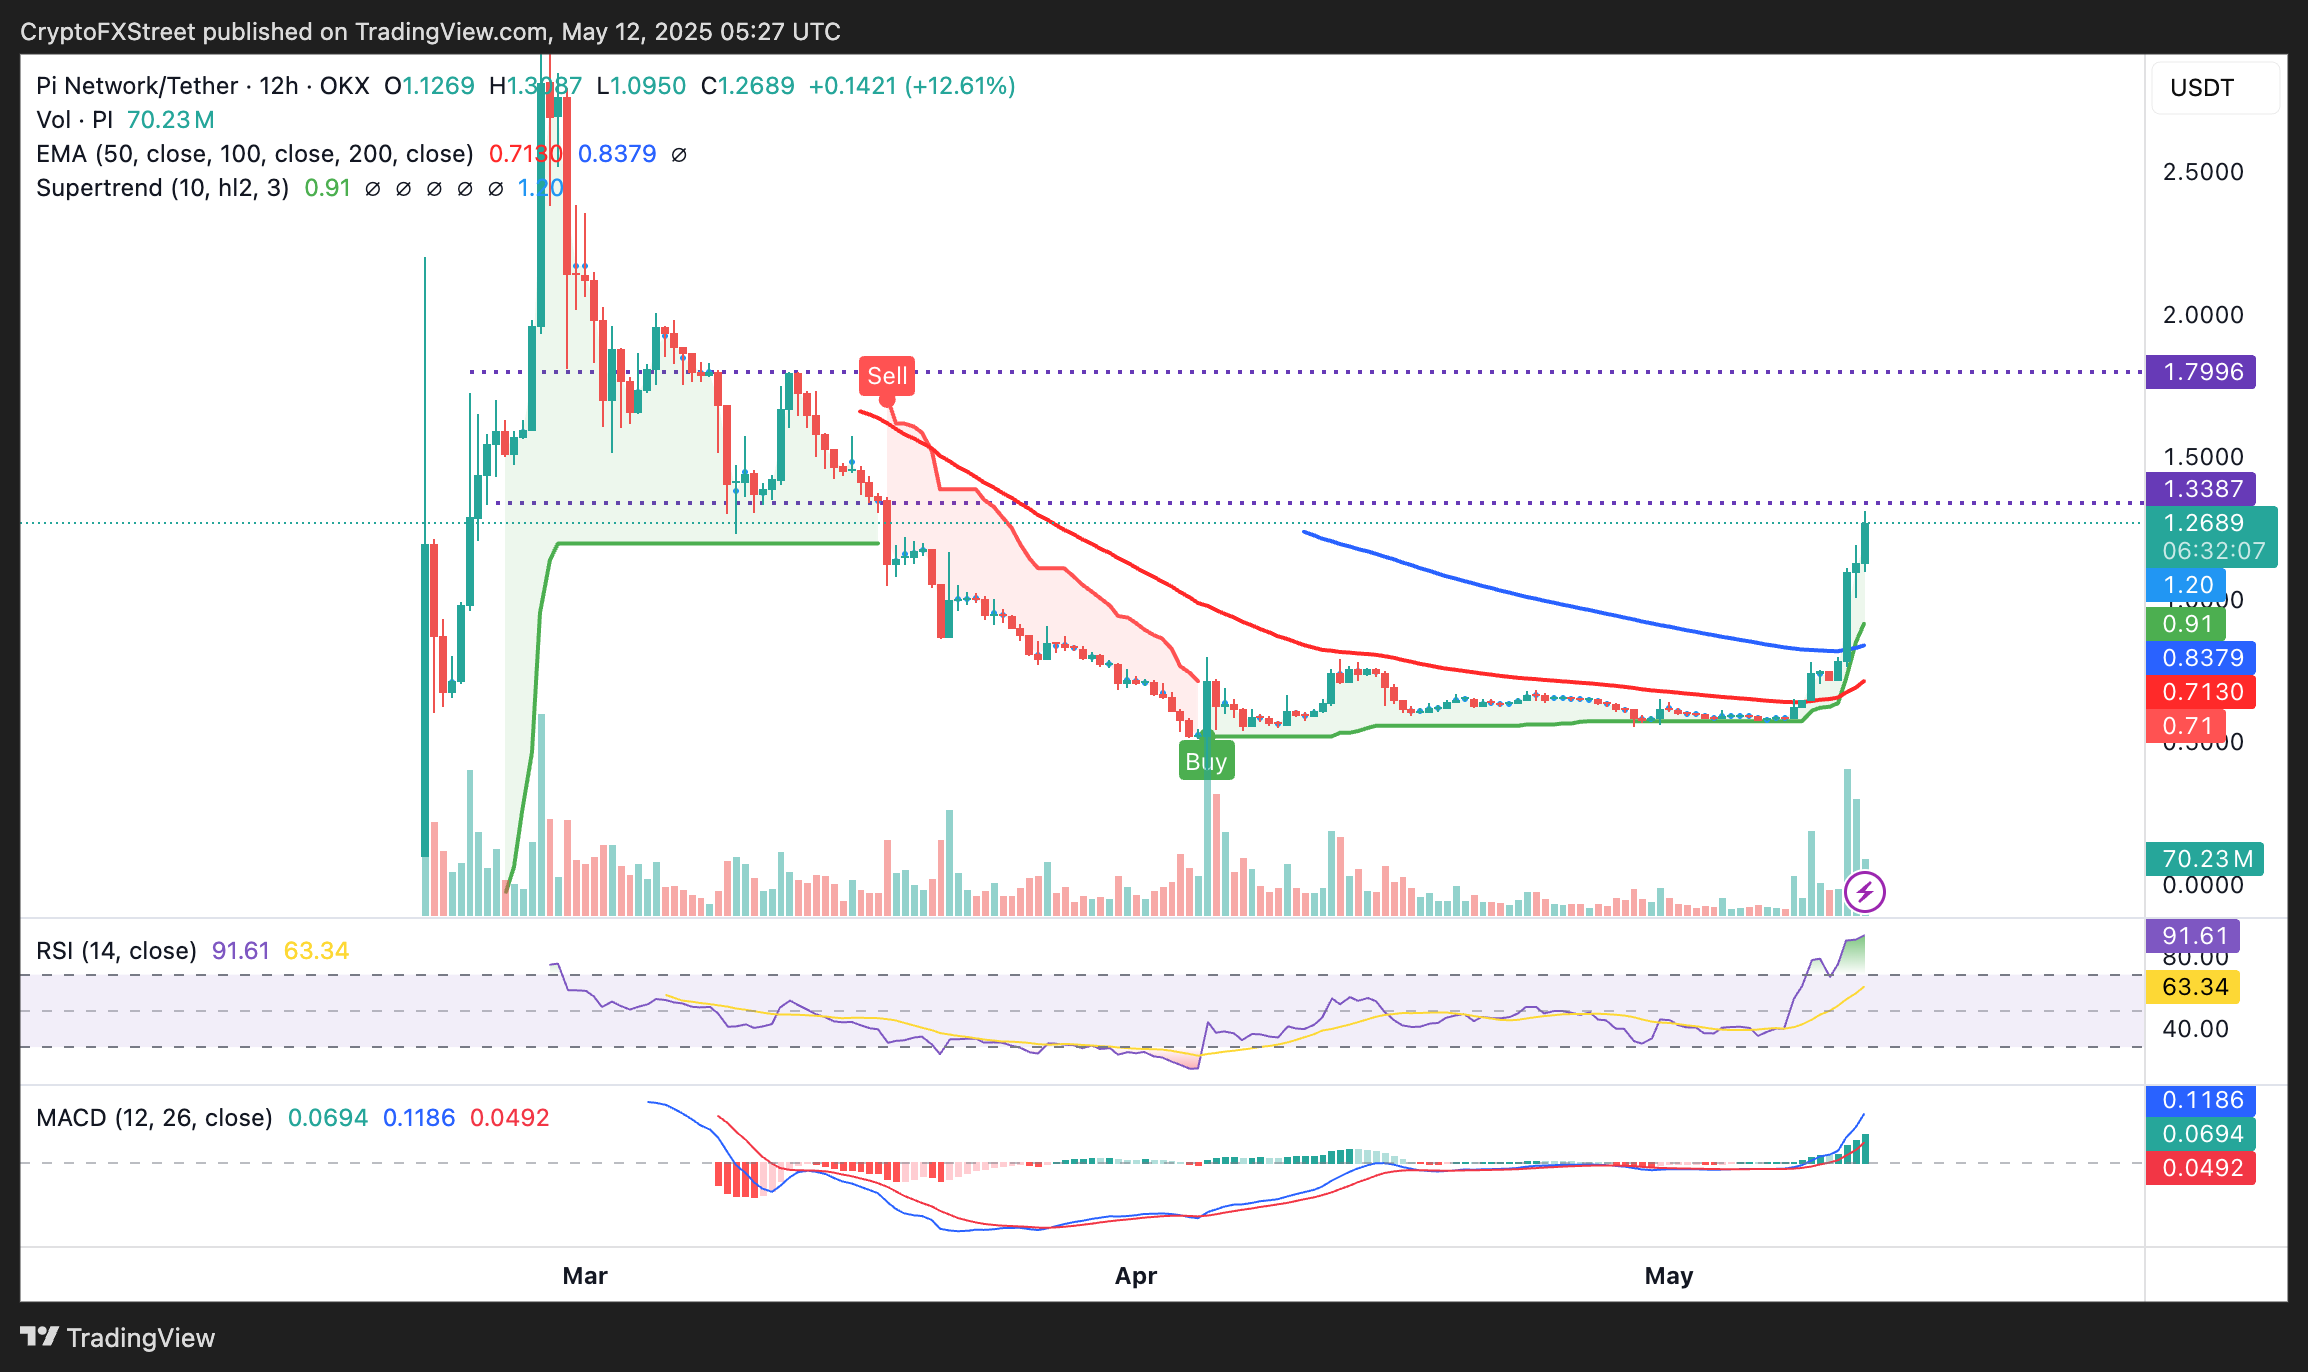
PI/USD 12-hour chart
On the other hand, the extremely overbought Relative Strength Index (RSI) indicator at 91.61 suggests that Pi Network may be due for a short-term pullback or even consolidation.
Kaspa breaks key trendline resistance
Kaspa’s price sits on top of a crucial five-month trendline resistance, accentuating the growing bullish influence in the wider crypto market. After an impressive 134% increase from the tariff-triggered crash to $0.053 on April 7, KAS currently hovers at $0.12, up more than 6% on the day.
The daily chart highlights a solid bullish structure with Kaspa’s price above the 50-, 100-, and 200-day EMA. A buy signal from the MACD cements the bullish grip on KAS as bulls knock on the resistance at $0.14.
A breakout above the nearest resistance at $0.14 could trigger a sharp price surge, with KAS aiming for $0.15—a level last seen in January—and potentially Kaspa’s December high of $0.18.
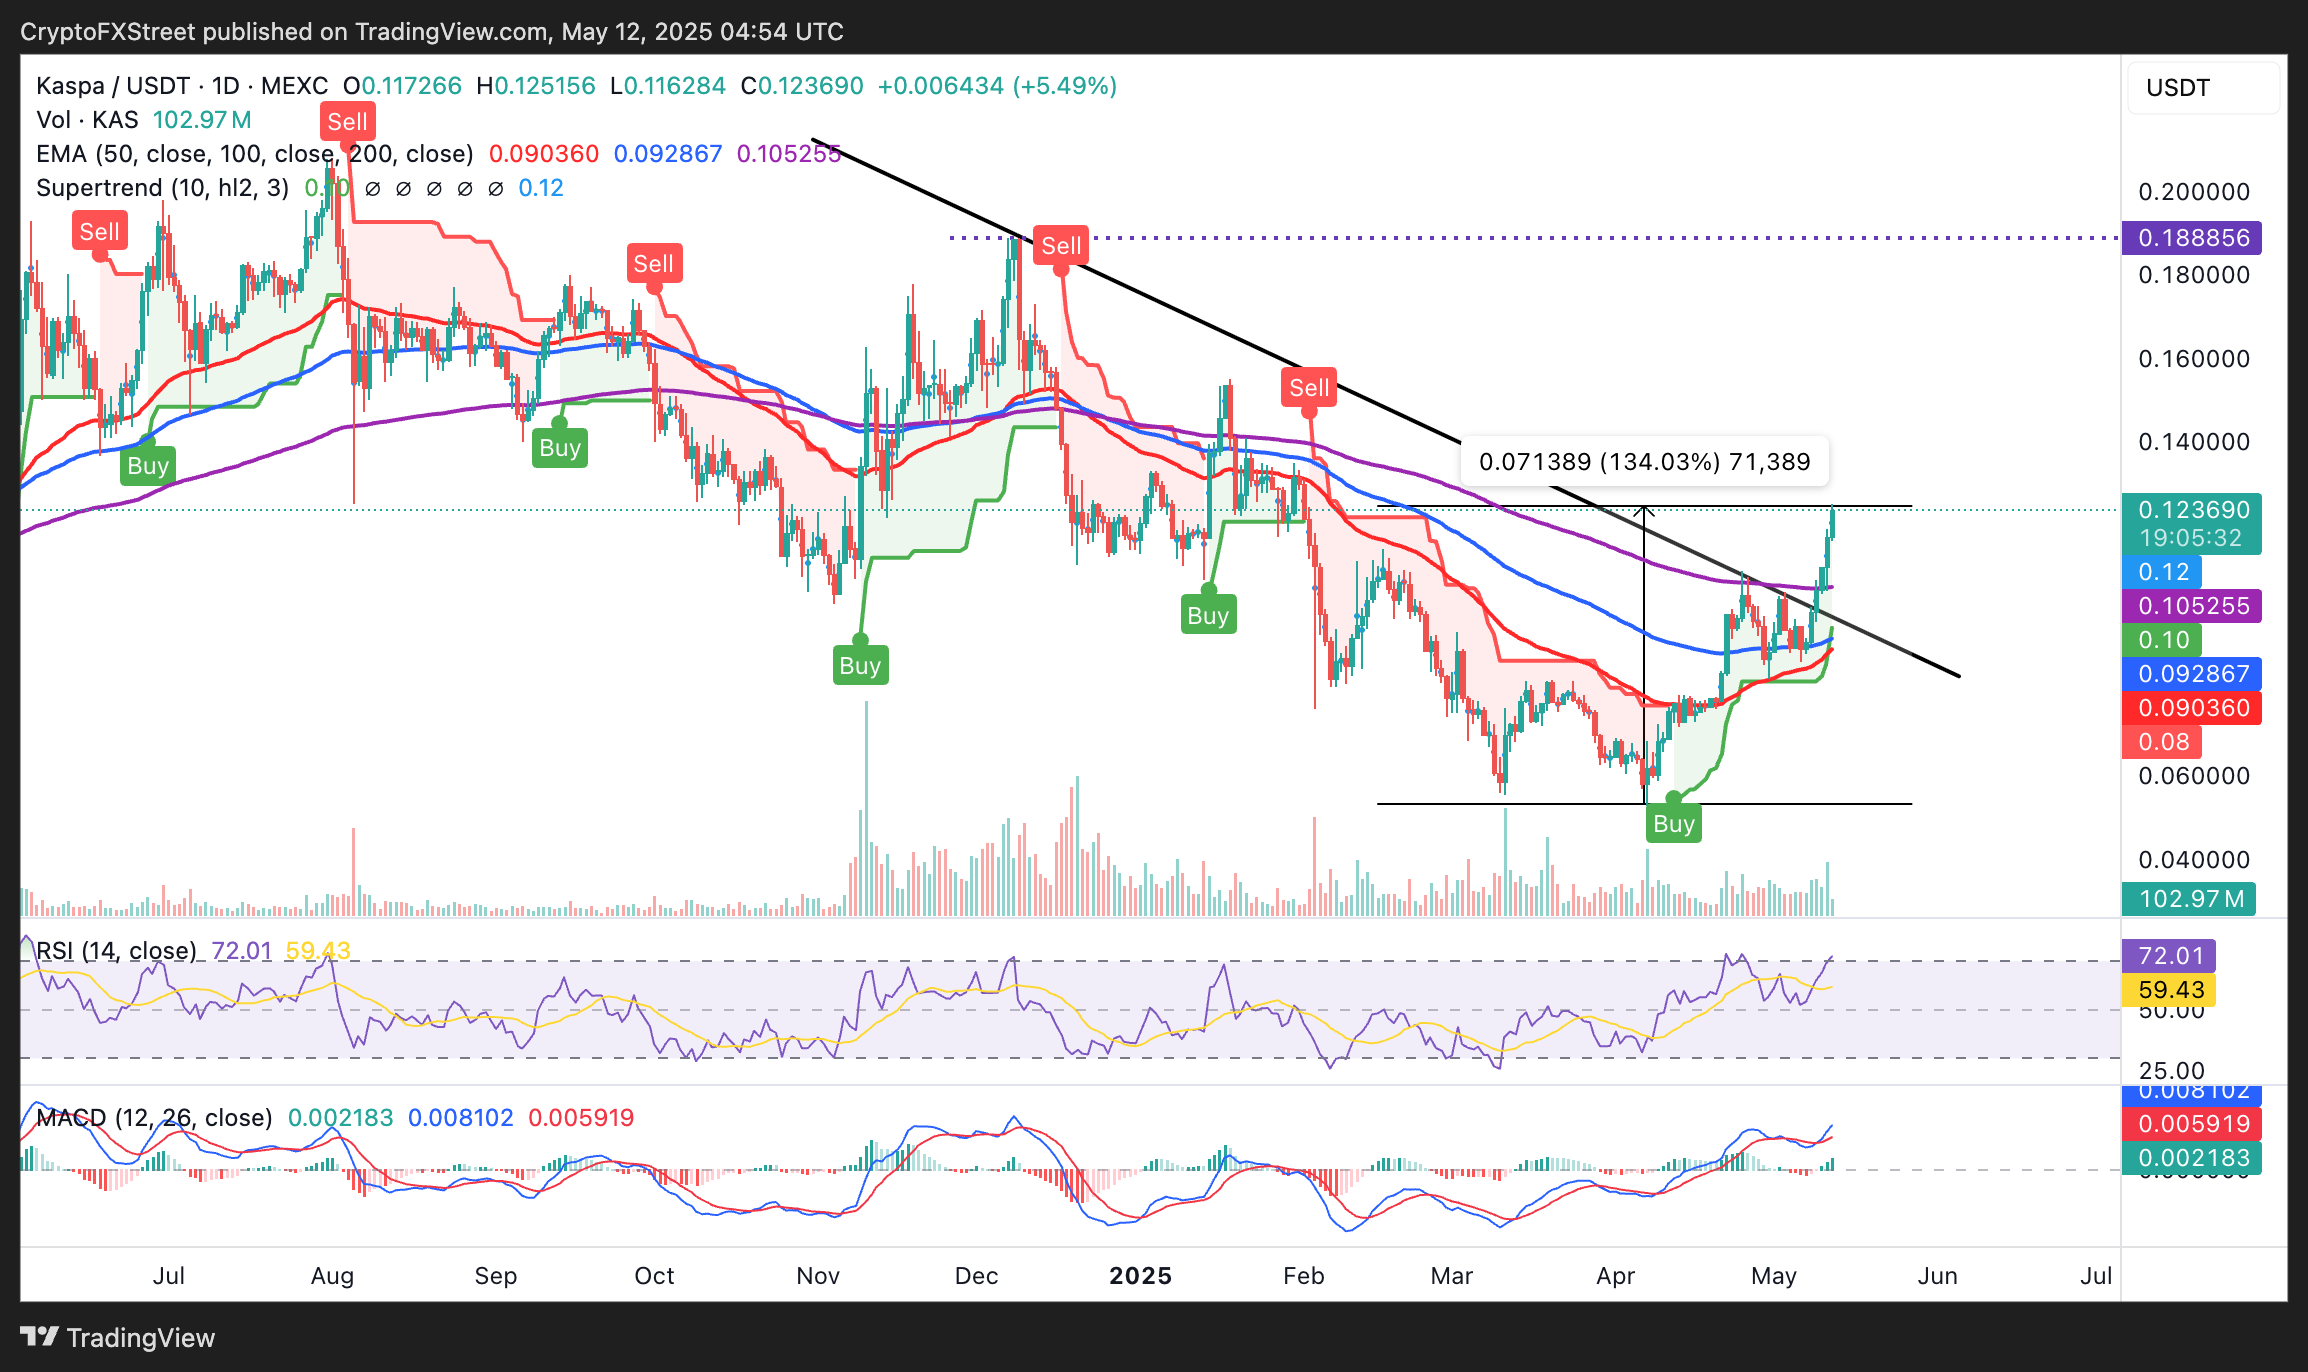
KAS/USD daily chart
Notably, the Relative Strength Index (RSI) indicator entering the overbought region above 70 hints at a strong bullish momentum. Overbought conditions often precede pullbacks due to potential profit-taking, hence the need for traders to prepare for different outcomes, including a retest of the 200-day EMA at $0.10 and the 100-day EMA at $0.09.
Peanut the Squirrel consolidates gains
Peanut the Squirrel’s price hovers close to the weekend high of $0.46, reflecting a slight drawdown on the day. The tailwind behind the token comes amid heightened interest in meme coins.
Based on the daily chart, PNUT remains strongly bullish on Monday, sitting on top of the 50-day ($0.26) and the 100-day EMAs ($0.29). The MACD indicator shows a bullish setup with the MACD line (blue) above the signal line (red), expanding green histograms above the centre line.
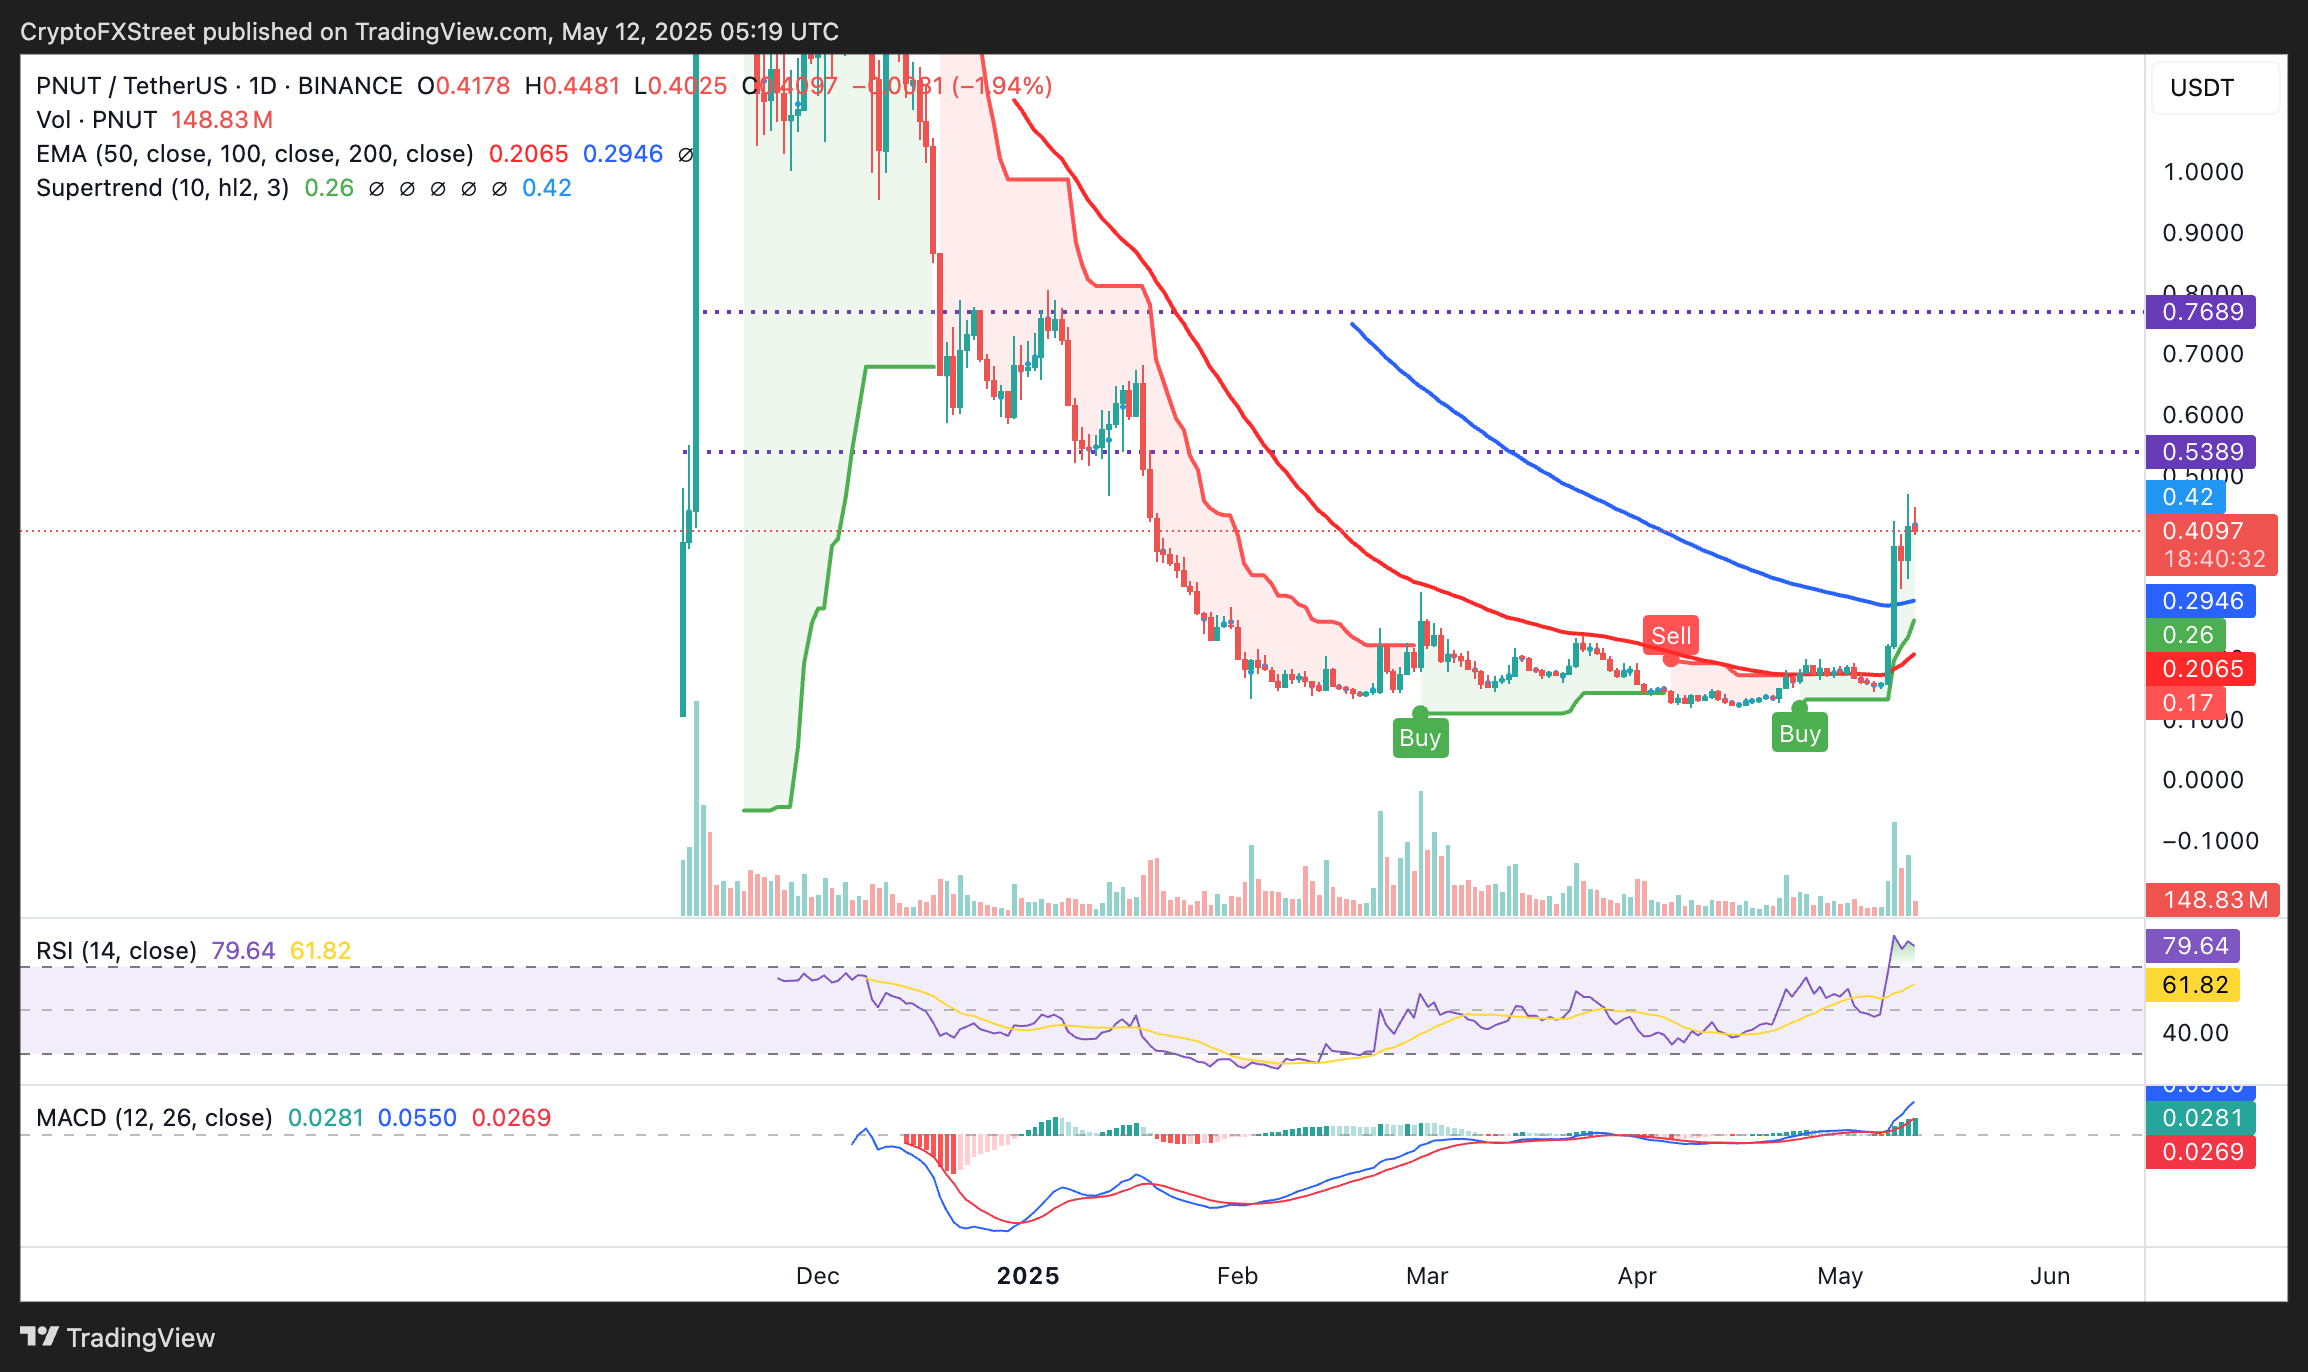
PNUT/USDT daily chart
The RSI indicator is at 79.64, having peaked at 84.96 on Friday, indicating overbought conditions. Overbought conditions are often a precursor to a pullback, with PNUT likely to pull back toward the 100-day EMA at $0.29 in search of support and liquidity.
Cryptocurrency prices FAQs
How do new token launches or listings affect cryptocurrency prices?
Token launches influence demand and adoption among market participants. Listings on crypto exchanges deepen the liquidity for an asset and add new participants to an asset’s network. This is typically bullish for a digital asset.
How do hacks affect cryptocurrency prices?
A hack is an event in which an attacker captures a large volume of the asset from a DeFi bridge or hot wallet of an exchange or any other crypto platform via exploits, bugs or other methods. The exploiter then transfers these tokens out of the exchange platforms to ultimately sell or swap the assets for other cryptocurrencies or stablecoins. Such events often involve an en masse panic triggering a sell-off in the affected assets.
How do macroeconomic releases and events affect cryptocurrency prices?
Macroeconomic events like the US Federal Reserve’s decision on interest rates influence crypto assets mainly through the direct impact they have on the US Dollar. An increase in interest rate typically negatively influences Bitcoin and altcoin prices, and vice versa. If the US Dollar index declines, risk assets and associated leverage for trading gets cheaper, in turn driving crypto prices higher.
How do major crypto upgrades like halvings, hard forks affect cryptocurrency prices?
Halvings are typically considered bullish events as they slash the block reward in half for miners, constricting the supply of the asset. At consistent demand if the supply reduces, the asset’s price climbs.

Log in to Reply
Log in to comment your thoughtsComments
Related Articles
|Square
Get the BTCC app to start your crypto journey
Get started today Scan to join our 100M+ users