Pepe Price Triggers Buy Signal as Crypto Whales Go All-In

Memecoin mania isn’t dead—it’s just wearing a Pepe suit. The frog-themed crypto just flashed its strongest buy signal since the 2024 bull run, coinciding with a surge in whale accumulation. Are the big players betting on a comeback, or just desperate to recoup losses from their last degenerate gamble?
Whale wallets holding 1M+ PEPE tokens ballooned 12% this week—the kind of movement that typically precedes a volatility spike. Meanwhile, the TD Sequential indicator (a favorite of degenerate traders everywhere) just printed its first bullish setup since PEPE’s 30% April rally.
Of course, in crypto-land, ’signals’ are just horoscopes for bros with too much leverage. But when the whales start feeding, retail traders better grab their harpoons—or risk getting swallowed by the next wave.
Pepe’s price picks up steam as whales increase exposure
Optimism for a broad-based altcoin season is fading amid liquidity crunches, heightened volatility and massive token unlocks, which create headwinds.
Isolated pumps among altcoins suggest that investors are likely focusing on the tokens with the potential to rally. At the same time, key narratives like meme coins, Artificial Intelligence (AI), and real-world assets (RWAs) are taking shape in this cycle.
This outlook has seen Pepe’s price steadily rebound from the tariff-triggered crash in April, backed by increasing demand from large volume investors. According to Lookonchain, a platform tracking large blockchain transactions, a whale purchased 500 billion PEPE valued at approximately $4.36 million. This particular whale holds a total of 2 trillion PEPE, worth roughly $17.42 million.
This whale just bought 500B $PEPE($4.36M) again and currently holds 2T $PEPE($17.42M).https://t.co/lj4QaP0DUW pic.twitter.com/sx7hOqkcKG
— Lookonchain (@lookonchain) May 8, 2025Lookonchain also highlighted that on April 30, another whale with a staggering $147 million in assets withdrew 1.5 trillion PEPE valued at $13.3 million from Binance. Withdrawals from exchanges often signal a bullish sentiment, as investors move tokens to self-custody wallets for long-term holding. This reduces potential selling pressure by decreasing the available supply on exchanges.
Santiment’s Supply Distribution metric emphasises the high risk-on sentiment, as the chart below shows that addresses holding between 10 million to 100 million have grown to account for 0.94% of the supply from 0.92% in February. If PEPE’s demand keeps growing, creating a stronger tailwind, its price could rise above $0.00001 or even hit $0.000015 in the NEAR term.
%20%5B10-1746692825118.53.06,%2008%20May,%202025%5D.png)
Supply Distribution Metric | Source: Santiment
Pepe’s bulls tackle 100-day EMA resistance
Pepe’s price rebound seems unstoppable on Thursday after reclaiming the 50-day Exponential Moving Average (EMA) at $0.0000081 as support. Bulls are now knocking on the immediate resistance at $0.0000091, close to the 100-day EMA.
The Relative Strength Index (RSI) indicator’s upward trend toward the overbought region showcases the bullish momentum, increasing the probability of PEPE’s climb above the 100-day EMA.
The Moving Average Convergence Divergence (MACD) indicator teases a buy signal on the daily chart. This could manifest with the MACD line (blue) crossing above the signal line (red). If traders increase exposure to PEPE, the uptrend might last longer than expected, with near-term targets at the 200-day EMA around $0.00001 and $0.000015, a level last tested as support and resistance in January.
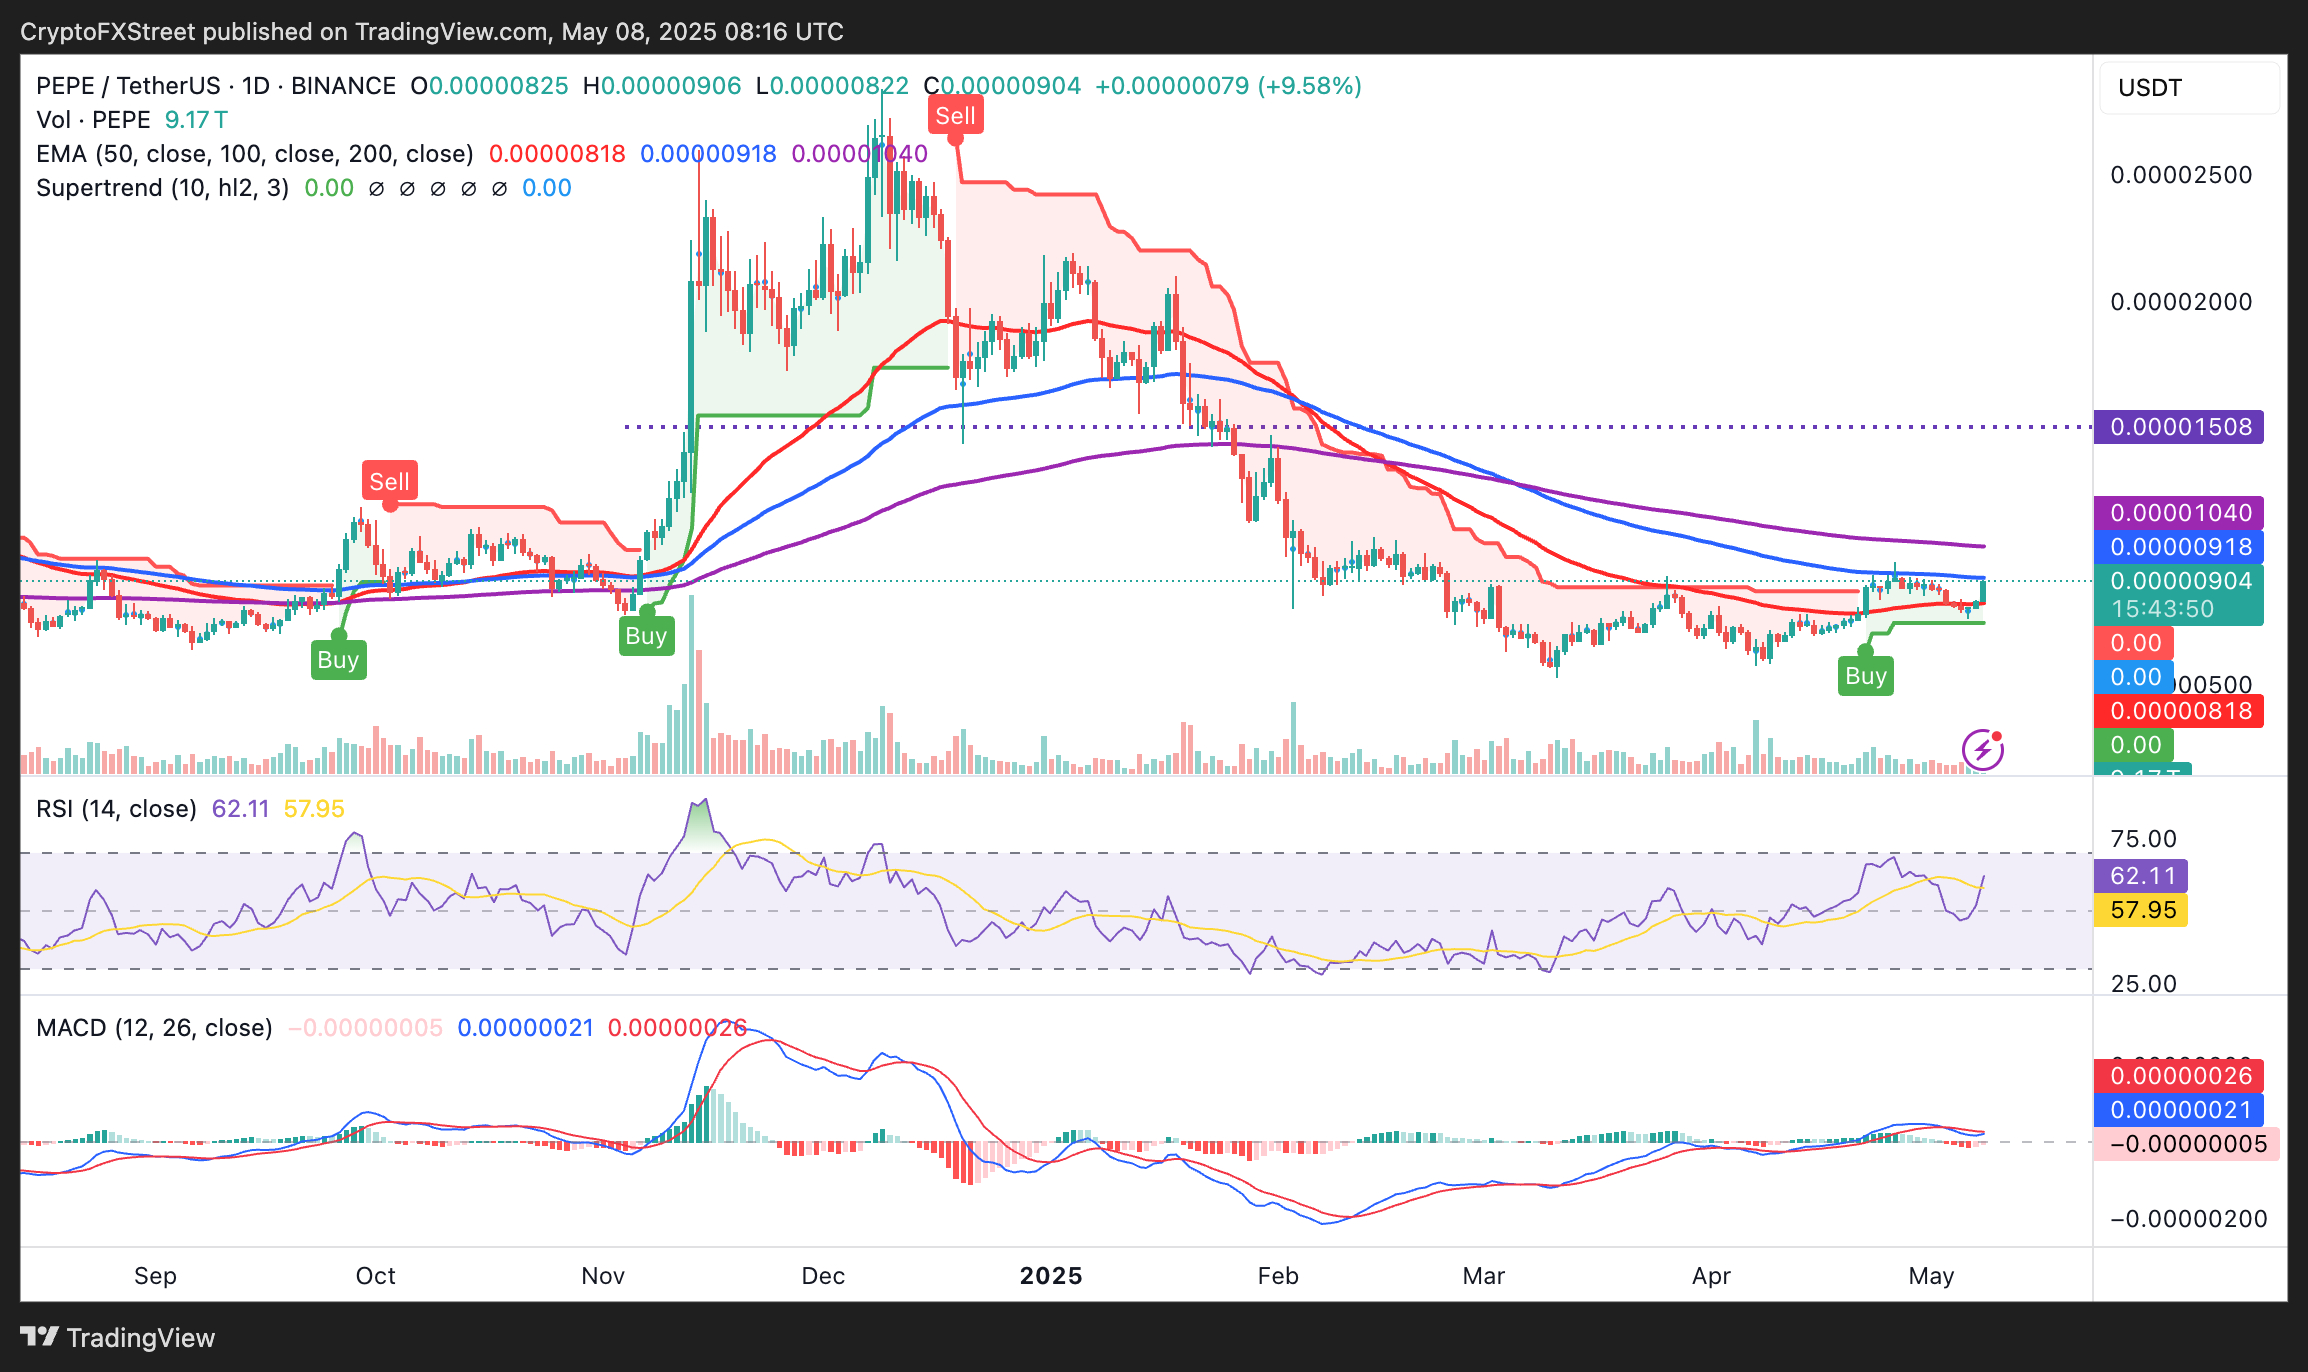
PEPE/USDT daily chart
However, failing to breach the immediate 100-day EMA hurdle at $0.0000091 or even the 200-day EMA resistance at $0.00001 could create instability, triggering sell-side pressure as traders adjust positions.
Profit-taking could escalate the probability of a trend reversal. Key levels to monitor for risk mitigation include the 50-day EMA at $0.0000081 and the April 7 low at $0.0000058.
Cryptocurrency metrics FAQs
What is circulating supply?
The developer or creator of each cryptocurrency decides on the total number of tokens that can be minted or issued. Only a certain number of these assets can be minted by mining, staking or other mechanisms. This is defined by the algorithm of the underlying blockchain technology. On the other hand, circulating supply can also be decreased via actions such as burning tokens, or mistakenly sending assets to addresses of other incompatible blockchains.
What is market capitalization?
Market capitalization is the result of multiplying the circulating supply of a certain asset by the asset’s current market value.
What is trading volume?
Trading volume refers to the total number of tokens for a specific asset that has been transacted or exchanged between buyers and sellers within set trading hours, for example, 24 hours. It is used to gauge market sentiment, this metric combines all volumes on centralized exchanges and decentralized exchanges. Increasing trading volume often denotes the demand for a certain asset as more people are buying and selling the cryptocurrency.
What is the funding rate?
Funding rates are a concept designed to encourage traders to take positions and ensure perpetual contract prices match spot markets. It defines a mechanism by exchanges to ensure that future prices and index prices periodic payments regularly converge. When the funding rate is positive, the price of the perpetual contract is higher than the mark price. This means traders who are bullish and have opened long positions pay traders who are in short positions. On the other hand, a negative funding rate means perpetual prices are below the mark price, and hence traders with short positions pay traders who have opened long positions.
