AI Tokens Stumble While Tether Plows Into AI—Just as Retail FOMO Peaks

Market analytics from CoinMarketCap reveal a growing divergence in AI crypto sectors—blue-chip AI tokens dip 12% as Tether quietly launches its own AI division. Because nothing says ’decentralized future’ like stablecoin giants playing tech venture capitalist.
Meanwhile, retail traders keep piling into meme-driven AI projects. Some things never change—even when the tech does.
Tether enters the AI race
The CEO of Tether, Paolo Ardoino, unveiled the company’s new project, Tether(.)ai, at Consensus 2025. According to CoinMarketCap (CMC), this is an open-source, peer-to-peer AI runtime designed to run on “any hardware,” without requiring any API keys. The platform features built-in USDT and Bitcoin payment systems accessed via a developer kit.
🌐 Tether Enters AI Race:
CEO Paolo Ardoino unveils Tether(.)ai at Consensus 2025. Open-source, peer-to-peer AI runtime designed to run on "any hardware." No API keys required. Built-in USDT and Bitcoin payment capabilities via wallet dev kit.
4/6
In addition to Tether, the AI-blockchain intersection has attracted over 70 crypto entities, including Yuga Labs and Magic Eden, which have pledged support for Thinkagents(.)ai open-source framework. The initiative aims to speed up development in the AI sector to compete against the Big Tech monopoly.
Tokens in the AI sector accelerate recovery
The total AI sector’s market capitalization has made a major comeback in the last 24 hours, surpassing $25 billion. This follows a significant drawdown, where it shed $2.5 billion in market cap, reflecting Bitcoin’s price stagnation between $93,000 and $96,000, as CMC highlighted in the weekly analysis on Tuesday.
🚀 CMC Weekly Analysis: AI Market Divergence & Tether’s AI Debut!
VIRTUAL soars 37%! Tether launches decentralized AI platform! 70+ crypto firms unite against Big Tech!
Let’s explore this week’s AI landscape 🧵👇
1/6 pic.twitter.com/mBiuqmsSXZ
Only three of the top ten AI tokens posted losses in the last 24 hours, with FET, TAO and Story (IP) in the lead. Kaito is up more than 40% in a surprise comeback after a two-month-long downtrend. The token hovers at $1.15 at the time of writing on Wednesday, increasing nearly 20% on the day.
A break above the 8-hour 200 Exponential Moving Average (EMA) could push Kaito’s price recovery higher than expected. Beyond this moving average resistance, $1.50 marks the next hurdle, previously tested in March.
The Relative Strength Index (RSI) indicator’s sharp rise into the overbought zone signifies the strong bullish momentum behind Kaito. Still, it calls for caution as overbought conditions often precede trend corrections, reflecting bullish exhaustion and profit-taking. In case of a reversal, tentative support areas lie at $1.00; a resistance-turned-support level, the 100-day EMA at $0.92, and the 50-day EMA at $0.87.
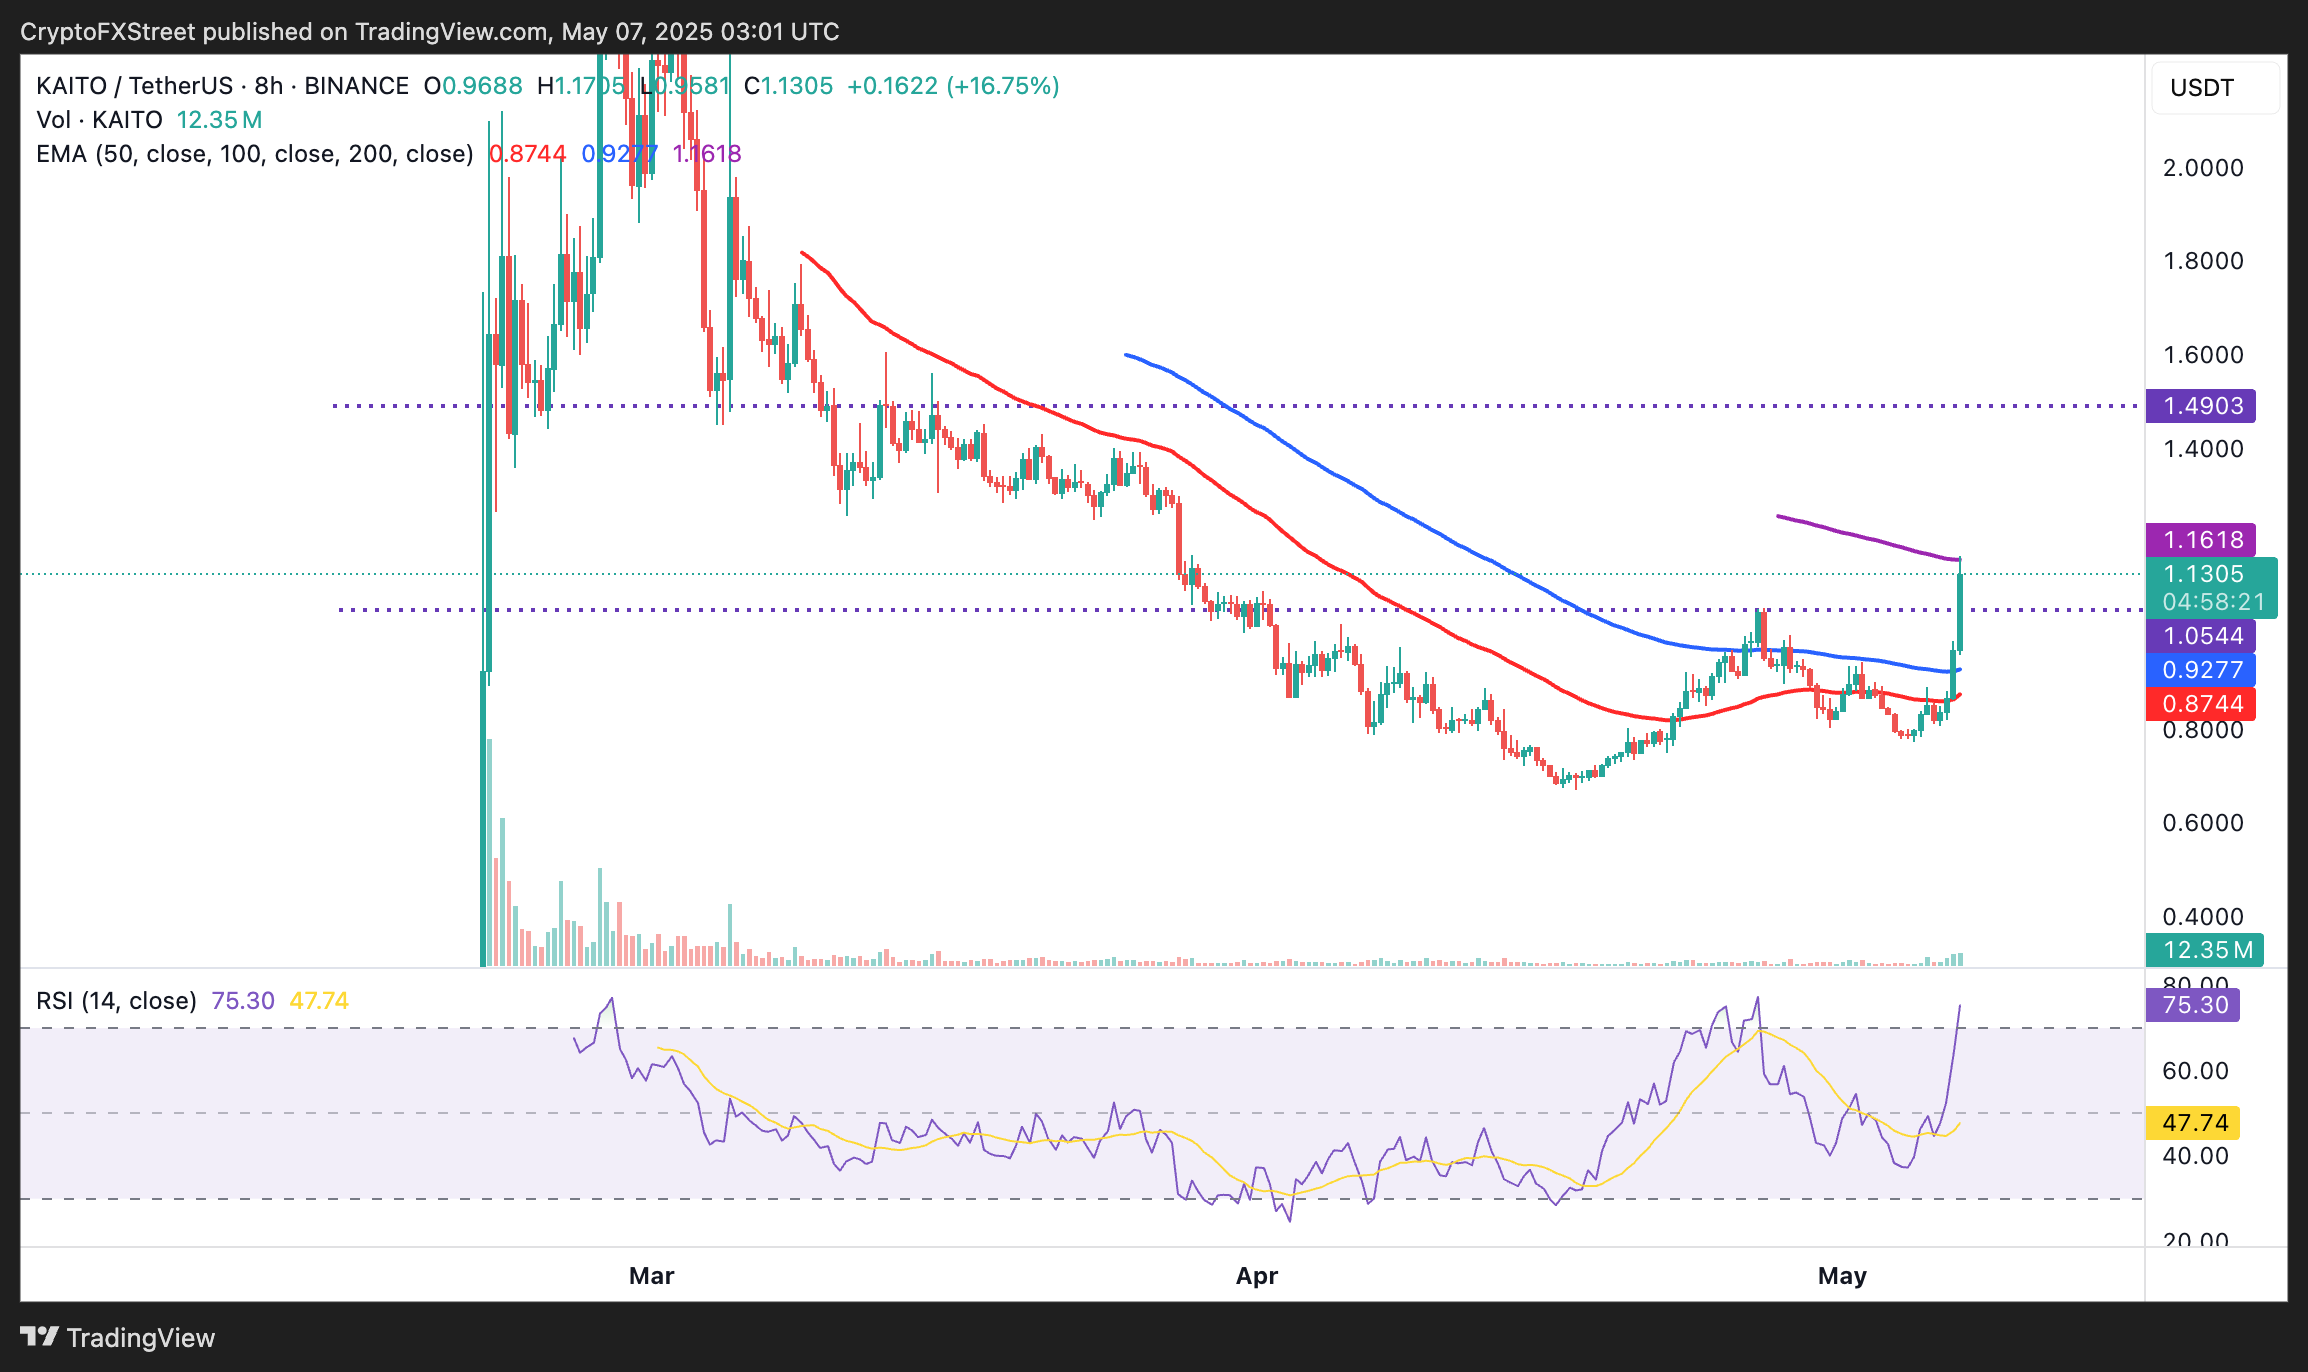
KAITO/USDT 8-hour chart
Bittensor’s price is gaining momentum, up over 1.5% in the last 24 hours to trade at $380. The AI token sits above the 200-day EMA, 100-day EMA, and the 50-day EMA, which augments the bullish outlook.
The RSI indicator’s rebound above 65 hints at a potential breakout likely to tag $400, accentuated by renewed interest in the AI sector. In the event of a pullback, the 200-day EMA at $378, the 100-day EMA at $329, and the 50-day EMA at $361 could absorb the selling pressure, while providing liquidity to support another recovery attempt.
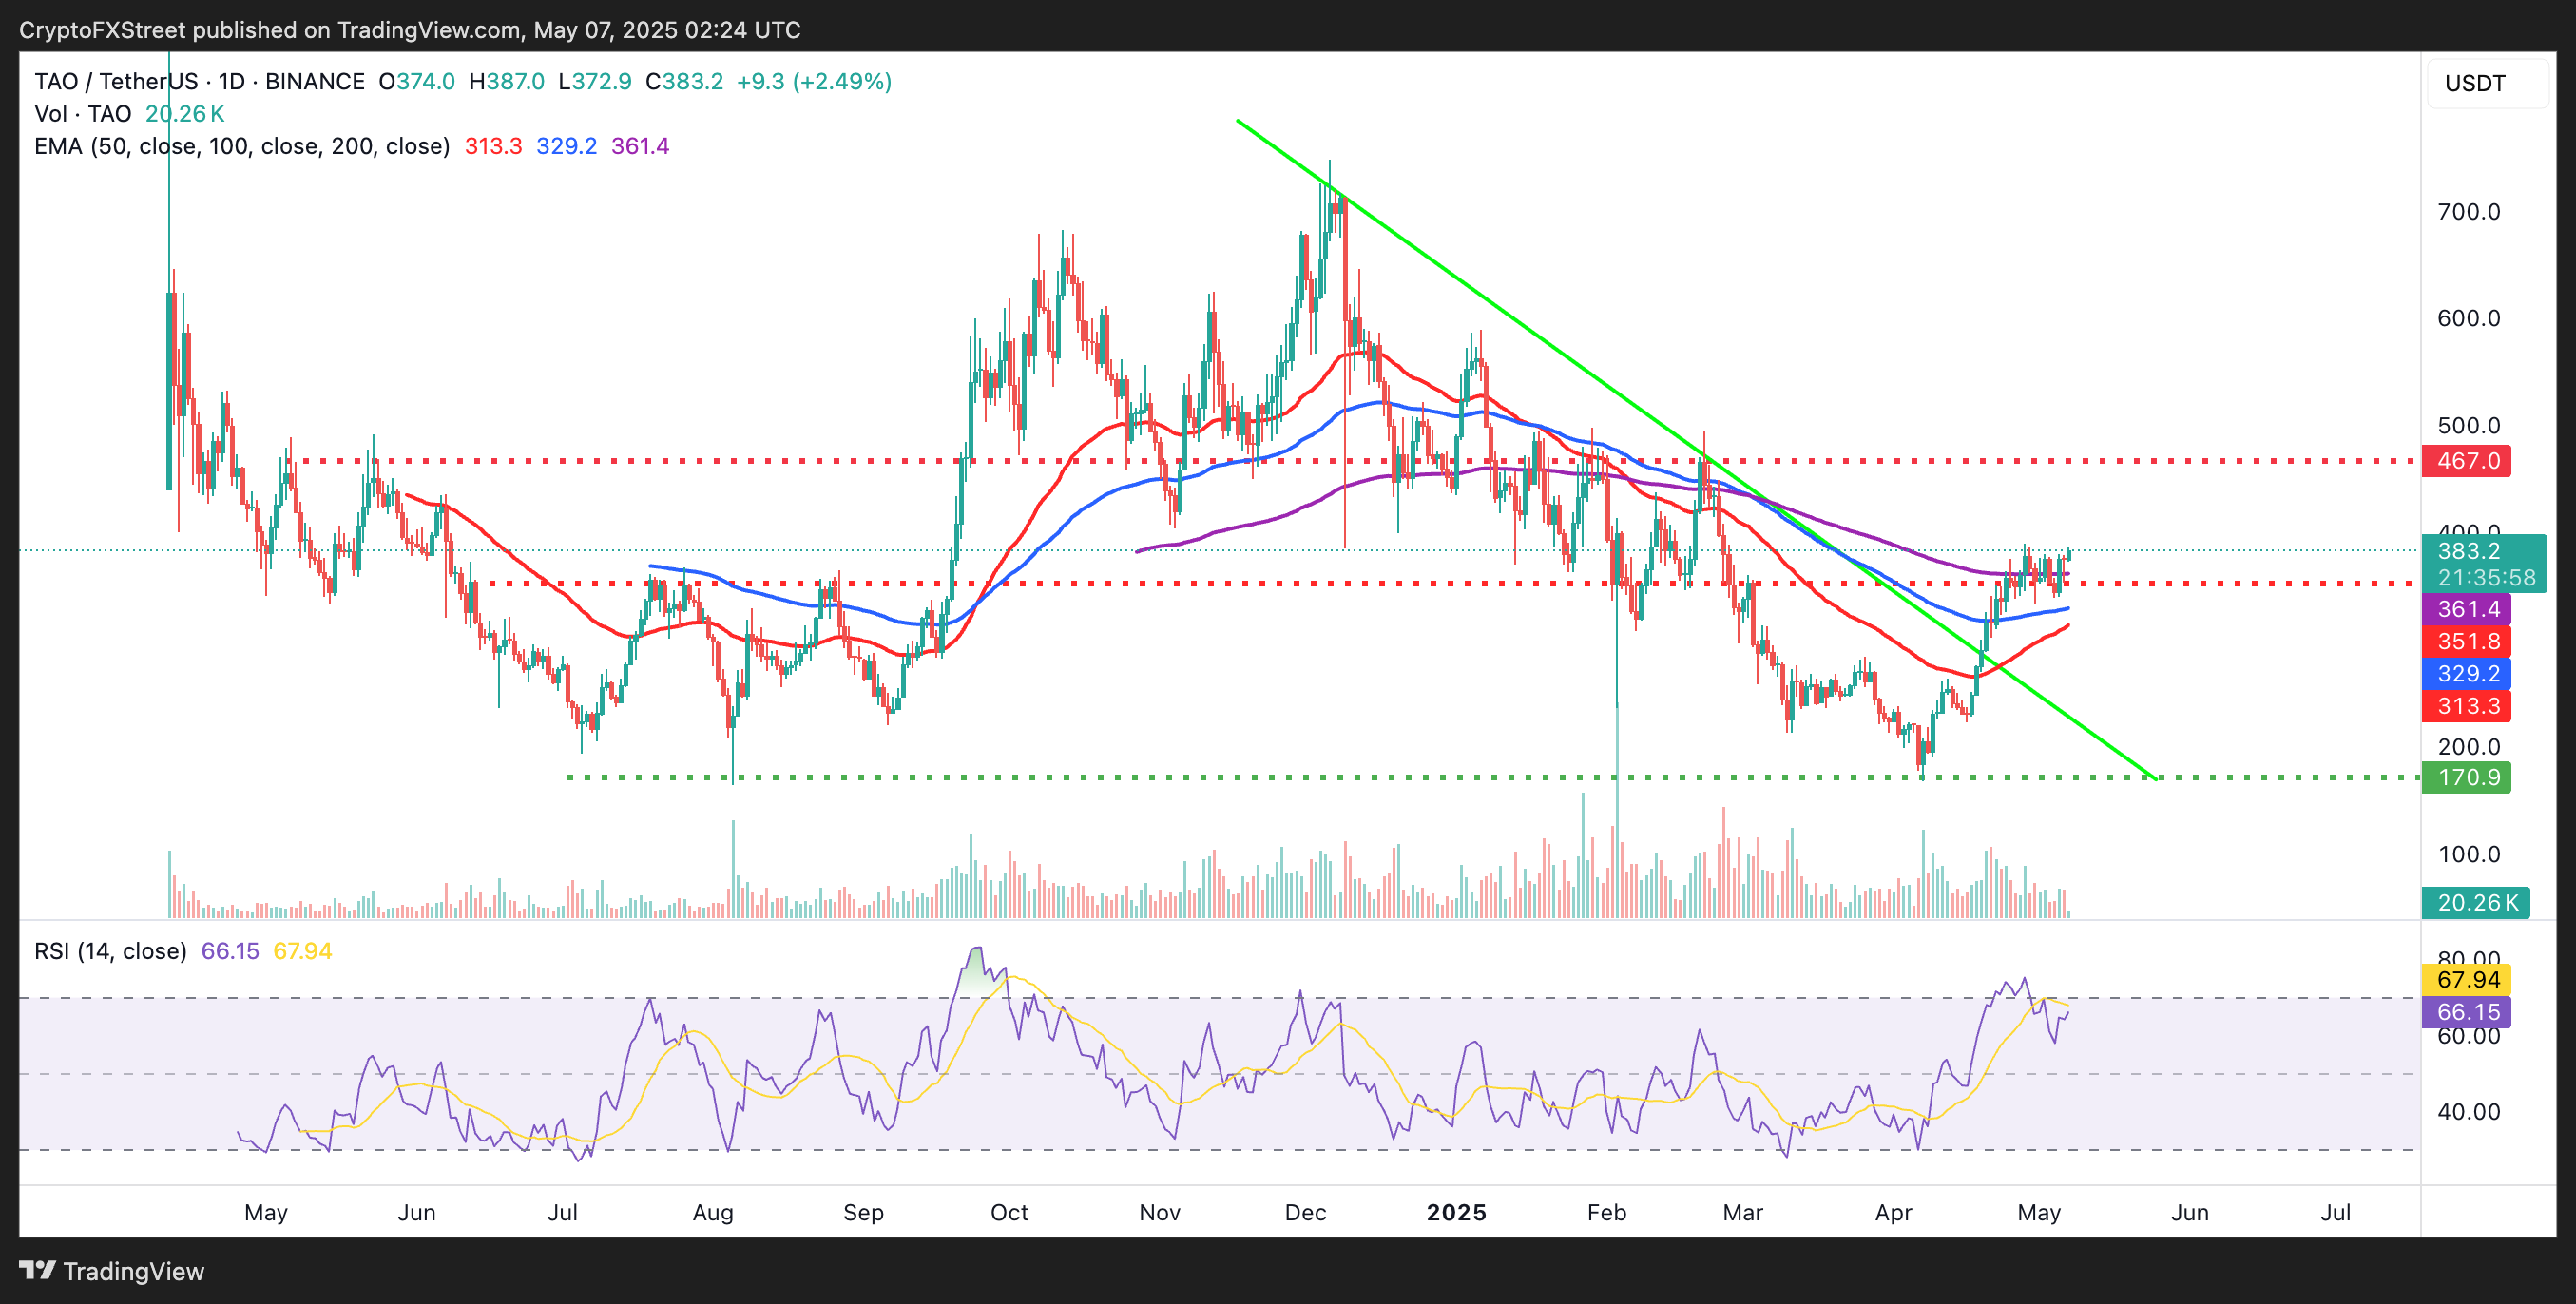
TAO/USDT daily chart
Artificial Superintelligence Alliance is in the green, up nearly 2% on the day to exchange hands at $0.69. The token sits between two key levels, support provided by the 50-day EMA at $0.62 and resistance at $0.71 due to the 100-day EMA.
Recovery toward $1.00 could gain momentum if bulls breach the immediate $0.71 resistance, and the seller congestion is likely at $0.90 NEAR the 200-day EMA.
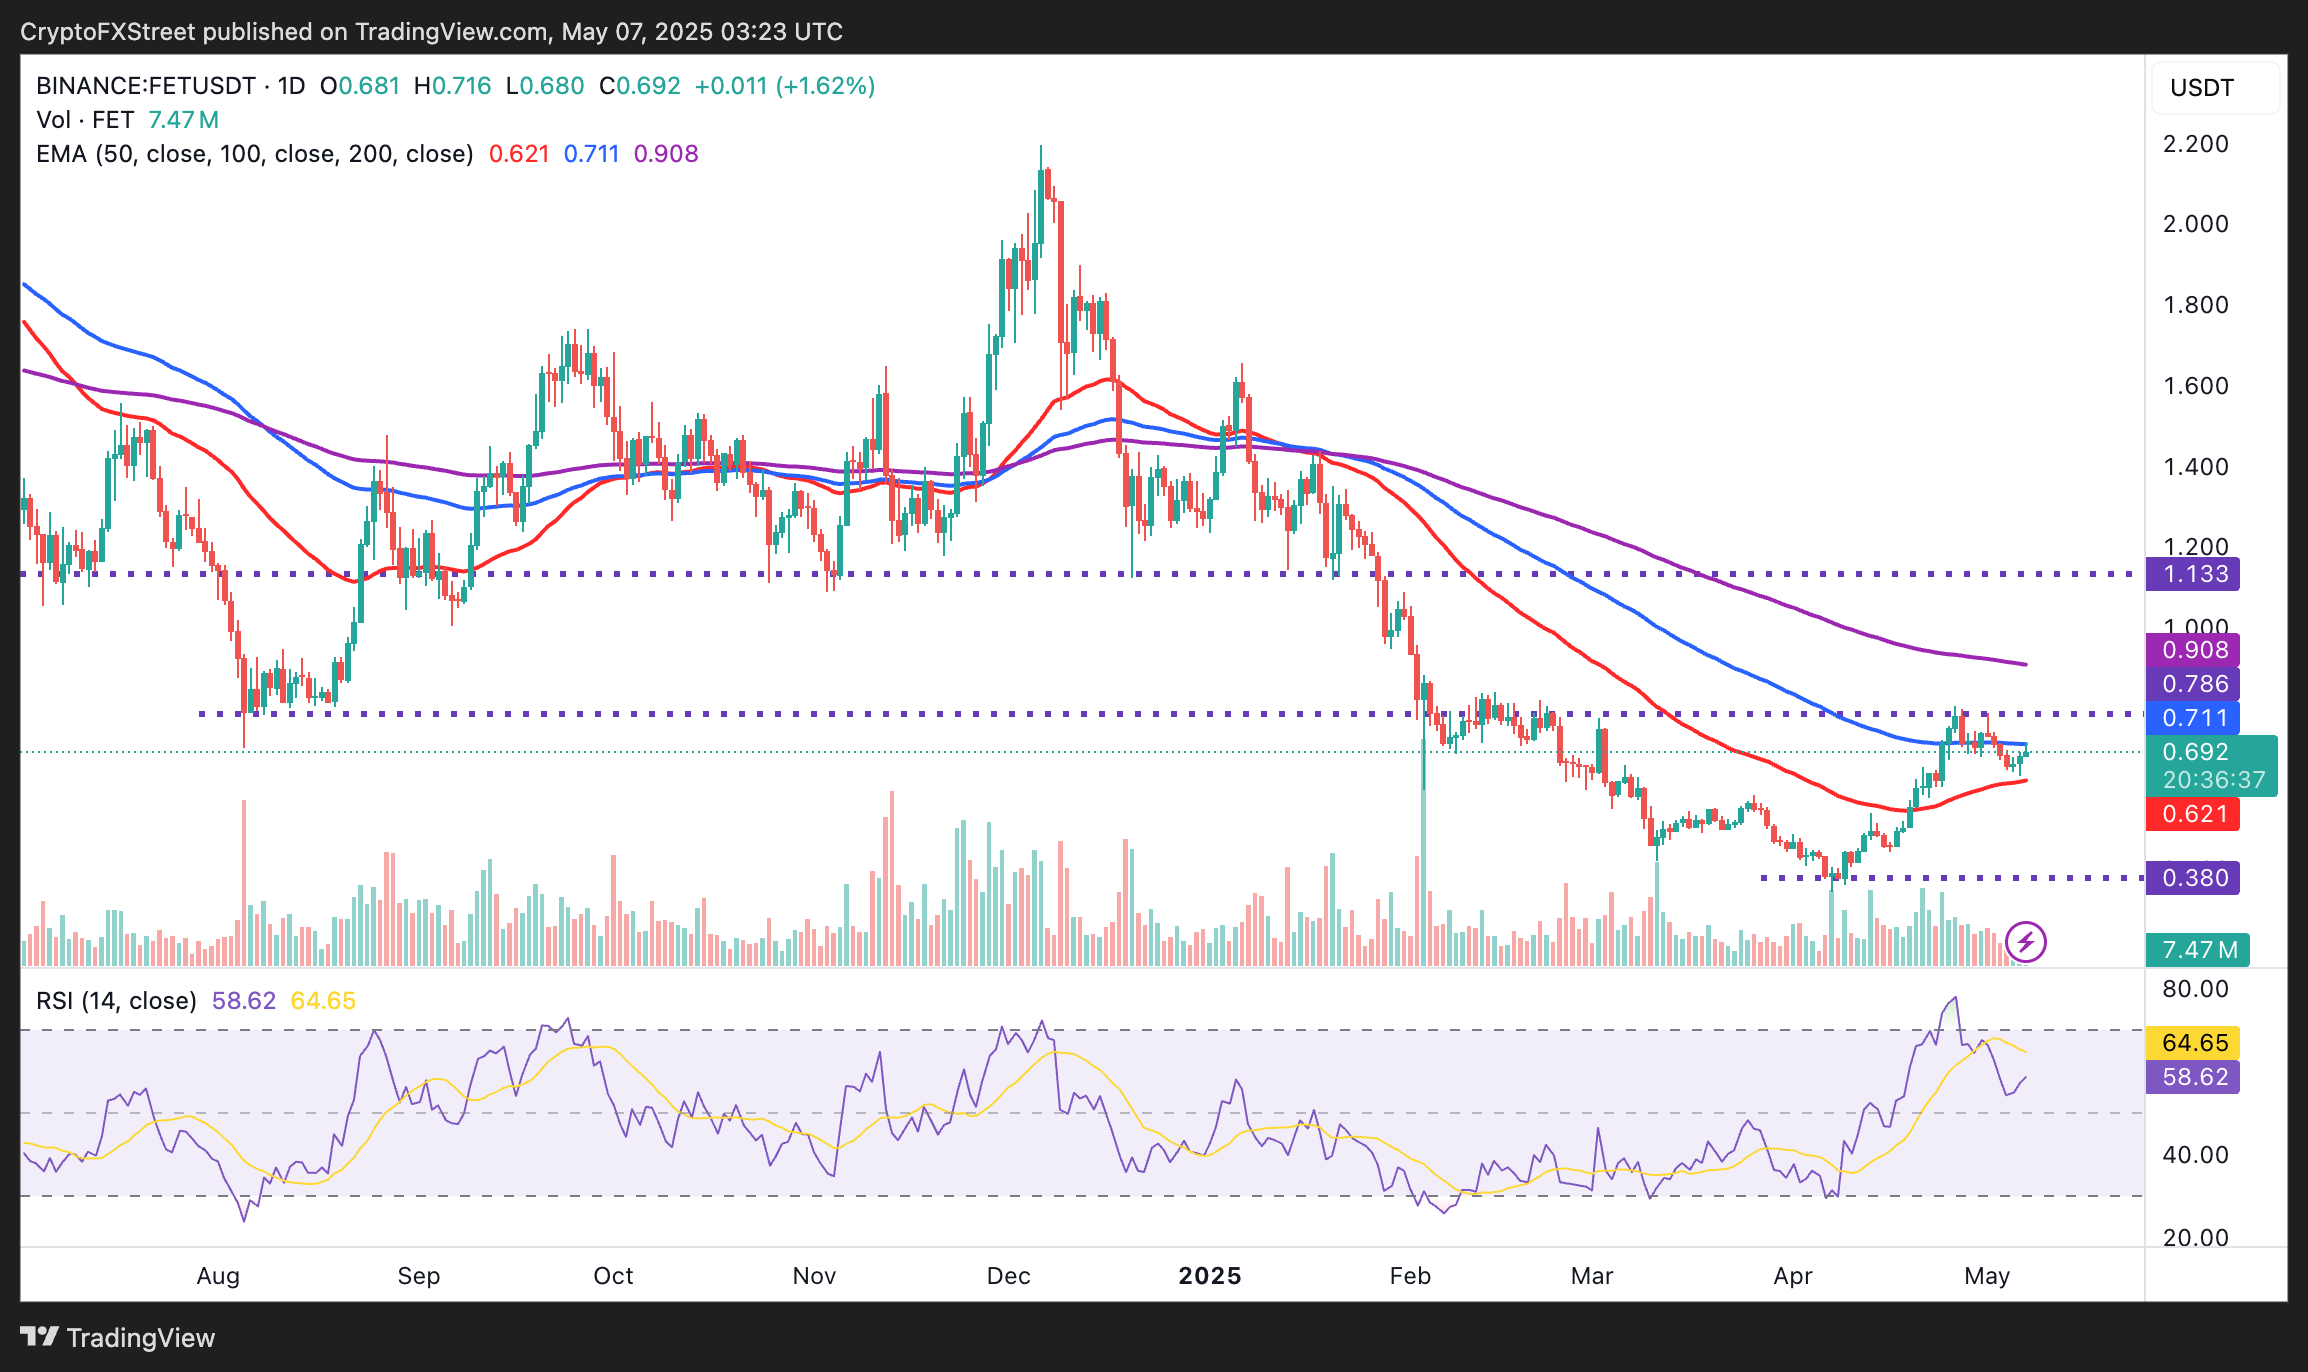
FET/USD daily chart
On the other hand, Virtuals Protocol has slowed down the rally after posting more than 200% in gains in the last month before topping out at $1.88. A correction is underway, with VIRTUAL down almost 3% on the day to teeter at $1.44 at the time of writing.
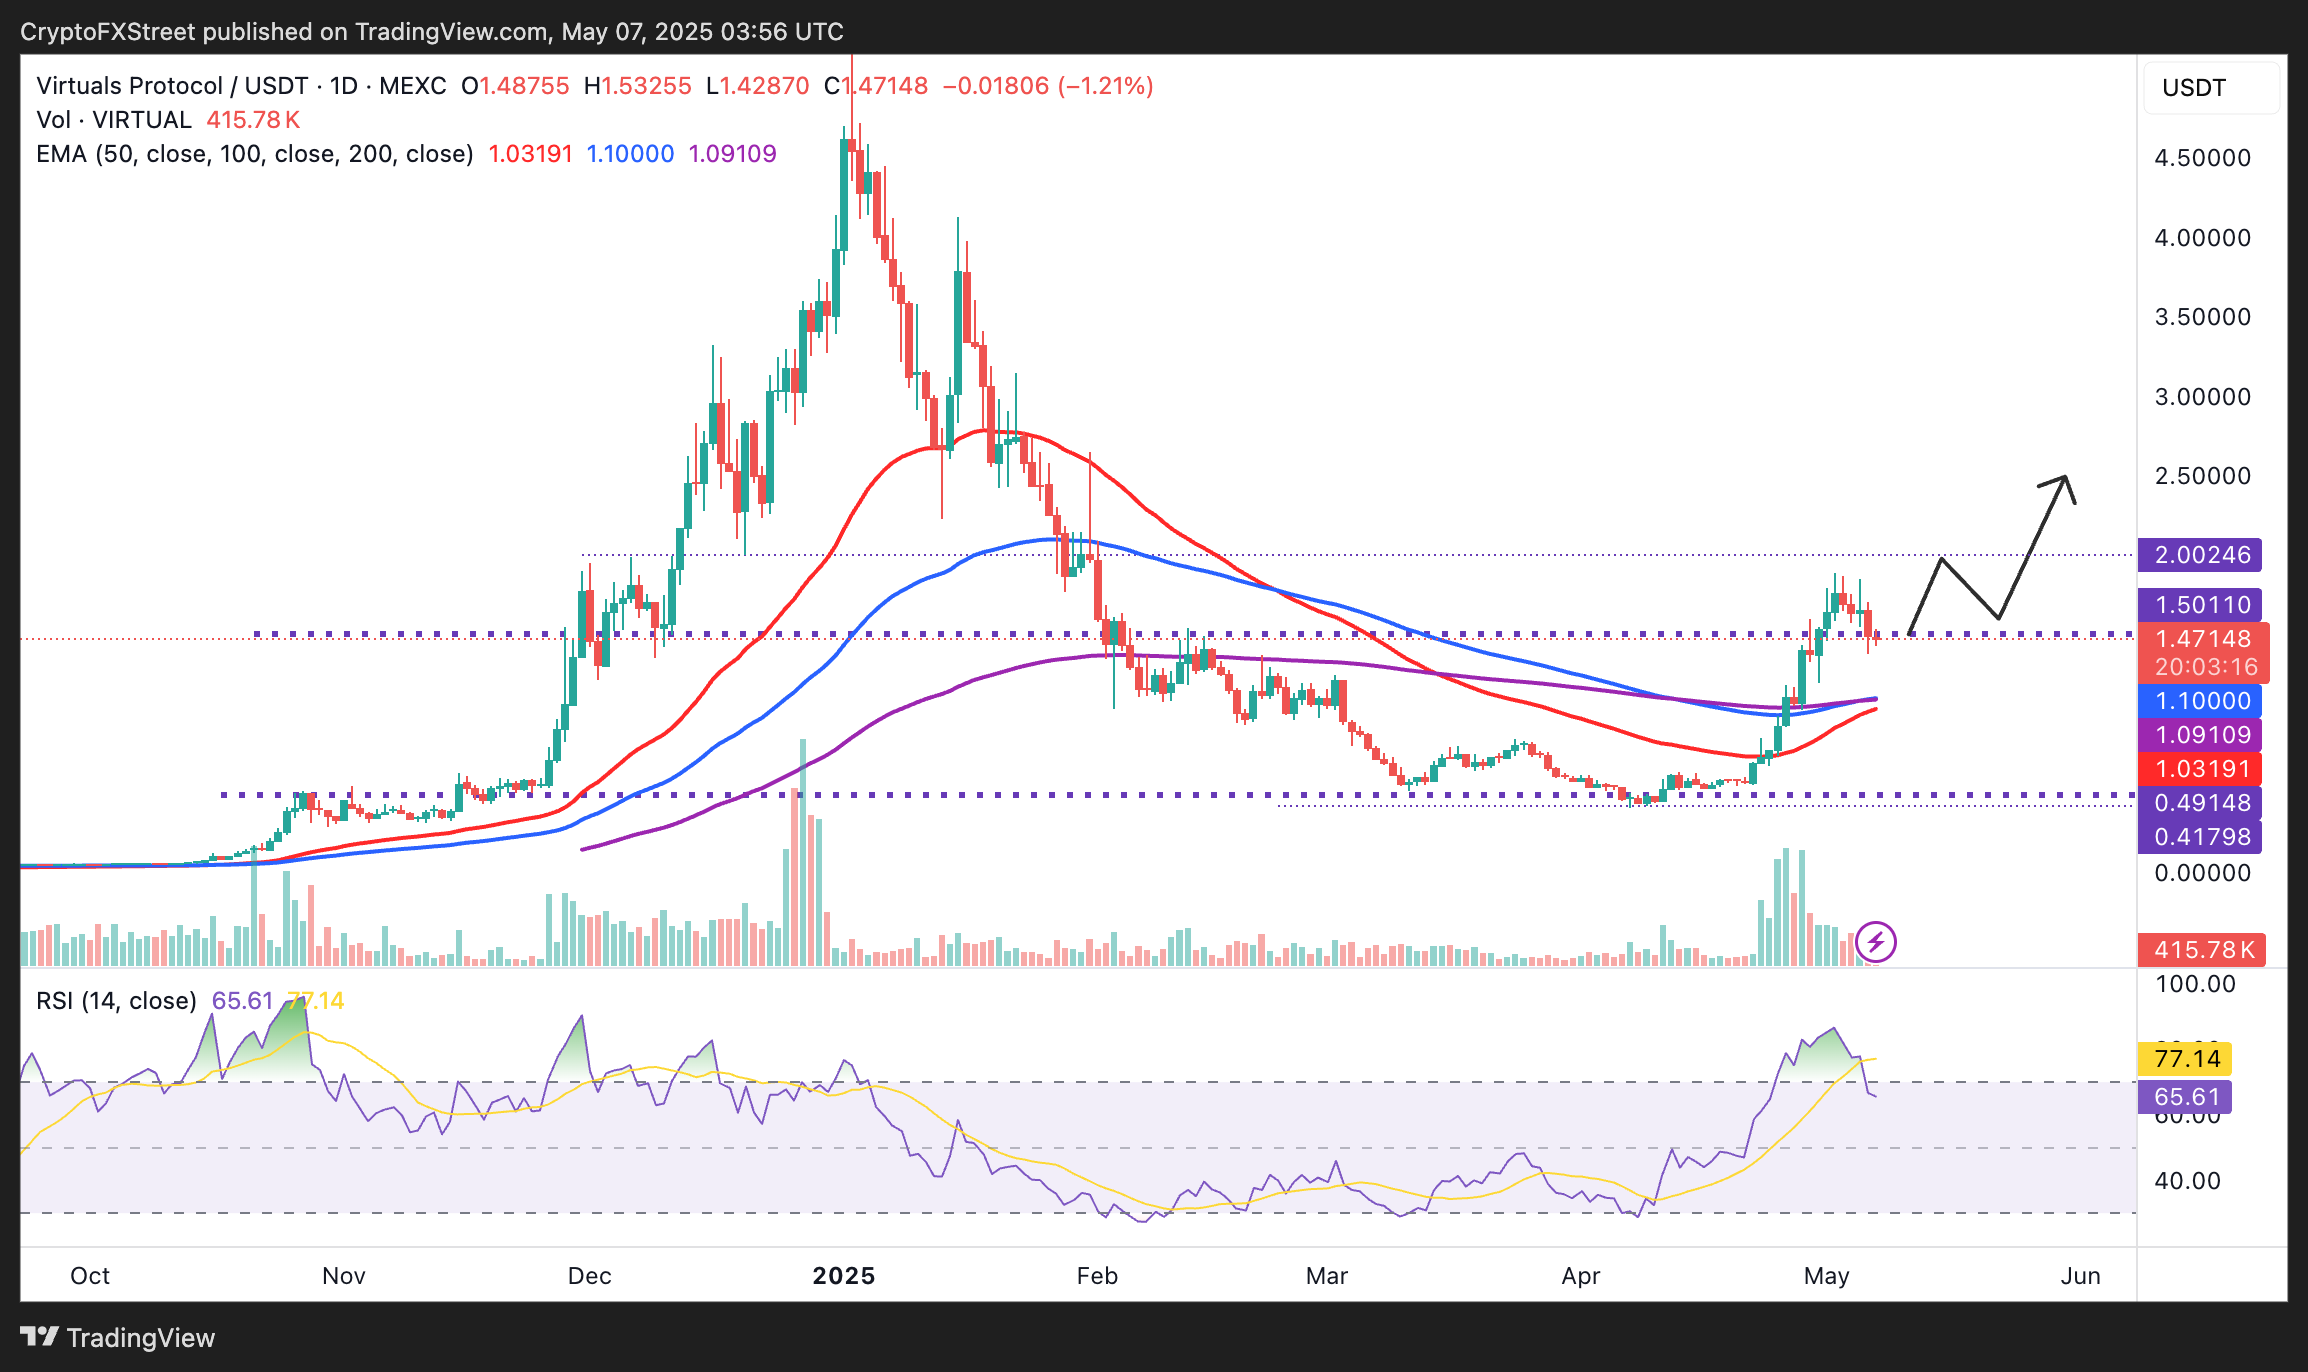
VIRTUAL/USDT daily chart
The path with the least resistance has shifted downwards, with the RSI indicator falling sharply from its recent oversold peak of 86.55 to 64.55. Should this reversal continue below the midline of 50, VIRTUAL could be forced to seek support at $1.09, coinciding with a confluence of the 100-day and 200-day EMAs.
In the meantime, there’s a probability that bulls could reclaim $1.50 as the immediate support, a move that may spur bullish momentum and renew the uptrend targeting $2.50.
Cryptocurrency metrics FAQs
What is circulating supply?
The developer or creator of each cryptocurrency decides on the total number of tokens that can be minted or issued. Only a certain number of these assets can be minted by mining, staking or other mechanisms. This is defined by the algorithm of the underlying blockchain technology. On the other hand, circulating supply can also be decreased via actions such as burning tokens, or mistakenly sending assets to addresses of other incompatible blockchains.
What is market capitalization?
Market capitalization is the result of multiplying the circulating supply of a certain asset by the asset’s current market value.
What is trading volume?
Trading volume refers to the total number of tokens for a specific asset that has been transacted or exchanged between buyers and sellers within set trading hours, for example, 24 hours. It is used to gauge market sentiment, this metric combines all volumes on centralized exchanges and decentralized exchanges. Increasing trading volume often denotes the demand for a certain asset as more people are buying and selling the cryptocurrency.
What is the funding rate?
Funding rates are a concept designed to encourage traders to take positions and ensure perpetual contract prices match spot markets. It defines a mechanism by exchanges to ensure that future prices and index prices periodic payments regularly converge. When the funding rate is positive, the price of the perpetual contract is higher than the mark price. This means traders who are bullish and have opened long positions pay traders who are in short positions. On the other hand, a negative funding rate means perpetual prices are below the mark price, and hence traders with short positions pay traders who have opened long positions.
accelerate

Log in to Reply
Log in to comment your thoughtsComments
Related Articles
|Square
Get the BTCC app to start your crypto journey
Get started today Scan to join our 100M+ users