Cardano Stumbles: ADA’s Bearish Signals Flash Red as On-Chain Activity Tanks

Cardano’s ADA bleeds out as network metrics turn sour—another ’Ethereum killer’ learning the hard way that hype doesn’t pay the bills. Whale wallets are ghosting the chain, and developers are fleeing faster than VC profits in a bear market.
Key red flags: Daily transactions flatline, active addresses drop 22% since March, and that much-hyped ’Voltaire’ governance upgrade? Still MIA. Meanwhile, rival L1s are eating Cardano’s lunch—Solana’s DeFi TVL just hit another ATH while ADA’s dApps wither.
Silver lining? The Ouroboros consensus hasn’t cracked (yet). But with staking yields shrinking faster than a trader’s patience during congestion, even the faithful are questioning if this is the dip to buy—or the exit ramp.
Funny how these ’academic rigor’ blockchains always seem to need a crisis to ship meaningful updates. Maybe they should’ve peer-reviewed their marketing budgets.
Cardano’s network activity and funding rates show a bearish bias
Coinglass’s OI-Weighted Funding Rate data shows that the number of traders betting that the price of Cardano will slide further is higher than that anticipating a price increase.
This index is based on the yields of futures contracts, which are weighted by their Open Interest (OI) rates. Generally, a positive rate (longs pay shorts) indicates bullish sentiment, while negative numbers (shorts pay longs) indicate bearishness.
In the case of ADA, the metric stands at -0.0017%, reflecting a negative rate and indicating that shorts are paying longs. This scenario often signifies bearish sentiment in the market, suggesting potential downward pressure on ADA price.
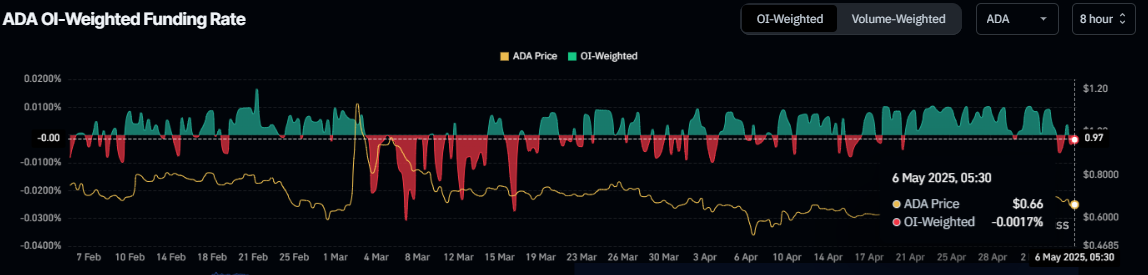
Cardano Funding rate chart. Source: Coinglass
Besides negative funding rates, Coinglass’s Daily Active Addresses index, which tracks network activity over time, also paints a bearish picture for ADA. A rise in the metric signals greater blockchain usage, while declining addresses point to lower demand for the network.
In ADA’s case, Daily Active Addresses have been extending a downtrend starting in early March and reading 21,600 on Tuesday. This indicates that demand for ADA’s blockchain usage is decreasing, which doesn’t bode well for Cardano’s price.
%20%5B08-1746504935609.34.16,%2006%20May,%202025%5D.png)
Cardano daily active addresses chart. Source: Santiment
Cardano Price Forecast: Momentum indicators reflect bearish signals
Cardano price failed to close above the weekly resistance of $0.746 on April 24, leading to a correction of 8.3% over the last 12 days. At the time of writing on Tuesday, it hovers around $0.660.
If ADA continues to correct, it could extend the decline to retest its April 22 low of $0.615.
The RSI on the daily chart reads 46, below its neutral level of 50, indicating bearish momentum. The MACD indicators also show a bearish crossover on Monday, giving sell signals and suggesting a bearish trend.
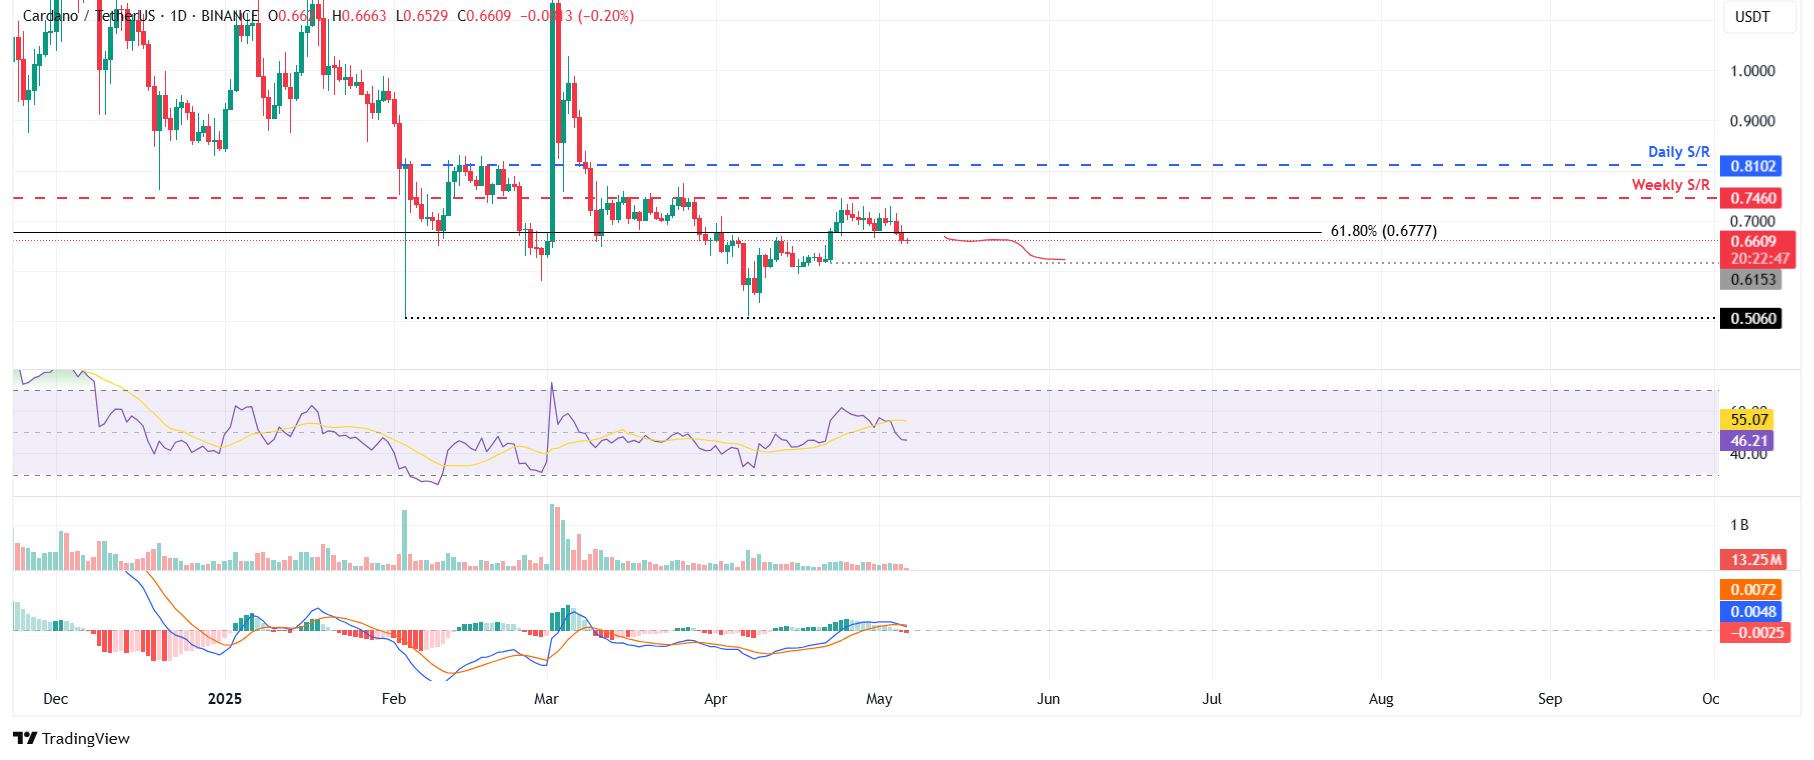
ADA/USDT daily chart
However, if ADA closes above the weekly level of $0.746, it could extend the rally to retest its next daily support at $0.810.
